The short answer: A Scanz Alert watches one specific stock you’re already following and fires the moment that stock hits your exact conditions — so you’re ready to get in it (or out), not watching the replay. Here are the three setups behind my last five trades: how my scan surfaced each stock, and the Alert I armed on it.
My Old Setup Was Good. But I Was Always Late.
Let me paint the scene.
You’ve got a solid setup. You know the kind of stock you’re looking for. You’re even watching a few tickers that fit the mold.
But then, mid-scroll, you see it:
XYZ stock just ripped 30% in 20 minutes. It was your setup, to the letter. And you missed it.
This was my life — until I dialed in my real-time Alerts in Scanz.
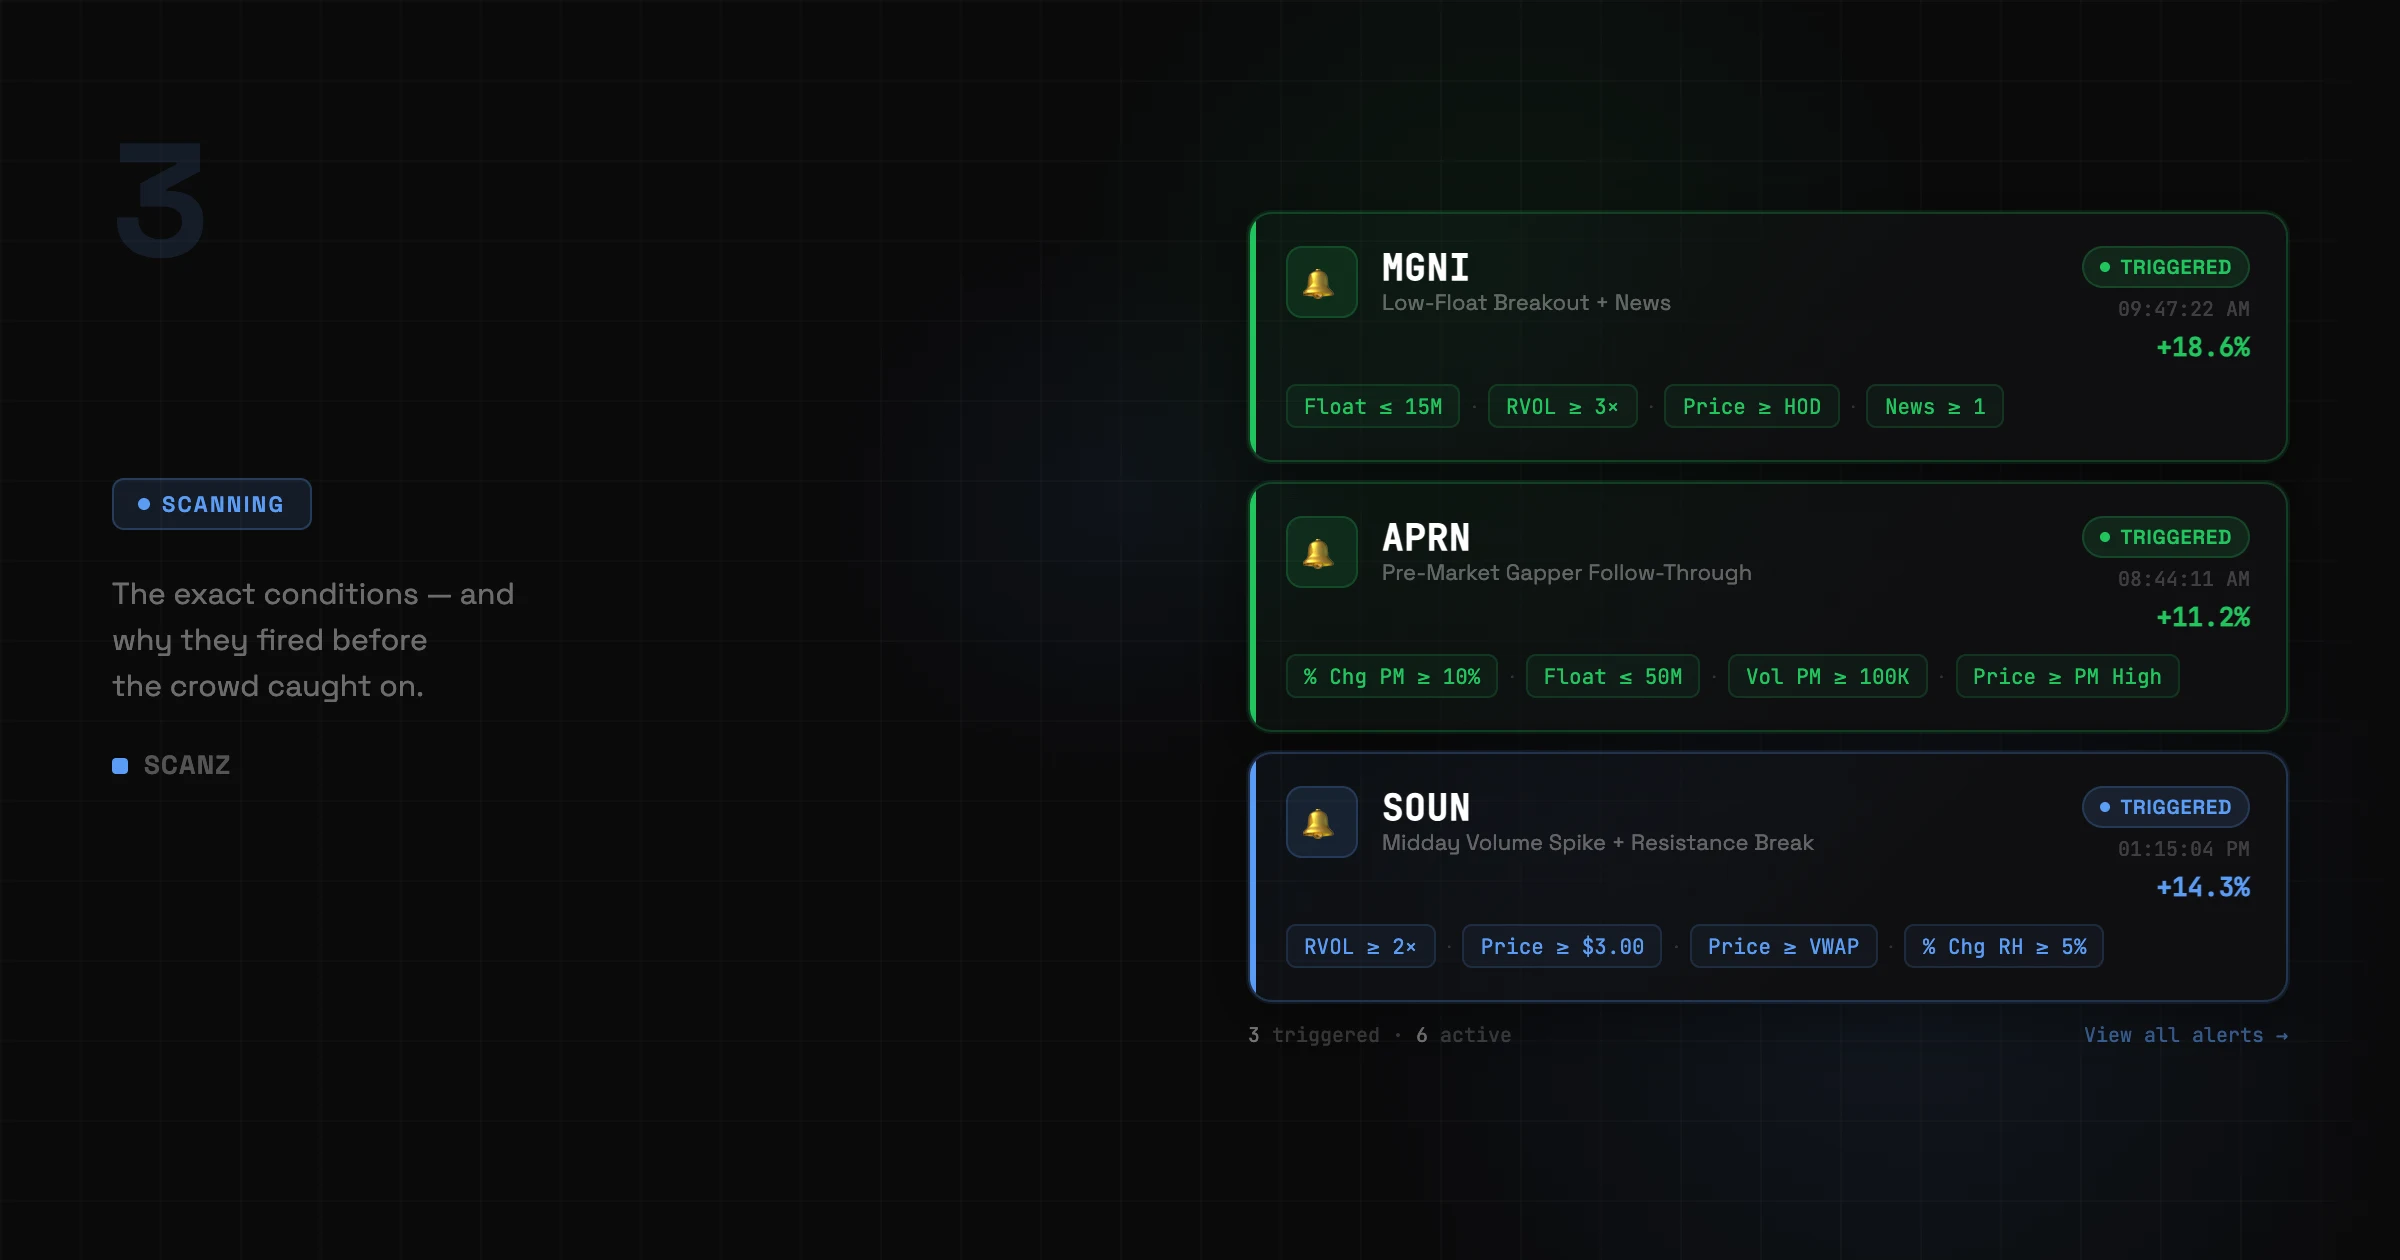
Here are three alerts I use that caught five real trades over the last two weeks.
Quick distinction before we get into it, because it trips people up:
Scanz has a few tools that sound similar but work very differently — and getting them straight is the whole game. The Data Scanner (our core scanner) shows you every stock currently matching your criteria right now — your real-time discovery engine. Turn on its Activity Log (the panel at the bottom of the Scanner) and it pings you — out loud, with your pick of 10 alert sounds — the moment a new stock enters your scan. The Signal Scanner (event detection) fires on specific technical events — New High/Low breakouts, VWAP crosses, volume explosions, moving-average crossovers — across thousands of stocks at once. And Alerts are different from all of those: you pick a specific stock you’re already following, and Scanz notifies you only if that stock hits your conditions. Discovery is the Data Scanner and its Activity Log; execution on the names you’ve chosen is Alerts. This post is about that second half — the Alerts I set on the stocks my scans surface.
Alert #1: “Low-Float Breakout + News”
This one starts in the Data Scanner, not in Alerts. I run these four filters with the Activity Log’s sound on — so the moment a stock enters the scan, I hear it: a low-float name on triple volume, breaking its intraday high, with a fresh headline behind it.
The conditions:
- Float under 15M (Capital Structure filters, set “less than or equal to” 15,000,000 — I’m watching a stock I already know is tightly supplied, where volume moves price fast)
- Relative Volume ≥ 3 (Liquidity filters category — compares current activity against the stock’s historical daily average. 3x means it’s trading at triple its normal pace. Something real is happening.)
- Last Price ≥ High (RH) (Price filters, dynamic field comparison — operator “greater than or equal to”, value set to “High (Regular Hours)” rather than a fixed number. Fires the moment price crosses the intraday high.)
- News Count ≥ 1 (News filters category — requires at least one headline published in the current session from Scanz’s news sources)
Why I use it:
I’m not hunting any breakout — I want the specific catalyst-backed setup, and the news filter separates signal from noise. The Activity Log surfaces the candidate the instant all four conditions line up. Then, on that specific ticker, I set an Alert for my entry trigger — price reclaiming the high — so Scanz pings me the moment that one stock is good to go.
What it caught:
$MGNI on an earnings beat — opened at $8.20, broke $9.70 with heavy volume. Alert fired at the exact moment it cleared the HOD. I was already in the order ticket.
$CLSK on an AI-related PR drop — surged through $6.80 resistance with the news filter already confirmed. Clean entry, no guessing whether there was a catalyst.
The lesson:
Don’t just chase breakouts. Chase breakouts with story and volume. Keep the Activity Log’s sound on while you scan (Sound button → pick a tone) so you hear a qualifying stock the moment it appears — even if you’ve stepped away from the screen.
Alert #2: “Premarket Gappers Over 10% + Float Under 50M”
The conditions:
- Percent Change (PM session) ≥ 10 (Change filters category, session set to PM — measures % move in pre-market session only)
- Float ≤ 50M (Capital Structure filters — keeps me in stocks where supply constraints matter)
- Last Price between $1 and $20 (Price filters, two conditions: “greater than or equal to” $1 and “less than or equal to” $20)
- Volume (PM session) ≥ 100,000 (Liquidity filters category, session set to PM — confirms real pre-market interest, not a single thin print pushing the number)
Why I use it:
This one lives in the Data Scanner, with the Activity Log doing the heavy lifting. I run these filters pre-market with sound on, and every time a new stock crosses 10% on real volume, the Log calls it out — so my A-tier list builds itself while I’m still making coffee. The Data Scanner (Prebuilt “Gainers (Pre-Market)” scan) gives me the full picture; the Activity Log makes sure I never miss a fresh gapper. By 9:20am I’ve got my shortlist — then I set Alerts on the specific names I want to trade for their exact entry triggers.
What it caught:
$APRN before the open — news plus retail flow equalled a solid scalp after the 9:30am bell. The Activity Log flagged it at 8:45am. I was watching it from the start.
$RIVN gapped 11%, surfaced on the Log, gave a clean pop and fail setup at the open. I was already positioned with context because I’d had 45 minutes of pre-market data by the time it moved.
The lesson:
This scan doesn’t make me money directly — but it saves me hours, and it’s built stronger, more intentional watchlists than anything I was doing manually. Pair it with the News Scanner (filtered to the same Float and PM Volume criteria — surfaces the actual headline driving the gap) to understand the catalyst before the open.
Alert #3: “Midday Volume Spike + Prior Resistance Break”
The conditions:
- Relative Volume ≥ 2 (Liquidity filters category — compares current session volume against the stock’s historical daily average. 2x during the midday window, when volume typically thins out, means something is building.)
- Last Price ≥ [resistance level] (Price filters, operator “greater than or equal to”, set to the specific price I tagged on the chart — usually a prior morning high or a level that’s rejected twice)
- Percent Change (RH) ≥ 5 (Change filters category, session set to Regular Hours — keeps me in names that are already working intraday, not just fluttering around flat)
Why I use it:
I’m not always in front of screens midday. But this alert has caught some of the cleanest continuation plays I’ve ever seen. Most day traders lose money between 10:30am and 2pm — either overtrading or missing slow grinders that set up again. This alert handles both problems. I’m not watching 15 charts. I’m not forcing trades. I’m waiting for volume to prove the setup.
What it caught:
$VERI pushed through $2.20 with big volume at 11:37am. Alert fired. I was in within two minutes.
$SOUN reclaimed $3.00 after a slow grind — it exploded into the close. I’d completely stepped away from screens. The alert hit my phone and brought me back. Entry was still clean.
The lesson:
Not every winner happens at the open. These alerts help me stay patient and still catch great entries during what most traders write off as dead time. The RVOL filter is the key — midday volume on a low-float stock at 2x its daily average means there’s real conviction behind the move, not just drift. Review your Triggered Alerts history (Alerts sidebar, “Triggered Alerts” tab — logs every alert that fired with timestamp and condition) weekly. That log is the most honest feedback you’ll ever get on whether your criteria are actually working.
You’re Only as Fast as Your Scanner
Look, I still miss trades sometimes. That’s part of the game.
But I don’t miss them because I didn’t see them.
I miss them because I made a decision. That’s a world of difference.
Scanz doesn’t just dump tickers on your lap. It lets you define your edge, your triggers, your timing, your type of move — without writing a single line of code — and lets the alerts come to you. Efficiency at its best.
These are just three examples. I have over a dozen saved now.
Each one gets better the more I tune it. Each one saves me from overtrading. Each one makes me money.
If you’re serious about this game, build your alert system like a pro.
Because by the time the chatroom starts talking about it…
I’m already in the trade.
Frequently Asked Questions
What are real-time stock alerts? Real-time stock alerts notify you the instant a specific stock hits conditions you’ve defined — a price level, a volume threshold, a technical trigger — updating as the market moves. Scanz Alerts fire based on data that refreshes continuously throughout the session, so the notification reflects what’s happening now, not a delayed snapshot.
What’s the difference between Alerts and the Signal Scanner in Scanz? The Signal Scanner fires across the entire market — you’re saying “tell me the moment ANY stock matching these filters breaks to a new high.” Alerts target specific stocks you’ve already identified — you’re saying “tell me when THIS stock hits my entry level.” The Signal Scanner is for discovery and broad market coverage. Alerts are for execution on your shortlist. You need both running simultaneously.
Can I combine multiple conditions in one alert? Yes — stack several conditions on the ticker you’re watching, like a price level plus a volume threshold, and all must be true at once for the Alert to fire. Just remember the division of labor: market-wide discovery filters like float belong in the Data Scanner that surfaces the stock — the Alert watches the specific name you’ve already chosen.
How do I get notified when an alert fires? When you create an Alert, pick your notification methods in the Notifications dropdown — Email and Push (browser or device). For an audible heads-up while you’re scanning, turn on the Data Scanner’s Activity Log sound: it plays a tone the moment a new stock enters your scan, even if Scanz is running in the background.
Where do I see my alert history? Your Triggered Alerts tab (Alerts sidebar, left panel) shows every alert that has fired — what triggered it, when it fired, and how long after you created it. Use it to audit your criteria weekly. Alerts that never fire might have thresholds that are too tight. Alerts that fire constantly and don’t lead to good trades need tightening.
How many alerts should I run at once? Keep your Active Alerts list focused. Five to ten is plenty for most traders. More than that and you’re creating noise — alert fatigue is real. Every alert should represent a stock you’d actually trade and a level where you’d actually act. If you’re ignoring alerts when they fire, you have too many.
What’s the difference between Alerts and the Data Scanner in Scanz? The Data Scanner monitors the entire market continuously and shows you every stock matching your criteria right now — it’s for broad market discovery. Alerts watch specific stocks you’ve already added and notify you when they hit your conditions — it’s for execution on your shortlist. Build your watchlist with the Data Scanner first, then set Alerts on the best candidates.
Start your 7-day free trial. Scanz Starter and Pro both include real-time stock Alerts with email and push notifications, full Triggered Alerts history, the Data Scanner with its sound-enabled Activity Log, and the Signal Scanner. Try Starter or Pro today. No commitment, cancel anytime.