The name Dow Theory comes from a series of editorial pieces written by Charles Dow, then editor of the Wall Street Journal. He never used the phrase himself, rather, his works were collected and made sense of by people like Robert Rhea, author of The Dow Theory.
In short, Dow Theory is a technical analysis based trend following school of thought. Dow separated market moves into different types of trends, of phases of trends. His technique had very little fundamental basis, as he believed all public information was already reflected in market prices.
This article will go over the basics of Dow Theory, and how traders can leverage it in the modern market.
One of the tenants of Dow Theory claims that excessive manipulation of the market is not possible. Manipulation of individual stocks and small movements in indexes were possible, however, the manipulation could not continue indefinitely, at some point the manipulation is discounted. To use Dow’s favorite phrase, the “primary trend” could not be manipulated, as the market is too large.
Applying this principle in a modern, post-internet marketplace, there are many more manipulation opportunities, especially in the small cap world. There are day trading chat rooms where the host loads up on a stock and gets all of his subscribers to long the stock, selling into their buy orders, there are social media platforms like Twitter and StockTwits where speculation about stock prices run rampant. This can make a low float, small cap stock’s price go wild in the short term, however, if the speculation has no underlying fundamental ground to stand on, Dow Theory says this manipulation of prices will eventually be discounted.
A market principle that Dow lived by was that all information known about a stock or index is already discounted and reflected in the price of the asset. This is also a major principle most technical analysts follow, most believe that little to no edge can be attained by reading news and company reports, that other astute investors have already delved over the information and reflected it into the price with their market action.
This is not to say that the reflected price is correct, or that the market can predict the future, but that the market has such a significant amount of diverse participants, that the mass opinion of the information is already discounted.
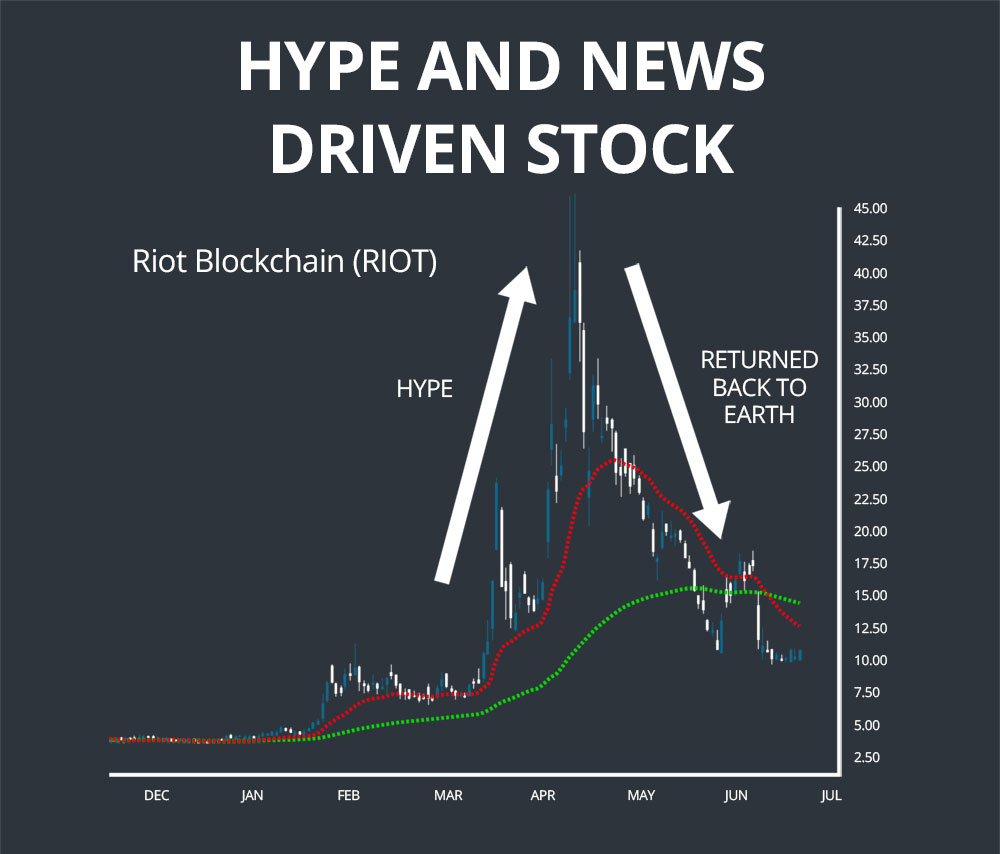
Many traders go against this belief and trade stocks based on rumors and news. An example of a hype and news drive stock is Riot Blockchain (RIOT), which was a biotech company that decided to venture into blockchain technology. Because of the current hype around the cryptocurrency market and blockchain in general, the stock went from $8.00 to $40.00 in a matter of two months, however, the stock eventually returned back to earth.
Dow theorized that within long term market trends, there exists shorter “sub-trends” in the opposite direction within the longer term trend. He identified three different types of trends:
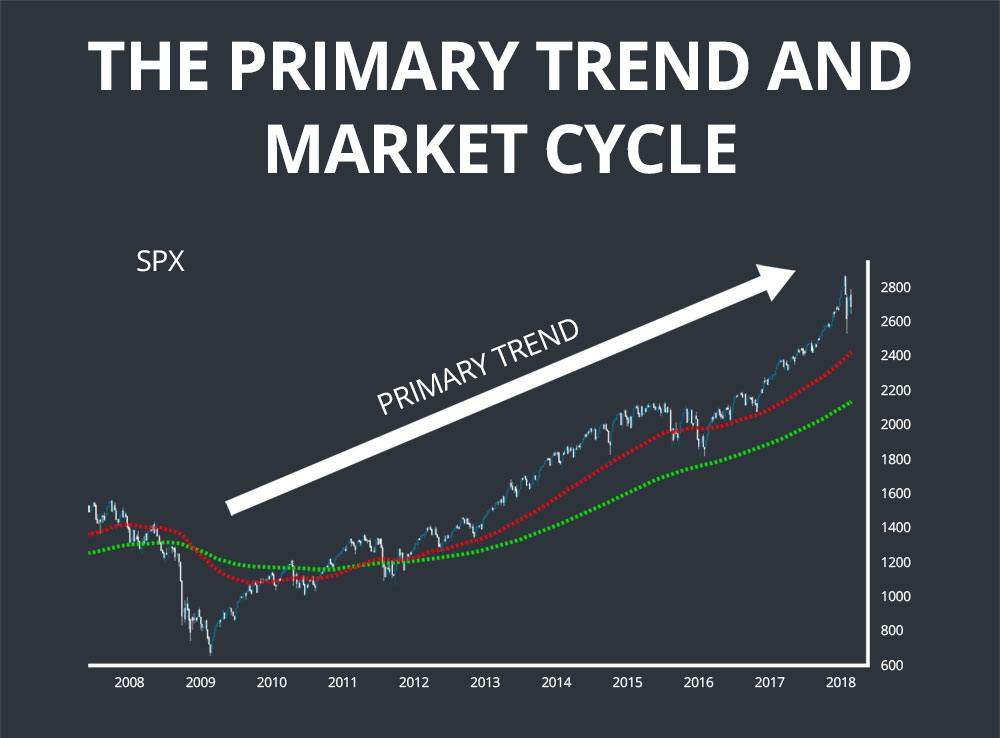
The primary trend is the long term trend that identifies where the market is in it’s cycle. A primary uptrend would signify a bull market. The primary trend’s influence trickles down on all market behavior while it’s in motion. Traders and investors think a certain way in bull markets, and another way in bear markets.
Currently, the S&P 500 is in an upward primary trend.
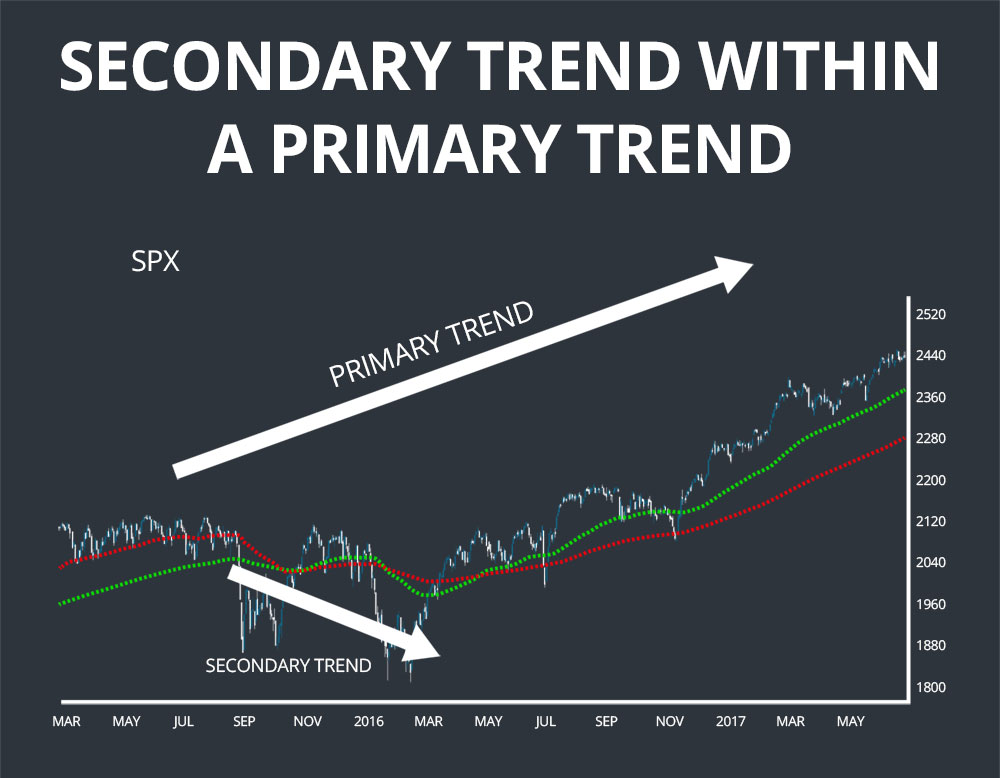
The secondary, or intermediate trend, are shorter term trends, often lasting weeks to months, in the opposite direction of the primary trend. A bearish secondary trend does not change the fact that the market is in a primary uptrend.
In a primary uptrend, a series of higher highs and higher lows is made, a secondary trend within that uptrend is the price moving from a higher high to a lower high.
For example, here is a secondary downtrend within the current primary uptrend in the S&P 500.
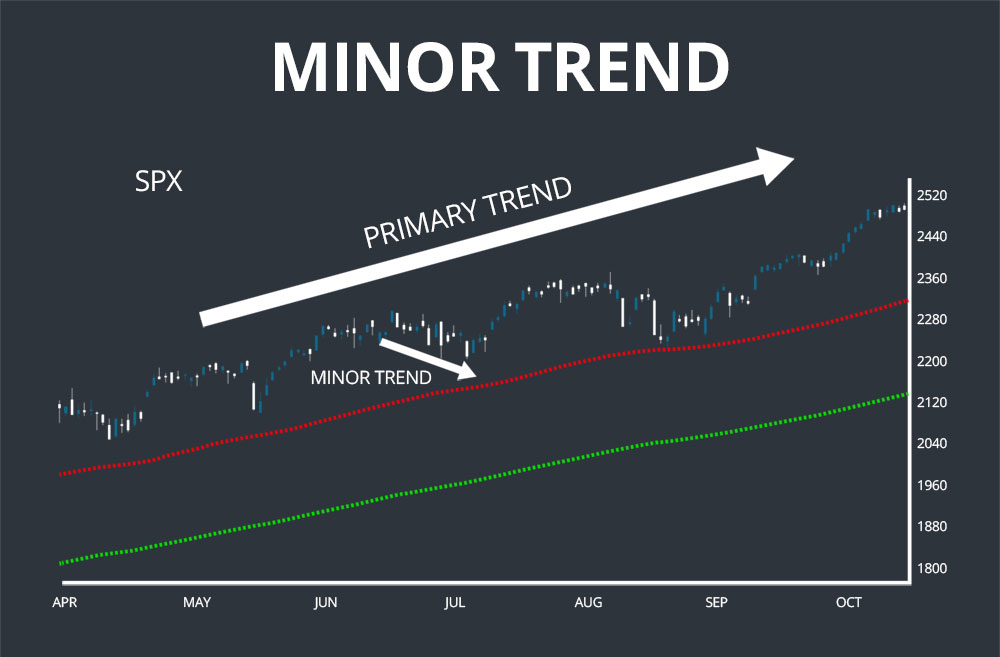
The third of the three trends is the minor trend. They last 1-3 weeks and are generally short-term, counter-trend pullbacks like the one featured below.
According to Dow Theory, there are three stages of a primary trend, they are:
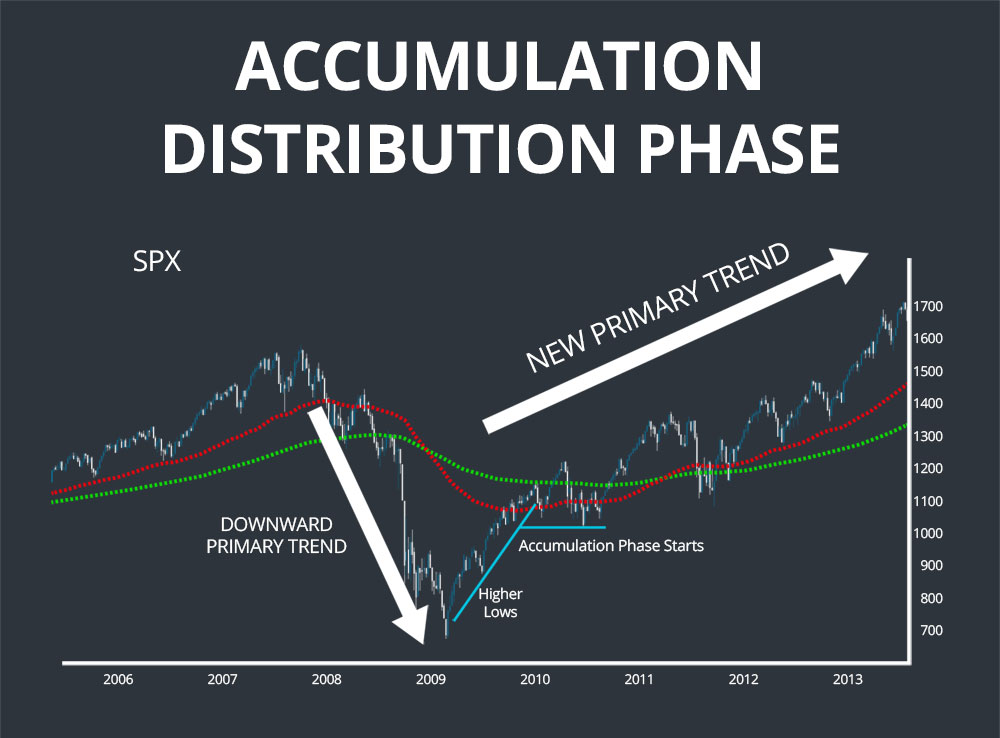
This is where “smart money” enters the market. It is usually somewhat close to the bottom of a downward primary trend. You know an accumulation phase is right around the corner when sentiment seems to be at its worst. When all of your neighbors are bearish, when nothing but bearish news airs on TV, start watching your charts, because there are very few sellers left in the market.
From a technical perspective, the start of an accumulation phase is when a downward primary trend begins to make higher lows, and then finally makes a higher high.
After bottoming out in 2009, the S&P began to rally. It could have easily been a secondary or minor trend, so Dow Theory proponents had to wait for confirmation, like taking out the most recent high, and making a few higher lows. This is where smart investors saw that the crash had been priced in, negative sentiment was at a high, and began buying.
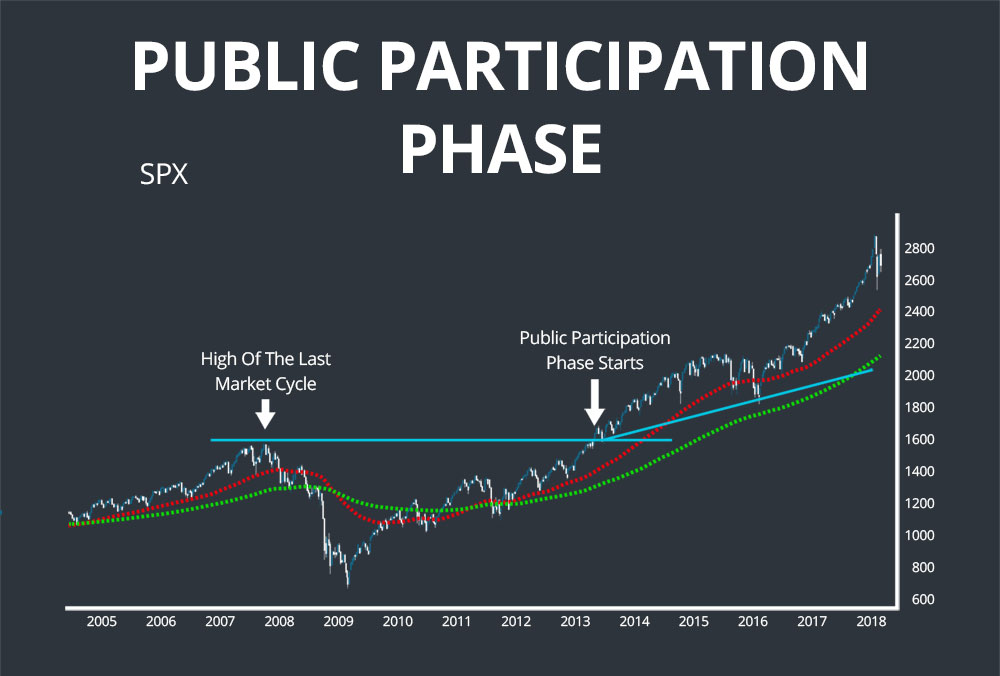
This is the phase where most people agree that the crash or bear market has ended and the general public feels safe getting back into stocks and riskier assets. It typically starts after the price of the market has exceeded the high of the last market cycle.
This is when pundits on CNBC start using the phrase “bull market” again, and is supported by a growth in corporate earnings and other macroeconomic measures.
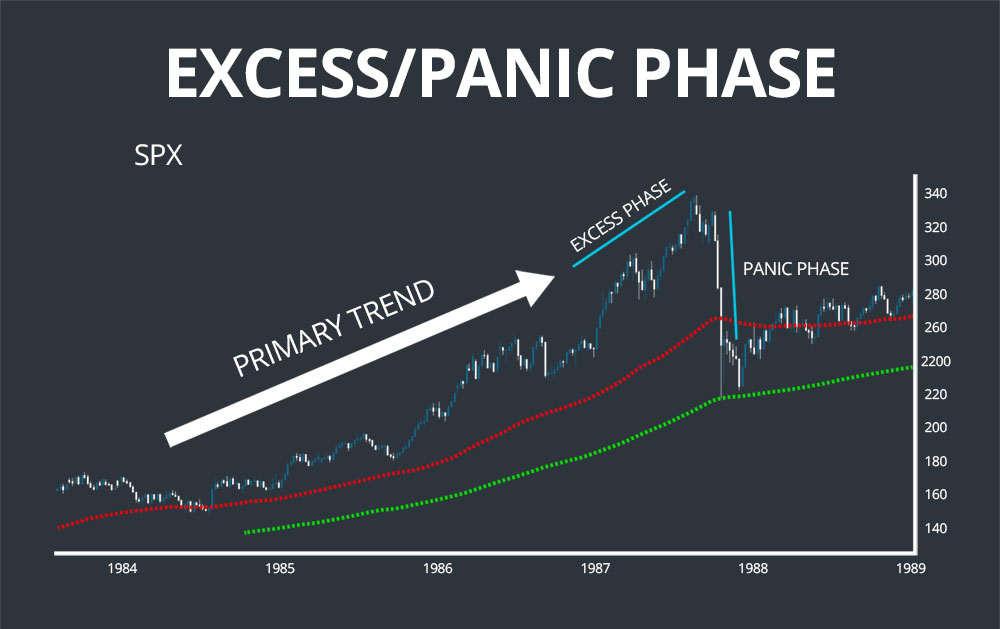
There’s a common phrase, it goes something like “When the shoe shiner has a stock tip, sell your stocks.” The shoe shiners get into the market during the excess phase, when it seems like the market can only go up. This is where the smart money sells their stake to the shoe shiners.
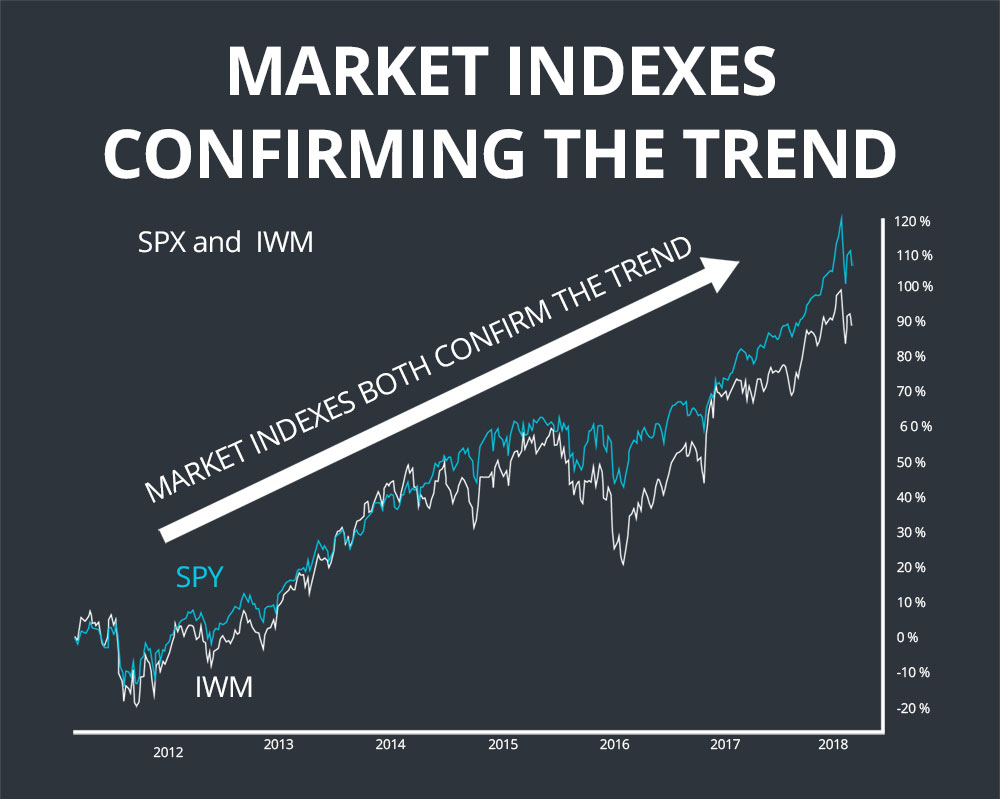
Dow claimed that a market trend did not start until the market indexes both confirm the trend. In Dow’s day, there were two main indexes, the Dow Industrial Average, and the Dow Rail Average. Times have changed, and so have the indexes stock market investors follow. Investors have more choices in what indexes they can follow now, between the NASDAQ Composite, the NASDAQ 100, the S&P 500, the Dow Jones Industrial Average, the Russell 2000, and the Russell 3000.
Generally, you should use just two, and I recommend the S&P 500, a market cap weighted index of the largest 500 U.S. companies, and the Russell 2000, which is a market cap weighted index of the bottom 2000 companies in the Russell 3000, which tracks the top 3000 companies in the U.S. The Russell 2000 is the most popular small cap index.
Volume Confirmation
As a general principle in Dow Theory, volume should be harmonious with the current trend. If the stock is in an uptrend, volume should be increasing with advances in price, while decreasing with declining prices. Volume shows the conviction of the traders and investors trading that stock. If volume begins to decrease with price increases, there are less bullish traders/investors wanting to buy higher prices.
Our new prebuilt scans make it simple for anyone to start profiting immediately with proven…
Most Active Big Board Stocks TSLA, SPY, AAPL, AMZN, AMD, NVDA, QQQ, TQQQ, MSFT, META…
Most Active Big Board Stocks TSLA, AMZN, AAPL, NVDA, AMD, SPY, MSFT, QQQ, AGLE, TQQQ…
Most Active Big Board Stocks TSLA, NVDA, AMD, SPY, AAPL, AMZN, INTC, QQQ, MSFT, AHI…
Most Active Big Board Stocks TSLA, VCIG, NVDA, AAPL, SPY, AMD, AMZN, MSFT, QQQ, INTC…
Most Active Big Board Stocks TSLA, NVDA, SPY, AAPL, AMD, MSFT, QQQ, AMZN, SPCE, TQQQ…