Investors and traders tend to make their decisions based on two schools of thought within securities finance: fundamental analysis and technical analysis. Boiled down to it’s simplest, fundamental analysis deals with the value of a company/security, and the many facets that come with it. Technical analysis, on the other hand, doesn’t deal with any tangible fundamental data, rather, it deals with market data like historical prices. The two schools of thought also diverge when it comes to time frame, technical analysis often focuses on the shorter term, while fundamental analysis generally focuses on a much longer term view.
Within fundamental analysis, there are two main schools of thought: value and growth.
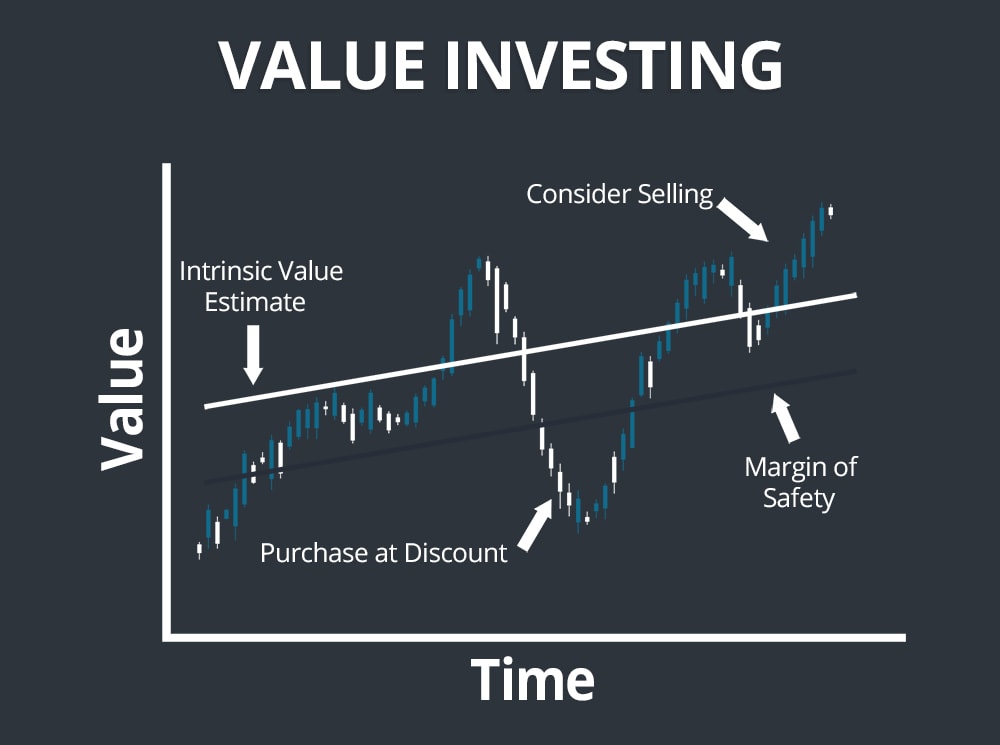
Value Investing
Value investors look for companies trading below their long term average valuation metrics, like low price-to-earnings ratios relative to the company’s industry. They look for good companies that will last many market cycles trading at “inexpensive” levels. Value investors, at their core, are deeply contrarian, they buy assets out of favor with the market hoping the market eventually comes to their senses. They tend to have a longer timeframe than the average investor, hoping to own a stock until given a reason not to, they’d prefer to hold a stock forever if they could.
A key difference between value investing and other investment strategies is the lack of faith in projections. They put little importance on a company’s growth projections, they prefer to view companies as they are today, putting little to no premium on the company for optimistic projections.
Value investors tend to look at risk differently than the rest of the securities industry. They generally don’t use risk parameters like Modern Portfolio Theory often employed by large institutions, nor do they favor a wide diversification of assets, preferring to instead focus their capital on a select few high conviction investments.
The industries value investors choose to invest in are usually age-old industries with easy to understand business models and solid financials. Generally, they avoid “the next big thing,” as these companies seldom have a sustainable business model, with their investors instead betting on the company’s and industry’s growth figuring out the financial incompatibilities along the way. For example, Warren Buffett famously avoided the dot-com bubble of the late 1990s because he didn’t understand the industry, choosing to stick to the industries he knew best, like food & beverage and insurance.
Within the value investing world, there’s a number of thought leaders with divergent views on minor factors but, they tend to mostly agree philosophically. Some high profile value investors are Warren Buffett, Charlie Munger, Seth Klarman, Ben Graham, and David Dodd.
Key texts to read if interested in value philosophy are:
- *The Intelligent Investor *by Benjamin Graham
- *Security Analysis *by Benjamin Graham and David Dodd
- *The Warren Buffett Way *by Robert Hagstrom
- *Margin of Safety *by Seth Klarman
Growth Investing
Growth investors, on the other hand, discount traditional value investment principles. Rather than looking for “inexpensive” stocks, most stocks they buy are trading at high valuations. In contrast to value investors, they place little importance on the the company’s valuation and financials today, effectively placing a bet that the company will grow exponentially.
Growth investors have their own metrics they pay attention to. The same way P/E ratio is the stereotypical ratio used by value investors, earnings growth is the most important metric to growth investors. They like to see an upward trend of improving earnings, in addition to stronger forward earnings projections.
Growth investors tend to take the view that if a company is trading below their industry P/E average, it’s because the market doesn’t believe the company’s earnings are worth the industry average, and that they may be on the decline. Growth investors don’t believe in “inexpensive” stocks. They view valuation ratios like P/E and price-to-book as a measure of how much the market is willing to pay for that company. In their eyes, companies with higher readings of these metrics are higher quality companies that are more likely to grow and outperform the market.
Some popular growth investors are Philip A. Fisher, William J. O’Neil, and Peter Lynch. Key texts about growth investing are:
- **Common Stocks and Uncommon Profits by Philip A. Fisher
- **How to Make Money in Stocks by William J. O’Neil
- ***One Up On Wall Street *by Peter Lynch
- **Beat The Street by Peter Lynch
Top-Down vs. Bottom-Up
In addition to the vast array of fundamental investment strategies (most falling into the growth or value camp in some way), there are different orders in which to approach markets. Some investors choose to start at the top, looking at the economy and broad stock market, gradually moving down, while others start from individual stocks and move up from there.
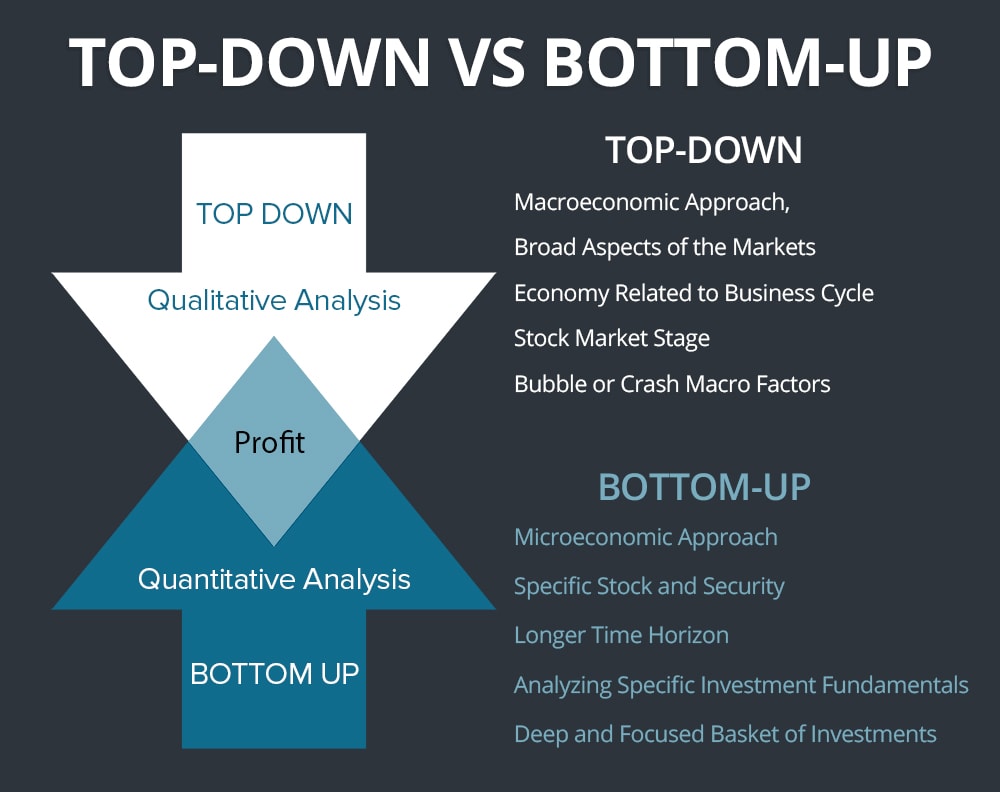
Top-Down Approach
A top down approach, often referred to as a “30,000 foot view” is starting by looking at the most broad aspects of the markets. This generally involves by beginning with identifying which position the economy is in the business cycle, which stock market stage we are in, macro factors that could lead to a bubble or a crash, which sectors are expanding and which are contracting, things of that nature. Once the investor has formed a view on the economy/broad market, they will then move down a step to narrow their choice of investments. For example, if one examined the current market climate and observed massive risk in student loans and pensions, they could choose industries safe-guarded from these crises. Conversely, they could choose to short industries most affected by it.
The main factor differentiating top-down from bottom-up is the lack of bias towards any specific security. They form a broad view on the market and choose appropriate securities to express that view.
Bottom-Up Approach
Bottom-up analysis involves starting from a specific stock/security and analyzing the fundamentals of it before even looking at it’s industry, sector, or market climate. Often times, macro factors like the broad market and the stock’s sector are but an afterthought to the bottom-up investor. This approach is generally favored by value investors like Warren Buffett. The rationale is that a great company will perform well regardless if it’s industry or the market is on a decline. Bottom-up investors generally have a longer time horizon than top-down investors, as well as a more focused basket of stocks that they choose to get a deep understanding of, in contrast to top-down investors who regard individual companies as less important and would prefer to use companies to expose their portfolio to certain industries/sectors.
You can look at top-down investing as a macroeconomic approach, and bottom-up investing as a microeconomic approach.
Using Fundamentals in Trading
The prevailing view is that fundamentals only have utility in longer term investing. This is partly true, as fundamentals rarely change over short time periods, and are usually priced into the stock shortly after becoming public information. For this reason, most traders are encouraged to ignore a stock’s fundamentals when trading it, which I believe is a mistake.
Fundamentals, on any time frame, have an influence on how a stock is traded. It stands to reason that a stock with great growth and margins in a strong, growing industry would be coveted by the investing public, while a contracting, capital-intensive company in a dying industry would be a candidate for short sellers.
Even on a micro time frame like a 5 minute chart, there are still investors making decisions about the stock, which the fundamentals strongly influence.
Shareholder Sentiment
In addition to fundamentals being key to theorizing how new participants in the stock may behave, it also gives you insight on the sentiment of the current shareholders. Shareholders in a growing company with great financials are probably feeling more bullish with each passing day, while shareholders in a failing company may just be looking for the best price to sell at, with no intention to hold long term.
A new high in a growing company that has been producing above-market returns for their shareholders will have drastically different psychological effects on its shareholders than a new high in a failing company. While the new high for the growing company may give the shareholders confidence to add to their positions, the new high for the failing company may spur strong selling from unhappy shareholders who are just happy to get out at a decent price. This is how you can use fundamentals to predict support and resistance levels.
This concept is similar to gauging the sentiment of shareholders in technical analysis. Technicians often theorize that resistance in a downtrending stock is stronger than in an uptrending stock. The positions of the shareholders in the downtrending stock have likely been in the red for a while, and the resistance point looks like a good price to get out of the stock. One can use the fundamentals of a company to predict this sort of reaction before visible price levels form.
Getting an Edge in Breakout Trading
In addition to gauging shareholder sentiment, knowing the fundamentals of a stock can help forecast the probability of a breakout trade’s success.
Like mentioned earlier, the psychology of a breakout differs from stock to stock. Even in an uptrending stock, one cannot be sure of the long term shareholder’s psychology. Because most long term investors use fundamental analysis, if an uptrending stock has weak fundamentals, shareholders may view a new high as a good point to sell their shares. For this reason, knowing key fundamental data points will give you a huge edge over most technical breakout traders.
Using a simple growth stock filter like William O’Neil’s **CANSLIM **when trading breakouts can not only improve your probability, but it can also put you aboard some of the strongest runaway trends the market has to offer. By putting both technicals and fundamentals in your favor, you can reduce the amount of “fakeouts” you trade.
Here is an overview of O’Neil’s CANSLIM model:
- C: Current quarterly earnings per share (EPS)
- A: Annual earnings trending over five years
- N: New highs in stock, new products in company’s pipeline, or a new business model
- S: Supply and Demand (stock buybacks, low float)
- L: Leader in it’s industry
- I: Institutional sponsorship
- M: Market direction (S&P, Dow, NASDAQ in uptrends)
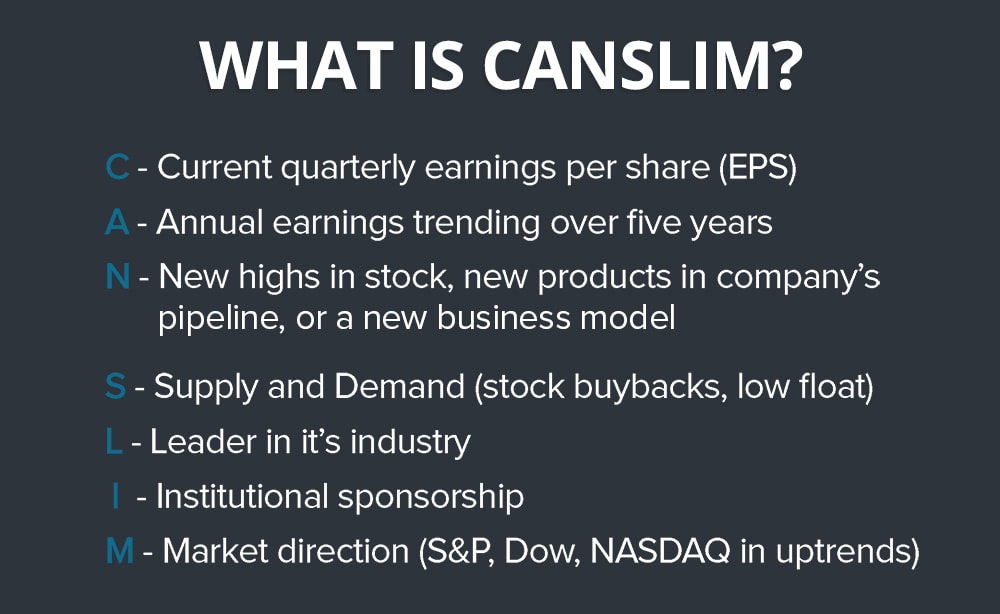
Boiled down to it’s simplest, CANSLIM looks for a stock with an upwards earning trend that is a leader in it’s industry. Once a stock fulfilling these parameters hits a new high, it’s a candidate for a breakout trade.
Data Points to Look At
In addition to looking at a model like CANSLIM, there are a few individual data points that are vital to the trader seeking to use fundamentals to improve the probabilities of his short term trades.
Earnings Per Share (EPS)
Earnings are the most important factor of a stock price, and they drive the stock market. The term “earnings” refer to the net income of a company, or the amount of after-tax, after-operations, total profit a company earns.
Imagine running a small business, what do you care more about, how much you produce in sales, or how much money you can actually take home at the end of the day, after costs like taxes, operations, and paying your employees?
Operating Margins
A company’s operating margins tells you how much revenue it actually gets to keep, after operations and costs.
For example, McDonalds (MCD) had operating margins of 31% for the fiscal year of 2016, meaning for every dollar in sales, they made 31 cents of profits.
Operating margins give you insight into a company’s efficiency. Companies with very low margins are capital-intensive, meaning they require a lot of capital only to produce minimal profits. Additionally, companies with low margins are a few bad deals away from not being profitable at all, as increased costs may erode the small profits the company is currently producing.
While it is great to look for a company with excellent margins, the most important aspect for traders when observing margins is the trend. Regardless if the company’s margins are 4%, or 40%, the key to a stock price increase is improving margins. A stock with poor, but improving margins will likely perform better than the stock with great, but deteriorating margins.
Price to Earnings Ratio (P/E)
Price to earnings ratio is the most popular valuation measure used by investors. It is found by dividing the stock price by it’s earnings per share (EPS).
Old school value investors used P/E to determine whether a stock is “inexpensive.” While this may be fruitful for the long term investor, it serves little to the shorter term trader. Instead, a trader should look at a stock’s P/E as a sentiment indicator.
-
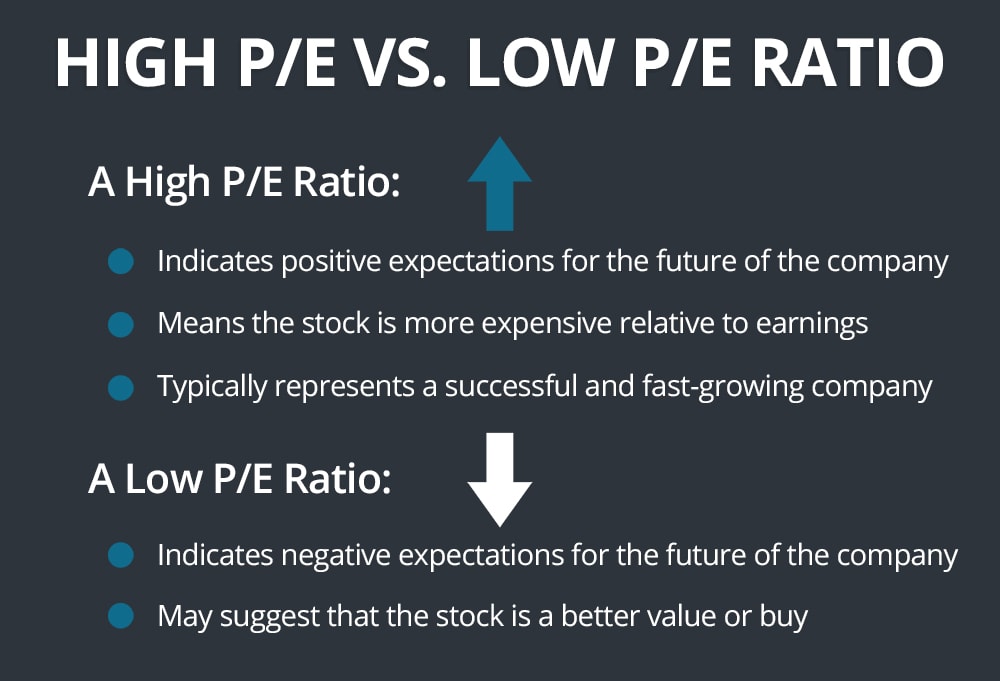
A high P/E ratio indicates the market is bullish on the stock’s future earnings. The market predicts the earnings will grow.
A bearish report on the earnings guidance (company’s forecasted earnings) will drastically affect the stock price, as investors are paying a high P/E in anticipation of improving earnings.
A low P/E ratio indicates the market is bearish on the stock’s future earnings. Depending on how low the P/E ratio is, the market may be pricing in a decline or stagnation in future earnings.
-
A bullish report on earnings guidance can bring this stock back into growth territory, and the market may be ready to pay higher multiple.
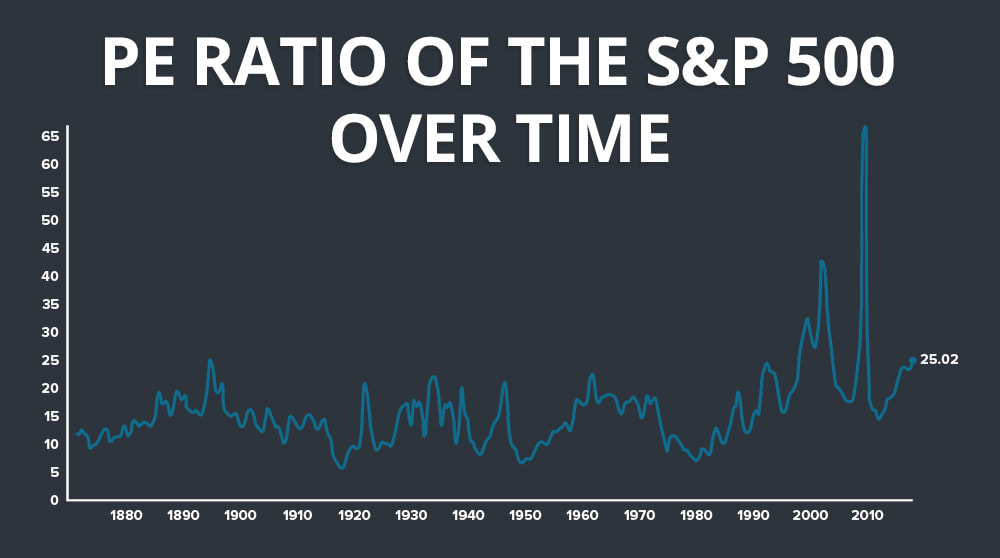
Take note of the cumulative P/E ratio of the stock market when evaluating the P/E of a stock. The market’s P/E can act as a reference point as to whether a P/E is “cheap” or “expensive”
Summary
Fundamental analysis is a widely encompassing field, including the most traditional of investment strategy to the most complicated quantitative models. Classifying fundamental analysis philosophy as either value-focused or growth-focused is an over-simplification but, one will find that the vast majority of investment strategies fall into these two camps in one way or another. The key difference is viewing a company as it is today, versus viewing a company as what it can be tomorrow.
A working knowledge of fundamental analysis is important, even for the shortest term of traders. It may seem ridiculous for an order flow scalper to spend any time on fundamental analysis but it can give one context as to how a stock may react to an earnings play or breaking news.
This article doesn’t begin to scratch the surface of fundamental analysis. The trader/investor who take this field of analysis seriously has an array of fields to research including corporate finance, business strategy, macroeconomics, investment banking, and various others.