Many traders make the mistake of buying oversold stocks or selling overbought stocks and suffer financial losses as a result.
This often happens when traders are unaware of the proper analytical tool to use. A stochastic oscillator is an indicator that can help traders identify overbought and oversold markets, allowing them to make more informed decisions when trading stocks.
By using stochastic indicators, traders can gain insight into potential entry points that may not be visible on other charts or technical analysis tools. With this information at their fingertips, they can make more accurate decisions about when to enter or exit trades and maximize their profits.
If you want to save yourself from the pitfalls of trading, this blog post will teach you everything you need to know about stochastic indicators.
What Is the Stochastic Indicator?
The stochastic indicator is an oscillator that traders use to measure momentum. This tool helps identify when a stock is overbought or oversold, which can give the trader an indication of whether it’s an excellent time to buy or sell a stock.
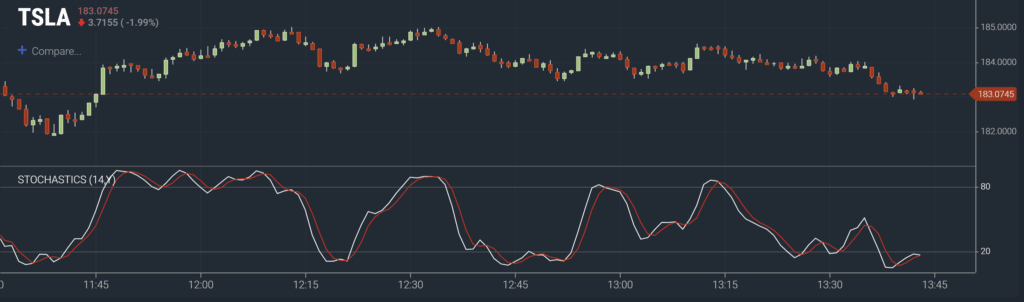
As an oscillator, the stochastic indicator doesn’t “predict” the potential prices of stock, but rather shows how the stock’s momentum is behaving based on its extreme values. Another popular oscillator many traders use is the RSI, or Relative Strength Index.
RSI relies on recent price changes to estimate the direction of the stock’s momentum. In contrast, stochastic uses the current closing price and compares it to a range of prices over a certain period (i.e., three days.)
In a stochastic oscillator, traders expect that the closing price is near high during an uptrend and near lows during a downtrend. When the closing price in a bullish market is near the low, it could indicate that the market is losing momentum, and a reversal is likely. Similarly, in a bearish market, when the closing price is near the high, it could mean that the prices could soon start rising.
Interpreting the Stochastic Indicator
Interpreting stochastic indicator results might confuse some, but it can become less intimidating with practice and patience. Here’s a quick guide to help you get started:
- Oscillators, like RSI and stochastic, use a range of 0 to 100.
- An overbought stock means that the security is trading above its normal range and could be a signal to sell. Overbought stocks are usually above 80 on the stochastic oscillator. When a stock is overbought, it could lead to a reversal as the stock prices normalize and the clamor around it dies.
- An oversold stock means it’s trading below the normal range and could signal to be extremely careful about buying. Oversold stocks are usually below 20 on the stochastic oscillator. When a stock is oversold, it could lead to an uptrend as buyers come in and drive up the price.
You might be tempted to buy in an oversold market, but it’s important to remember that it may not necessarily be the best choice. The market could still turn bearish in an oversold situation, so always take caution when entering trades.
Applications of Stochastic Stock Market Indicators
You can use stochastic indicators to improve your day trading strategy in many ways. Here are some ideas to help you get started:
The Bull/Bear Strategy
You can use the stochastic oscillator to detect a bullish and a bearish market and enter or exit the market accordingly. If the stochastic indicator lies between 50 and 80, the stock prices are expected to move safely upward and signify a bull market.
In contrast, if the stochastic indicator lies between 20 and 50 and continues to drop, it could indicate a bearish market. There may be selling pressure within traders, and it’s a good idea to exit the market before you suffer significant losses.
The Divergence Strategy
Another popular strategy used with the stochastic indicator is the divergence strategy. When the stochastic indicator diverges from the closing price, it’s a possible indicator that the market will enter a reversal.
For example, suppose the market is in a bearish or downward trend and the closing price sits below the 20 mark. In that case, it could be a sign of an upcoming reversal to the bullish market if the stochastic indicator prints a higher low (Around 20 to 50) than the previous one.
The Overbought/Oversold Strategy
This is the most basic application of the stochastic indicator. Many traders often use the stochastic oscillator to determine if a stock is overbought or oversold.
If the stock is trading above 80, it could be a sign that it’s overbought, and there is a possibility of a reversal shortly. On the other hand, if the stock is trading below 20, it could indicate that it’s oversold and could also lead to a reversal of the trend.
Many traders buy stocks in an oversold market and sell stocks in an overbought market. This strategy is often referred to as mean reversion trading, which could be used by traders who want to take advantage of short-term price fluctuations.
However, it’s critical to be aware of the potential risks associated with this strategy. It’s a good idea to make sure that you do your research and assess the risk before employing any strategy.
Make the Most Out of Your Trading Experience
Many lay people see trading as gambling or a way to waste your money. Often, this reaction is due to the lack of knowledge and guidance about the art of trading. Metrics like the stochastic indicator help traders anticipate and predict the market’s direction.
Unfortunately, mastering these strategies could take years of practice and experience. Leveraging trading tools like Scanz can help you elevate your trading game faster. Start trading smarter with Scanz today, and make the most out of your trading experience.