Volatility is an essential element for short-term stock trading. As volatility increases, so too does the number of potential opportunities to trade.
In this guide, we’ll explain what volatility is and why traders should care about it. Then, we’ll show you how to quickly find the most volatile stocks today using Scanz. You can also get a daily report of the top movers when you sign up for the free Market Movers newsletter.
What is Volatility?
Volatility is a measure of the spread in a stock’s price within a given period of time. Unlike percent change, which tracks how much a stock’s price has gone up or down since market open, volatility accounts for all the changes in a stock’s price throughout the day. Put another way, volatility measures the variability in a stock’s price around its average price.
The best way to understand volatility is with an example. Say a stock opens at $120 and, as the market session progresses, it never moves lower than $119 or higher than $121. That stock has low volatility because the price is relatively static.
On the other hand, say the same stock drops to $105, then shoots up to $140, and finally drops back to $120. In that case, the stock would be considered highly volatile because the price fluctuates significantly in a short period of time.
Why Do Traders Care about Volatility?
Traders care about volatility because in creates opportunities for trading. The more volatile a stock is – that is, the more widely and frequently its price fluctuates throughout the day – the more opportunities there are to buy and sell for a profit.
While low volatility stocks can be traded, smaller price changes require a bigger investment to achieve the same profit. High volatility stocks offer bigger profit potential. Of course, that also means that high volatility stocks carry more trading risk.
The Importance of Liquidity
One important thing to remember when looking for high volatility stocks is that volatility on its own isn’t sufficient for trading. Traders need stocks with both high volatility and high liquidity.
Low liquidity can cause high volatility simply because it’s difficult to buy and sell shares. Typically, it’s best to avoid low liquidity stocks because it can be hard to enter and exit trades, which exposes you to more risk. It’s much simpler to enter and exit positions when trading high volatility stocks that also have high liquidity.
How to Find the Most Volatile Stocks Today
Scanz offers a few different ways to find the most volatile stocks on the market right now.
Scanz Market Movers
The easiest way to find volatile stocks with Scanz is by using Scanz Market Movers. This list is put together by our team every trading day in mid-morning. You can quickly see the top 10 gainers and losers on the NASDAQ and OTC markets, as well as the top 10 stocks with the greatest amount of trading activity.
It’s a simple way to get an overview of the most volatile stocks on the market without even having to run your own scan.
Easy Scanner
Scanz Market Movers is based on the Easy Scanner. So, you can easily set up your own volatility scan if you want more data or a custom set of filters.
In the Easy Scanner, start by adding a filter for Current Trades. We recommend setting a minimum threshold of 1,000 trades to weed out low liquidity stocks from your scan results. Then add a column for Daily Volatility and sort your results by that to see the most volatile stocks.
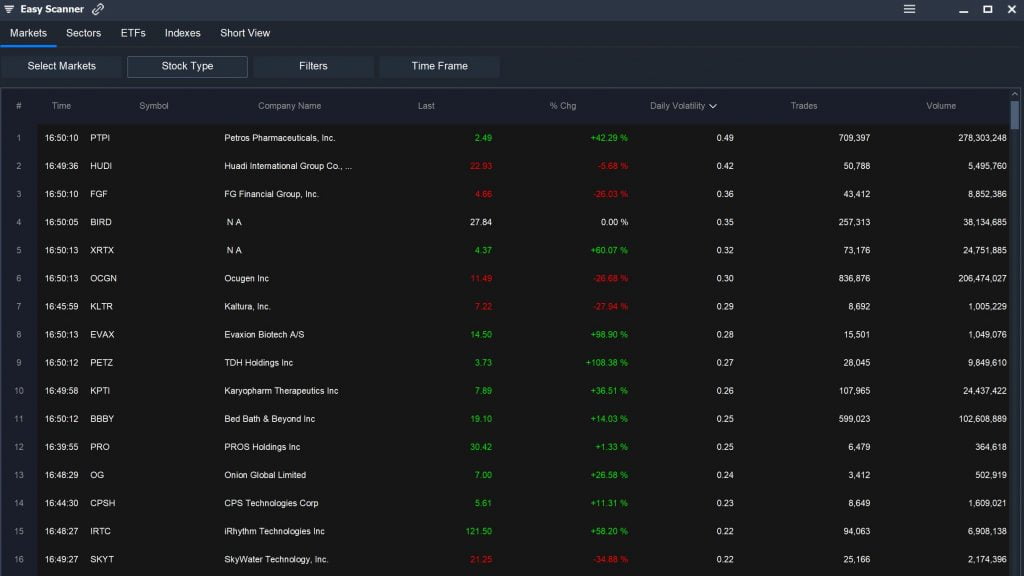
You can also use the Easy Scanner to sort stocks by percent change or trading volume, which often track with volatility.
Pro Scanner
The Pro Scanner gives you more options to create a custom volatility scan. One of the best ways to do this is by combining a relative volume scanner with a price change scanner. For example:
5 DAY AVG VOLUME is greater than ANALYTIC 10 DAY AVG VOLUME
AND
PERCENT CHANGE is greater than or equal to VALUE 5
AND
DAY’S TRADES is greater than VALUE 1,000
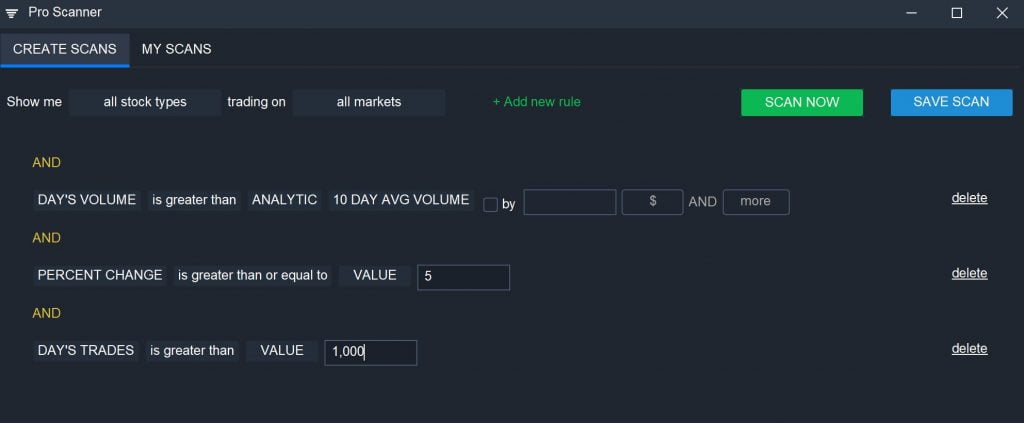
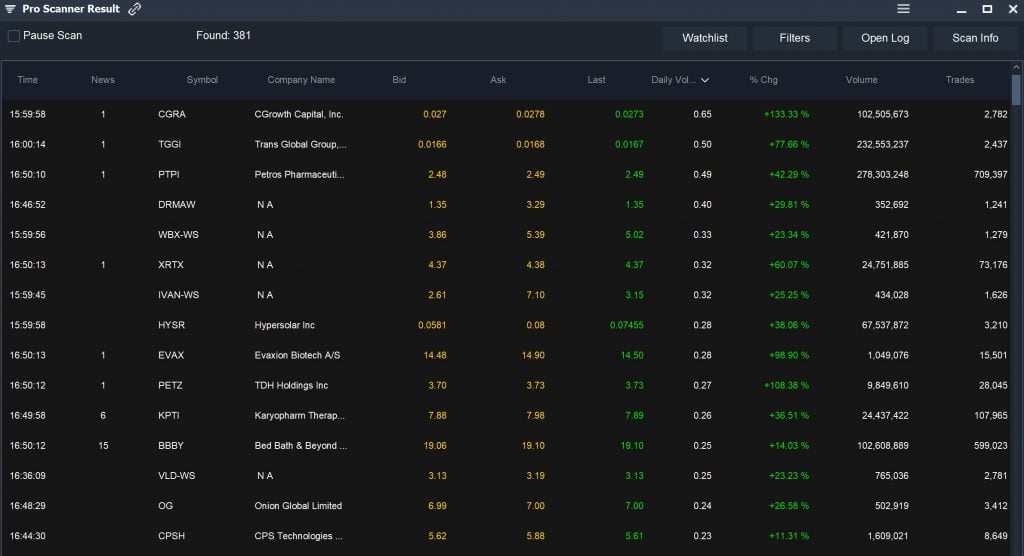
Note that we added a filter for trades to eliminate stocks with low liquidity.
You can also look specifically for stocks that are breaking out above a previous high on strong volume:
5 DAY AVG VOLUME is greater than ANALYTIC 10 DAY AVG VOLUME
AND
LAST is greater than ANALYTIC 20 DAY HIGH by 5% AND More
AND
DAY’S TRADES is greater than VALUE 1,000
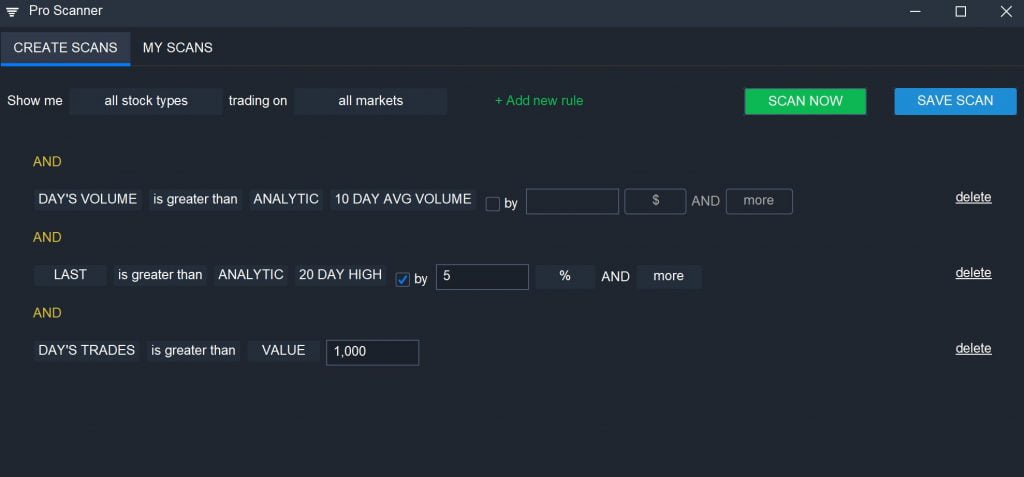
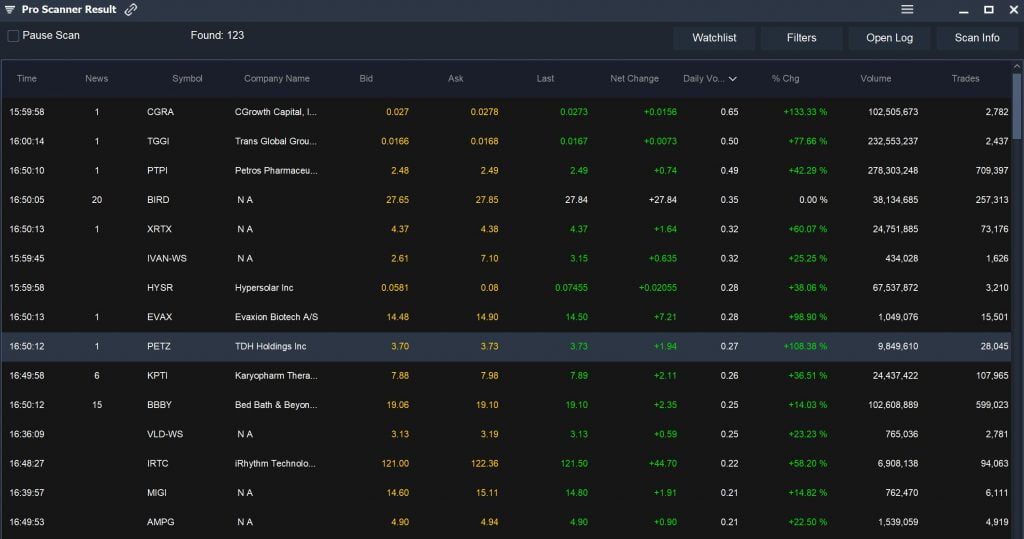
Breakouts are often associated with high volatility, since stocks are jumping several percent above a what was previously a resistance level.
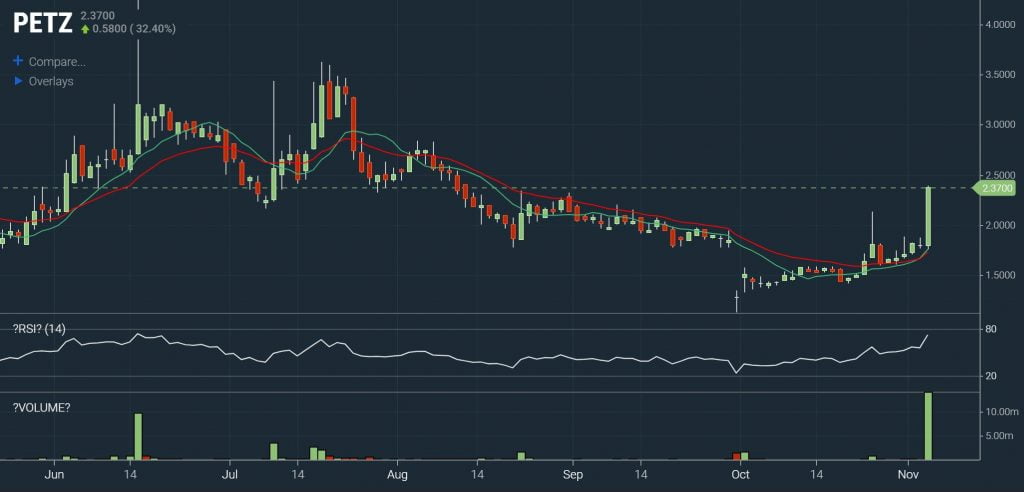
Another nice thing about the Pro Scanner is that you have a lot of control over your scan’s targets. For example, you can add fundamental parameters to specifically scan for small cap stocks with high volatility. Or, you can scan for stocks with specific technical qualities, like an RSI below 80, to avoid potentially overbought setups. In the latter case, just add the parameter:
RSI – Relative Strength Index (Daily, 14) is less than VALUE 80
Conclusion
Finding volatile stocks can help you quickly identify potential trading opportunities and lead you to the most significant price action during a trading session. With Scanz, it’s easy to find volatile stocks using either the Easy Scanner or the Pro Scanner. Alternative, you can check Scanz Market Movers to get an overview of market activity and see the day’s most volatile stocks.

