When a stock “breaks out” from a support or resistance level, it’s often a sign that a significant move is coming. So, traders typically watch breakouts closely. In fact, many trading strategies revolve around finding and trading breakout stocks.
In this tutorial, we’ll show you how to find breakout stocks using the Pro Scanner in Scanz.
What is a Breakout Stock?
A breakout stock is one that breaks through a support or resistance level. In many cases, when a stock breaks above a resistance level, it is the beginning of a sustained move higher. Conversely, when a stock breaks below a support level, it is often the beginning of significant bearish price action.
Traders are interested in breakout stocks because they offer an opportunity to open a position at the beginning of a new price trend. Often, momentum is strongest right after the start of a new trend, so there is potentially a lot of upside for traders who can correctly identify and trade breakouts.
Of course, not every move above a resistance level or below a support level will lead to a breakout. So, it’s important to follow up any scans for breakout stock with careful analysis of whether the movement is likely to be sustained.
How to Find Breakout Stocks
Before you can scan for breakout stocks, there are a few steps you need to take to define what a breakout stock is in the context of your trading strategy.
Step 1: Define Your Breakout Timeframe
Breakouts can happen on a variety of timescales. For example, a stock could break above its 4-hour high, its 50-day high, or its 52-week high. It could also break out above a 10-day moving average or a 200-day moving average.
This is important because how long the price movement following a breakout takes to complete is usually related to the timeframe of the support or resistance level. The price movement following from a breakout above a 50-day high might complete in a few days, whereas the price movement after a stock breaks through its 52-week high could take weeks to complete.
So, if you’re primarily interested in day trading or short-term swing trading, then shorter-term breakout timeframes – like a 10-day moving average or 20-day high - will make the most sense for your strategy. If you’re interested in holding breakout stocks for several weeks or longer, then looking for breakouts from a 200-day moving average or 52-week high make the most sense for you.
Step 2: Define Your Breakout Threshold
The second step to defining breakout stocks is to decide on a breakout threshold. That is, how much must a stock move above or below its support or resistance level in order for you to consider it a breakout?
Deciding on a breakout threshold comes down to balancing the risk that a move across a support or resistance level isn’t really a breakout with the risk that you could miss out on potential profit. For risk-tolerant traders, setting a breakout threshold of 5% may work, but you will need to carefully analyze the stocks that turn up in your scan. For more risk-averse traders, a breakout threshold of 10% is more cautious, but also means that you may be late to take a position in a new trend.
Step 3: Scan
Scanning for breakout stocks essentially comes down to putting your breakout timeframe and your breakout threshold together. You may also want to add additional scan rules based on relative trading volume. That’s because most sustained breakouts happen on higher than average trading volume.
Let’s take a closer look at how you can create a breakout scan using the Scanz Pro Scanner.
Pro Scanner Settings
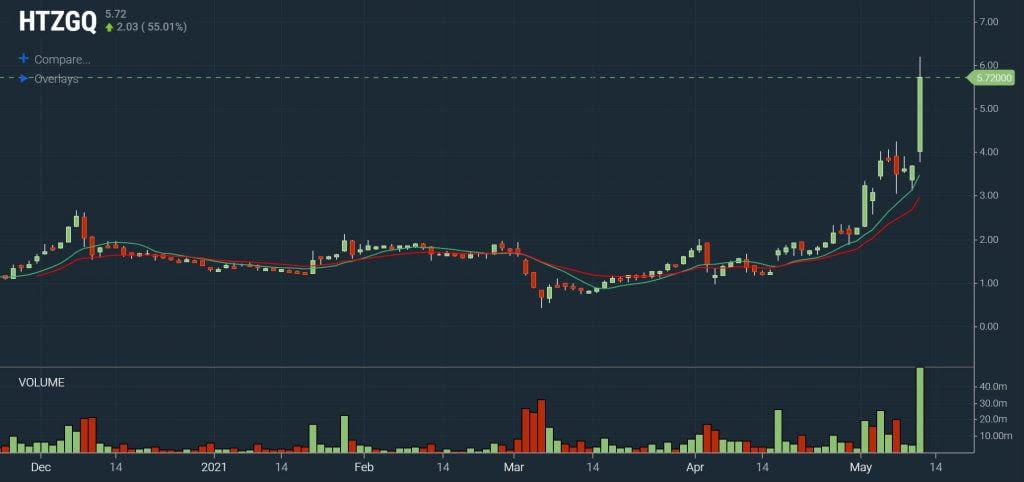
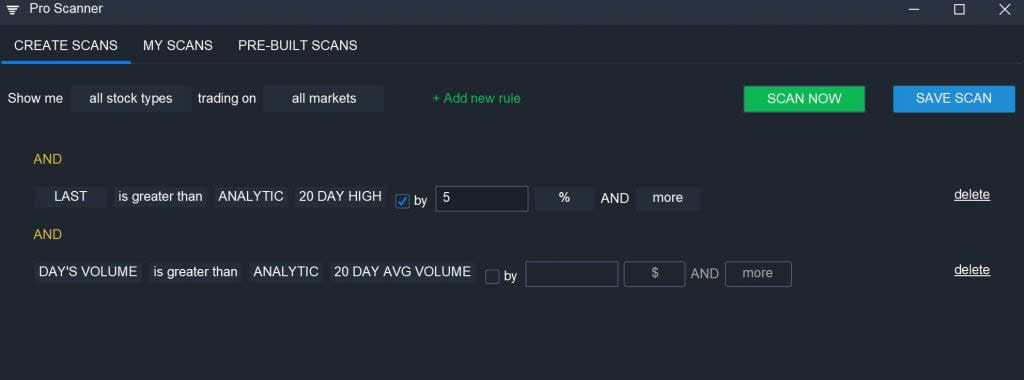
Let’s say you want to look for breakouts above a 20-day high. In that case, you can use a rule like:
LAST is greater than ANALYTIC 20 DAY HIGH by 5% AND More
It’s a good idea to pair this with a volume filter to ensure that your results only include potential breakouts that are trading on strong volume:
DAY’S VOLUME is greater than ANALYTIC 20 DAY AVG VOLUME
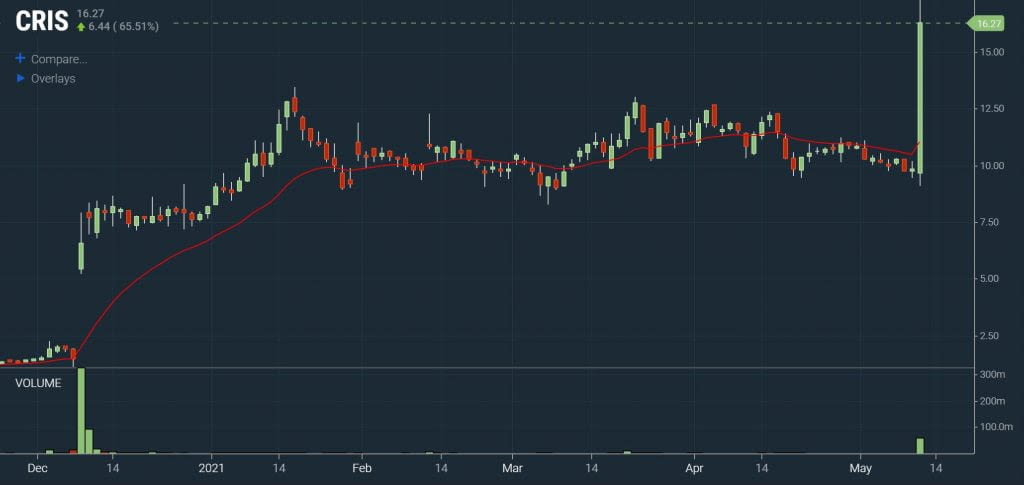
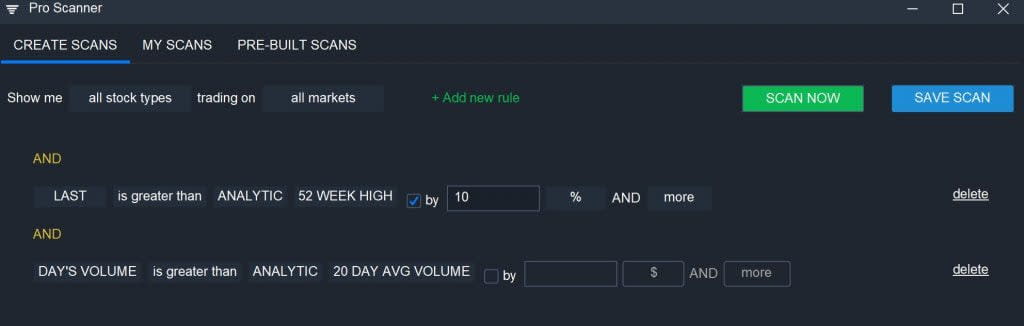
If you want to look for a breakout with a longer timeframe, you can compare the current price against the 52-week high. In this case, since the timeframe is longer, we’ll use a more conservative 10% breakout threshold:
LAST is greater than ANALYTIC 52 WEEK HIGH by 10% AND More
You can further narrow your scan by looking for stocks that are experiencing high volatility during the current market day. This ensures that your scan results include breakouts that are in progress, as opposed to ones that took place in the last several days.
PERCENT CHANGE is greater than VALUE 5
Conclusion
Breakout stocks are stocks that break above a support level or below a resistance level and then make a significant price movement up or down. By using the Pro Scanner to spot breakouts, you can find opportunities to get in early on these large price movements. Breakouts happen over a wide range of timescales, so breakout stocks can be a target for day, swing, and longer-term traders alike.
Related Reading:
- 3 Ways to Scan for Short Selling Opportunities
- Best Scans for Momentum Traders
- How to Find Stocks to Day Trade
- 8 Tips for Building Better Stock Scanners
Ready to start scanning? Try for free and choose the plan that fits your workflow.