Traders are always on the lookout for stocks that are experiencing high volatility. One of the best ways to spot these stocks is by looking at trading volume, or the number of shares that are changing hands in a given time period.
Even better, traders can compare volume at any time against a baseline to look for unusual trading activity that could signal opportunity. Relative volume, as this is known, is widely used by traders to find stocks to trade, confirm trading setups, and more.
In this guide, we’ll explain the concepts behind relative volume and show you how to create a relative volume scanner with Scanz.
What is ‘Relative’ Volume?
Volume is simply the number of shares of a stock being traded in a given timeframe. This can provide some information about a stock’s liquidity, but absolute volume isn’t all that helpful on its own. The absolute trading volume around a popular stock like Apple will almost always be higher than the absolute volume around a penny stock.
Instead, most traders care about relative volume. Relative volume is a ratio that compares trading volume in a current timeframe against average trading volume over a past timeframe. That way, traders can compare current trading activity around Apple against past trading activity around Apple, rather than against an unrelated stock.
For example, relative volume might compare the number of shares of Apple being traded today to how many shares of Apple were traded on each of the past 10 days. If the resulting ratio is greater than one, it signals that more shares are being traded today than is normal for Apple stock.
Importantly, relative volume is flexible in what types of timeframes it can be applied to. You can compare a whole day’s trading volume to past days or, say, the volume in a 15-minute trading interval against earlier 15-minute intervals that day.
The Importance of Analyzing Volume
Relative volume is a key metric for stock traders because it provides information about what stocks are receiving attention from the market. Stocks that have high relative volume also typically have high volatility, which presents opportunities for day trading. Stocks that have low relative volume are probably not going to be ‘in play’ for most trading strategies.
In fact, in many trading strategies, relative volume plays a critical role. High relative volume around a breakout, for example, is typically a sign that the price movement is supported by the market. The same breakout with low relative trading volume might be more suspect and traders would need to be wary of a reversal.
Relative volume can also be useful in analyzing momentum stocks. If a stock is marching steadily upward with increasing volume, that’s a good sign that the momentum will continue. On the other hand, declining relative volume even as the price continues to increase can be a sign of slowing momentum and an impending reversal.
How to Build a Relative Volume Scanner
Building a relative volume scanner in Scanz is a fast and easy way to identify trading opportunities. As we noted, stocks with high relative volume are often experiencing high price volatility and may be in the midst of a trading setup that is strongly supported by market activity.
There are two ways to build a relative volume scanner in Scanz: using the Breakouts Scanner and using the Pro Scanner. We’ll show you how to use both.
Using the Breakouts Scanner
The Breakouts Scanner is designed to quickly surface stocks that are trading with higher than average volume. In the Volume Breakouts menu, simply choose a timeframe to compare the day’s volume against. The results will show all stocks that have a higher trading volume in the current session compared to the average daily volume over a selected number of previous days.
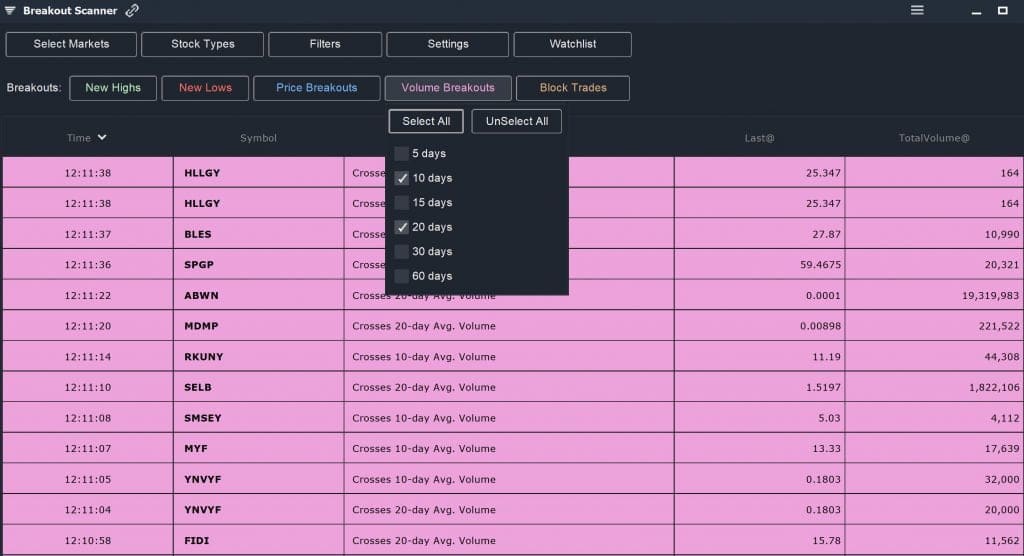
The Breakouts Scanner includes stocks that are trading with low absolute volume by default. However, you can set a minimum volume threshold using the Filters menu. For most mid- and large-cap stocks, an absolute volume threshold of 500,000 shares is typically a good cutoff.
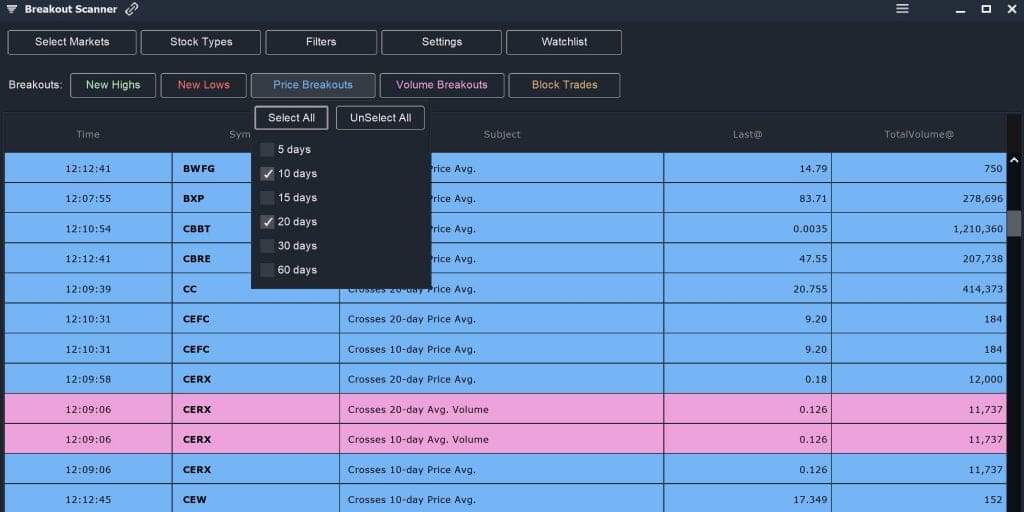
Another way to use the Breakouts Scanner to your advantage is to also search for price breakouts. That way, you can quickly see what stocks are setting new highs or lows on strong trading volume – a sign of support from the market.
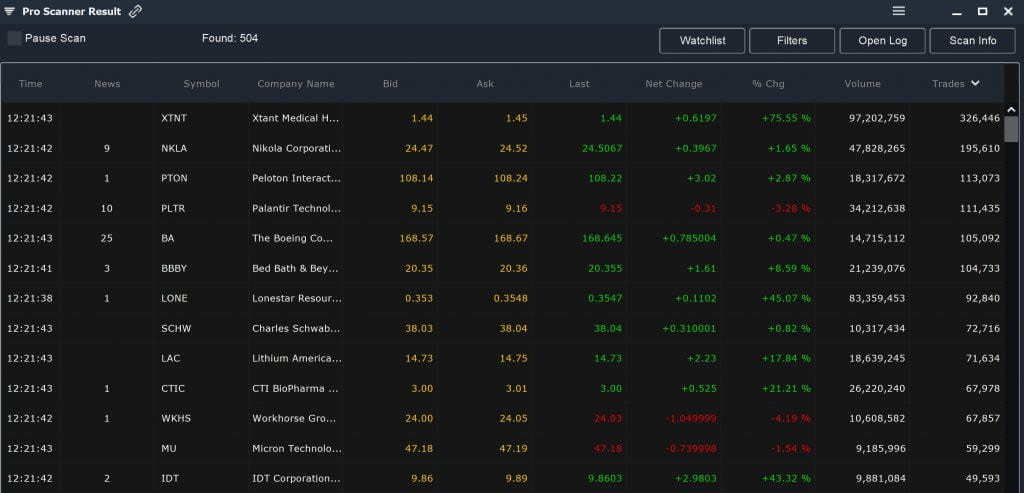
Using the Pro Scanner
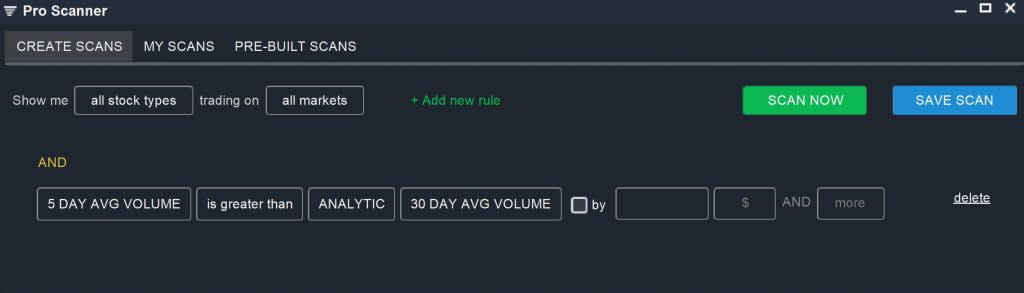
The Pro Scanner gives you more granular control over the timeframes you are comparing when considering relative volume. For example, with the Pro Scanner, you can look for stocks with an average trading volume over the past five days that is greater than the average trading volume over the past 30 days:
5 DAY AVG VOLUME is greater than ANALYTIC 30 DAY AVG VOLUME
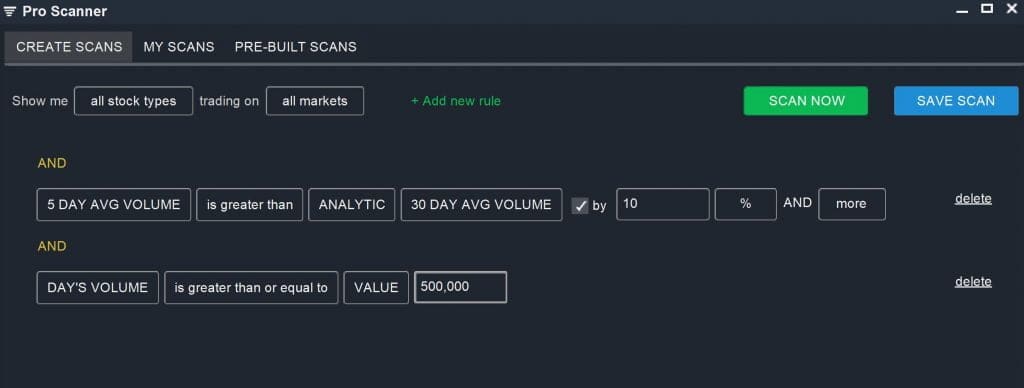
You can also specify that the five-day average volume is greater by a specific amount, like 10%. It’s also a good idea to specify a minimum absolute volume cutoff to avoid stocks that trade with low liquidity:
5 DAY AVG VOLUME is greater than ANALYTIC 30 DAY AVG VOLUME by 10% AND More
AND
DAY’S VOLUME is greater than or equal to VALUE 500,000
Importantly, using the Pro Scanner also enables you to combine a relative volume scan with other types of scans. So, if you already have a momentum stock screener, for example, you can add relative volume into that scan to only look for momentum stocks that are trading on strong volume.
Conclusion
Analyzing relative volume is a good way to find potential trading opportunities and confirm some types of trading setups like price breakouts. Using Scanz, it’s easy to create a relative volume scanner with either the Breakouts Scanner or Pro Scanner modules.
Related Reading:
Ready to start scanning? Try for free and choose the plan that fits your workflow.