When a stock makes a major move up or down following a period of consolidation, it’s called a breakout. Breakouts are prime opportunities for traders because a stock has the potential not only to make a big move in a short period, but also to continue that directional move by gaining momentum. So, if you can get in on the ground floor of a breakout, there’s a lot of potential for profit.
The trick to trading breakouts is that finding a potential breakout before it happens requires looking at a number of different technical signals. Not every setup will develop into a major directional movement, so it’s essential to make sure you’re using all the tools at your disposal before opening a position. To help, we’ll take a look at four different ways you can scan for breakout stocks using Scanz.
Breakout Scanning Essentials
Start by using these breakout scanners to find real-time breakouts daily.
Breakouts Module
The first place to go looking for breakouts is the aptly named Scanz Breakouts Module. This is a great tool for finding potential breakouts in progress, allowing you to open a position early on in a stock’s movement.
There are a couple different ways you can use the Breakouts Module to your advantage. Perhaps the best option is to look for stocks that are both crossing above or below a simple moving average while also trading on higher than average volume. Simply scan on these two parameters, then sort the results by ticker symbol to spot symbols that are breaking out on both price and volume.
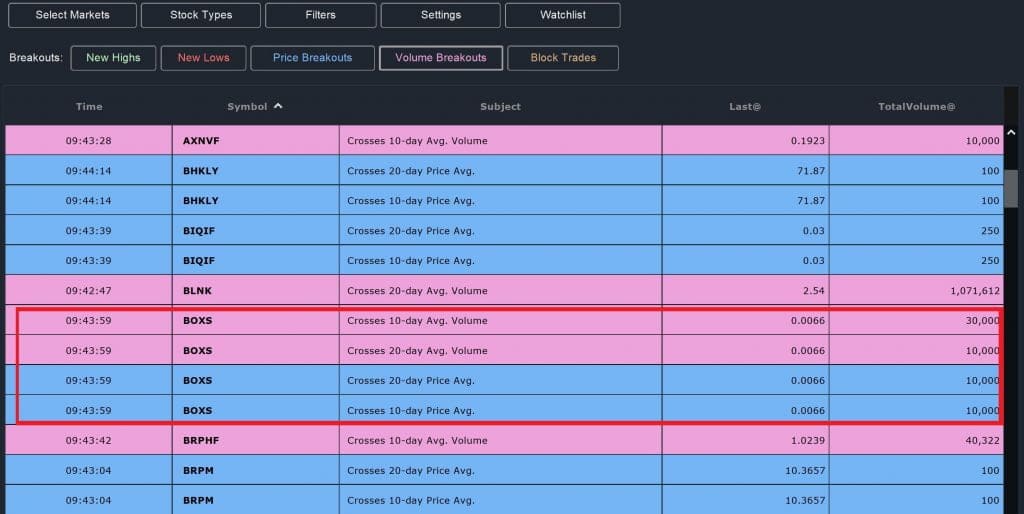
You can use the same technique to spot stocks that are also setting new highs or lows. While this will generate signals from stocks that are simply gaining on momentum, you’ll also find stocks that are stepping higher or lower after a period of consolidation – breakouts that are likely to be genuine if they’re combined with above-average trading volume.
Breakouts on Volume
If you are scanning for stocks that are in play right now, you don’t need to get too fancy with the scanning parameters. Focus on volume and price.
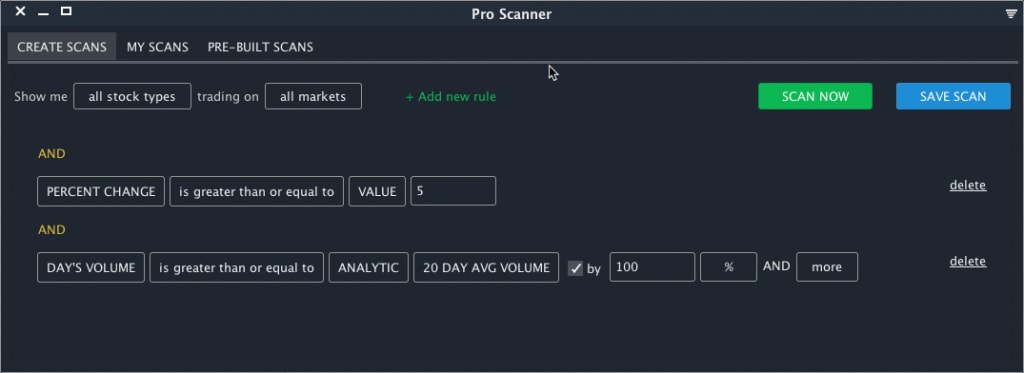
Here is a basic scan that will help you find stocks breaking out on volume:
PERCENT CHANGE is greater than or equal to 5
AND
DAY’S VOLUME is greater than or equal to ANALYTIC 20 DAY AVG VOLUME by 100% and more
Here’s what the scan settings look like:
Here are the results sorted by the number of trades (to ensure we find the most liquid setups):
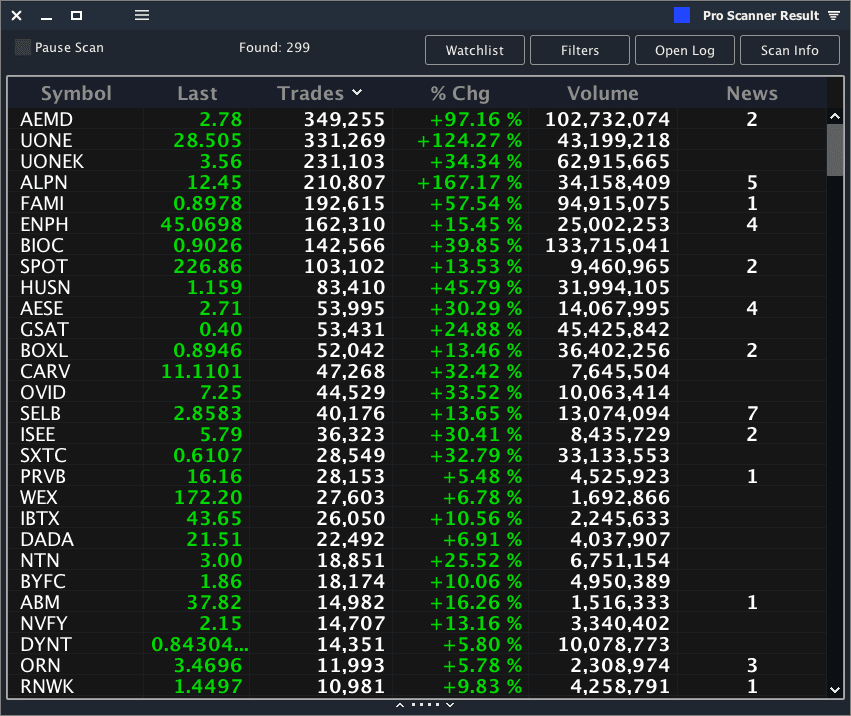
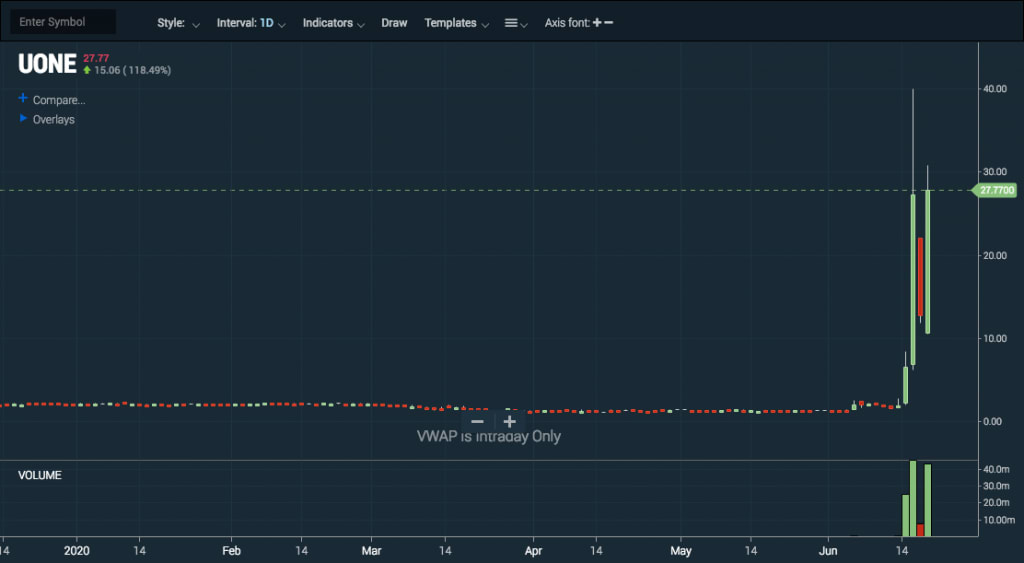
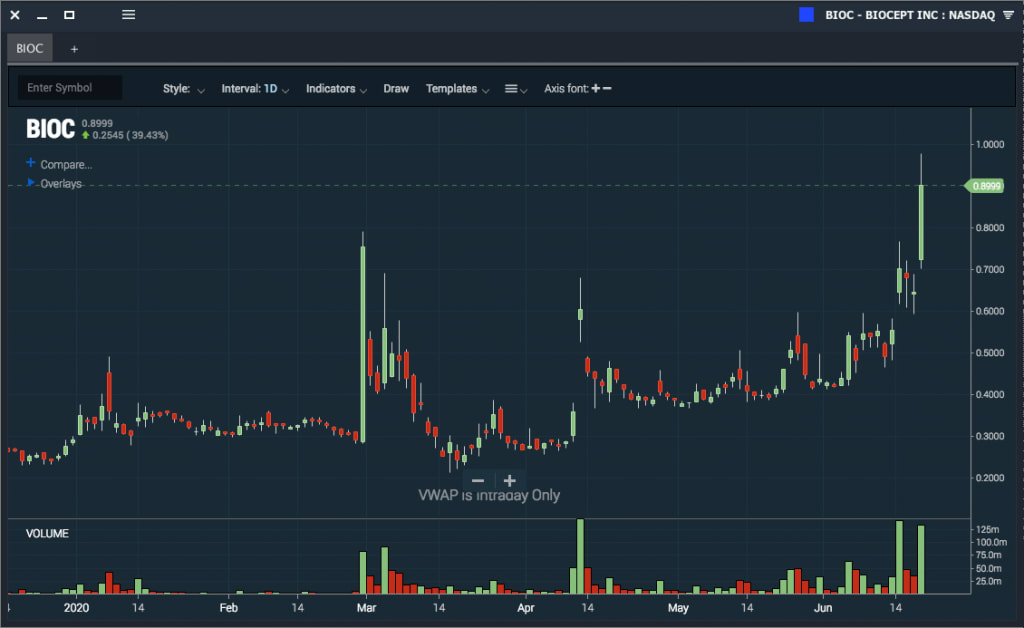
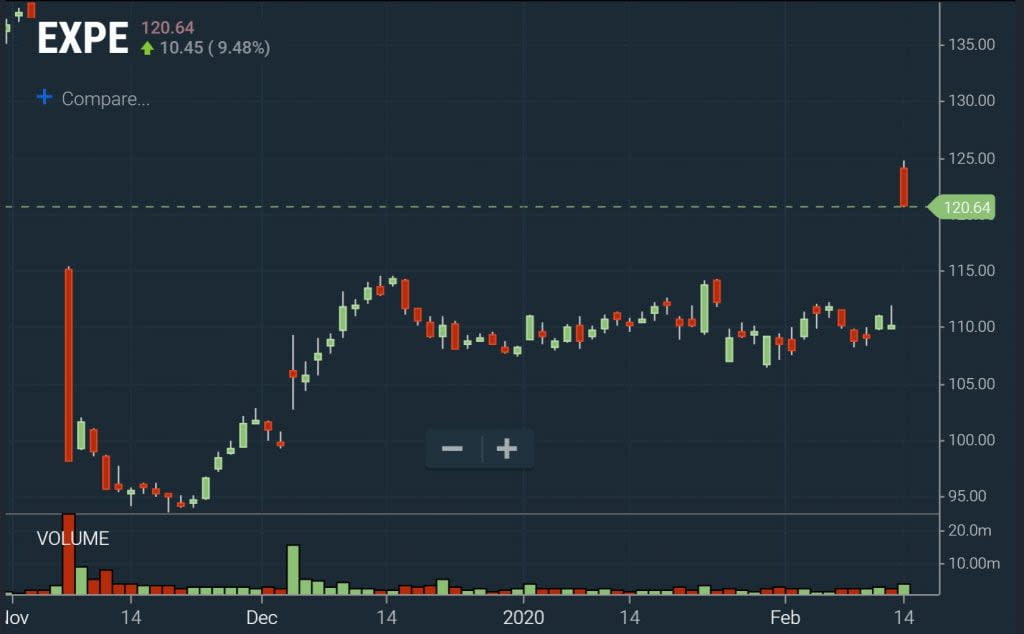
As we click through the results, we can see some major breakouts on the day:
Scanning for Breaks above a Base
When scanning for a break above a base, we’re primarily looking for longer-term consolidation than what you’d find simply by scanning for short-term range-bound trading. Ideally, stocks will form a price floor by making consecutive lows around the same price level over a period of weeks to months.
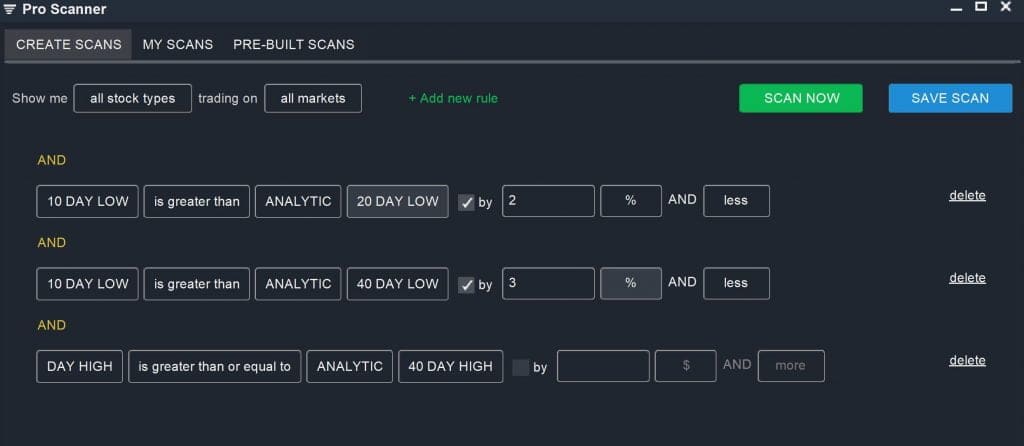
At the same time, you can spot a breakout above that base when the stock sets a new high. However, a new high alone doesn’t confirm that a breakout is happening or that it’s likely to succeed. So, it’s important to also limit your search to stocks that are trading on strong volume.
10 DAY LOW is greater than ANALYTIC 20 DAY LOW by 2% AND Less
AND
10 DAY LOW is greater than ANALYTIC 40 DAY LOW by 3% AND Less
AND
DAY HIGH is greater than or equal to ANALYTIC 40 DAY HIGH
Keep in mind that you can expand the timeframes of the scan parameters to look for stocks experiencing months-long periods of consolidation. For example, it’s possible to compare the 10-day low to the 52-week low.
Searching for Momentum Stocks Stepping Higher
Scanning for momentum stocks that are making a step higher or lower after a period of consolidation puts together a lot of the elements of the other breakout scans. The main difference is that this scan looks only at stocks that very recently were making a steady directional movement on momentum. These stocks are excellent candidates for a breakout, since short consolidation periods before the broader trend continues are very common.
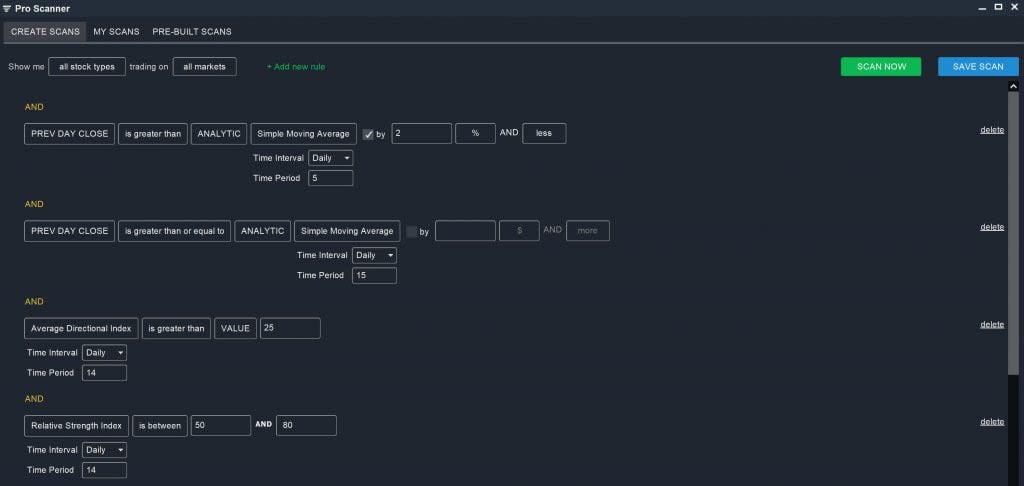
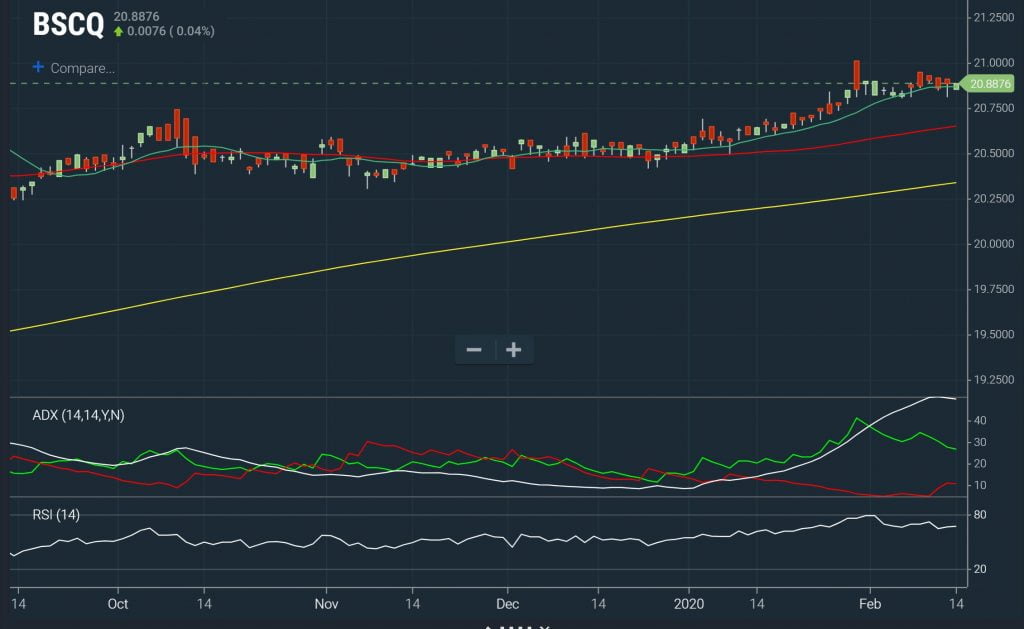
This scan combines a search for stocks trading in a narrow range over a five-day period with a scan for stocks that have all the technical indicators of upward momentum:
PREV DAY CLOSE is greater than ANALYTIC Simple Moving Average (Daily, 5) by 2% and less
AND
PREV DAY CLOSE is greater than ANALYTIC Simple Moving Average (Daily, 15)
AND
Average Directional (Daily,14) is greater than 25
AND
Relative Strength Index (Daily, 14) is between 50 and 80
Remember, this scan only looks for potential breakouts. It’s up to you to keep an eye on momentum stocks that are consolidating for a move higher. A true breakout should close above the previous high set by the trend and should be accompanied by above-average trading volume. If the consolidation goes on for too long, the chances of a step higher diminish. But, in that case, the stock would also lose its momentum and would no longer be captured by this scan.
Conclusion
Stock breakouts offer a lucrative opportunity for traders who can identify consolidation patterns. With these four scans, you can use Scanz to quickly and easily find different breakout setups. Keep in mind that breakouts can be finicky, so it’s important to use multiple technical signals to confirm a major directional move before opening a position.
Related Reading:
- How to Find Breakout Stocks
- How to Find Momentum Stocks
- Relative Volume Scanner: Confirm Your Breakouts
Ready to start scanning? Try for free and choose the plan that fits your workflow.