The relative strength index (RSI) is an extremely popular technical indicator that measures a stock’s momentum. Importantly, it can signal when stocks are overbought or oversold, which provides information about whether it is prudent to open or close a position.
In this article, we’ll cover everything you need to know about RSI, including how it works and how you can trade with it. We’ll also help you design your own RSI stock screener using the Pro Scanner in Scanz.
What is the Relative Strength Index?
The RSI is an oscillating momentum indicator that compares a stock’s average gain against its average loss over a given time period. Essentially, it tracks large movements in a stock’s price relative to recent movements. If a stock sees gains that are unusually large for several days in a row, the RSI will go up. If it sees unusually large selloffs, the RSI will go down.
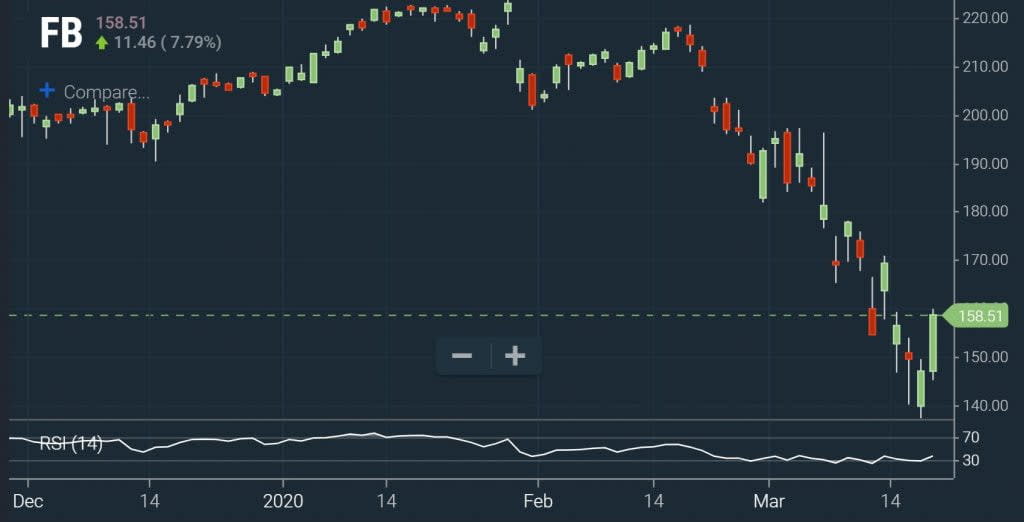
Most traders use the RSI to track price trends and to see whether a stock is overbought or oversold. When the RSI is high – usually interpreted as the index crossing above 70 – it can signal that the stock is overbought. When the RSI is low – below 30 – the stock may be undersold.
Of course, these aren’t hard-and-fast rules. The RSI can spend a significant amount of time above 70 during a prolonged bullish trend, or below 30 during a bearish trend. The RSI shouldn’t be interpreted on its own as a signal that the stock is ripe for a big movement, but changes in the RSI can signal a change in investor sentiment relative to recent days.
How the RSI Works
The RSI as an indicator is largely dependent on the speed and magnitude of price changes. Let’s say you have an RSI that’s looking back over the past 14 days of trading, nine of which were bullish and five of which were bearish. The RSI is then calculated by taking the average gain of the bullish days and dividing it by the average loss of the bearish days and then normalizing onto a 0 to 100 scale.
The greater the magnitude of the bullish days, the higher the RSI will be; the greater the magnitude of the bearish days, the lower the RSI will be. In addition, changing the timeframe of the RSI can change the magnitude of the index by bringing in more low-volatility or high-volatility trading days from more than 14 days ago.
How to Create an RSI Stock Screener
In order to help you create an RSI stock screener, let’s take a closer look at the parameters you can change and how you can use RSI to identify specific trading opportunities.
Time Interval
The time interval is the main parameter that can be changed to adjust the RSI. A longer time interval will generally be smoother and less responsive to recent price changes, since each day’s price movement is just one of many price movements contributing to the average. A shorter time interval will generally be more volatile and more responsive to recent price changes.
By far the most common time interval used to calculate RSI is a 14-period interval. On a daily chart, this is 14 days, while on an intra-day chart it is often 14 minutes. However, some traders prefer shorter intervals when calculating RSI in order to generate more frequent trading signals. A 10-day RSI on a daily chart is frequently used, while a 10-period RSI may be used on either one-minute or five-minute charts.
Identifying Momentum Stocks
One of the simplest uses of RSI is to find stocks that are trading with momentum. Bullish momentum should lead to a consistently rising RSI, since the number and magnitude of bullish intervals going into the calculation will exceed the number and magnitude of bearish intervals. Conversely, bearish momentum should lead to a consistently falling RSI.
Screening for Overbought Stocks
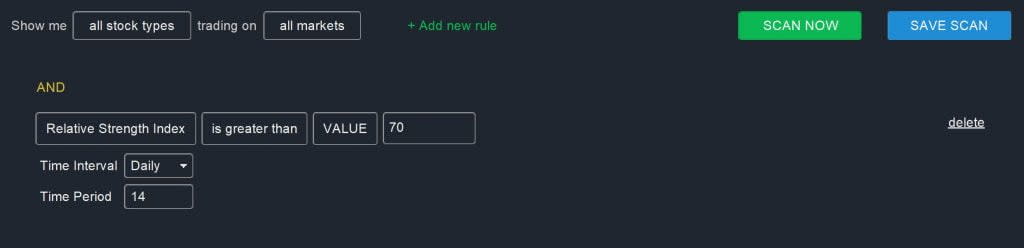
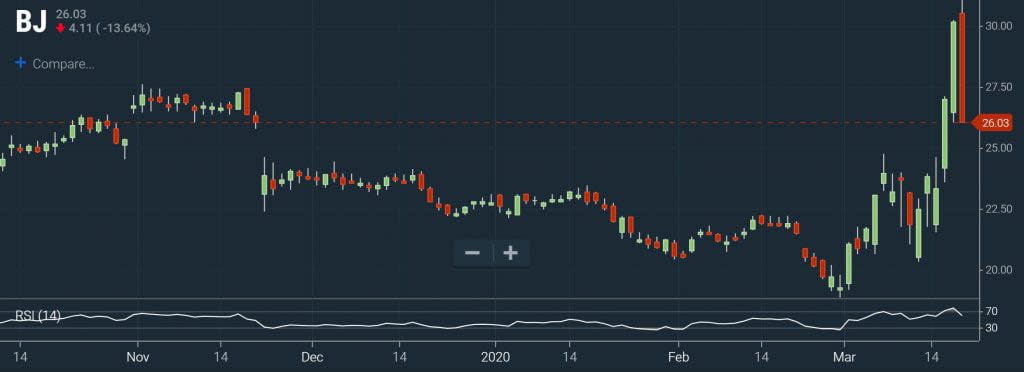
Another good use of an RSI screener is to identify overbought stocks. Generally, a stock is considered overbought if its RSI rises above 70. However, some traders may raise their threshold to 80 or even 90 as a way to limit their search to stocks in more extreme price conditions.
You can create an RSI screener in Scanz that searches for overbought stocks simply by searching for stocks with an RSI greater than 70:
Relative Strength Index (Daily, 14) is greater than VALUE 70
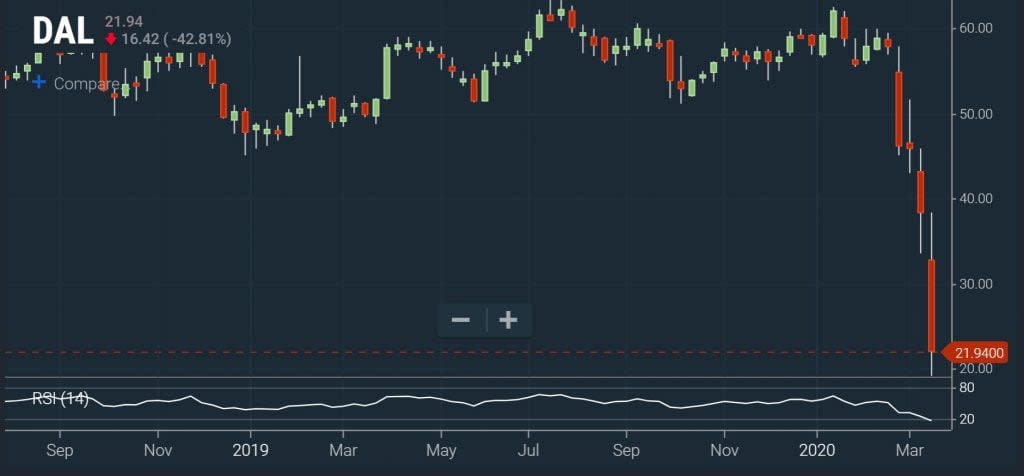
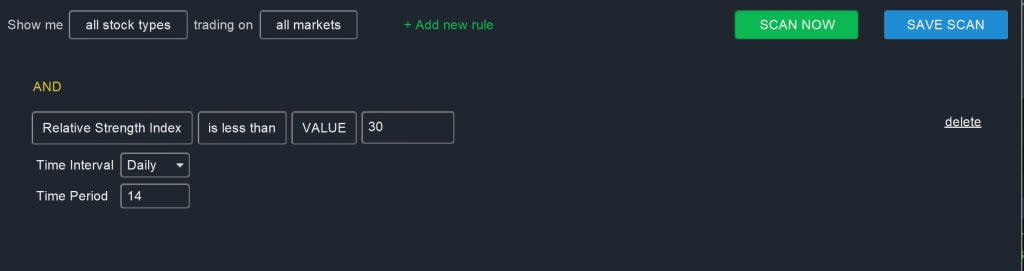
Screening for Oversold Stocks
Identifying oversold stocks with an RSI screener is simply the opposite of identifying overbought stocks. In this case, you’ll want to screen for stocks with an RSI less than 30 – or less than 20 or even less than 10:
Relative Strength Index (Daily, 14) is less than VALUE 30
Comparing RSIs
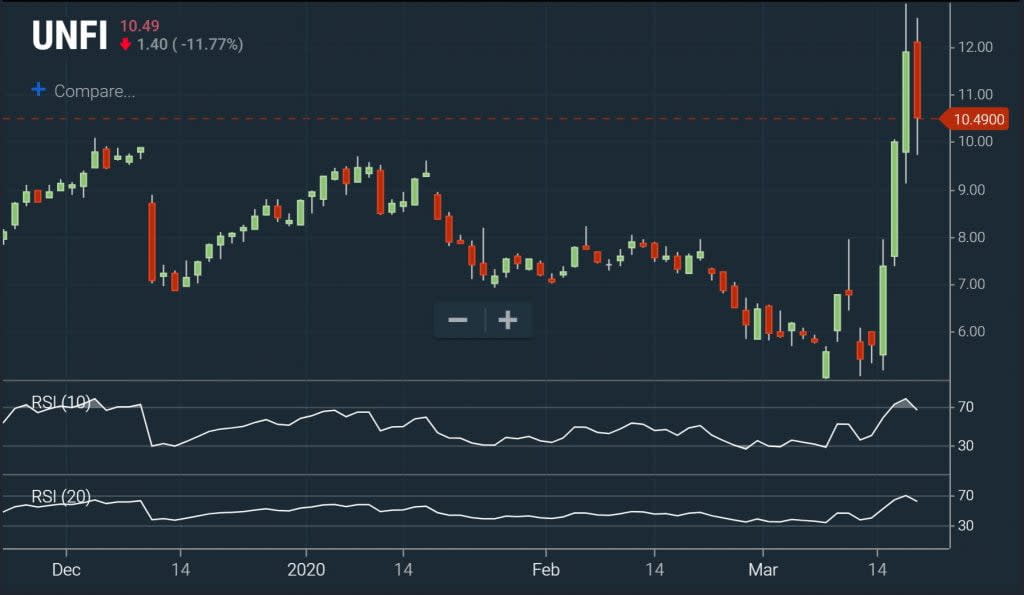
Since RSIs with different timeframes respond differently to recent price movements, you can compare two RSI values to see if a stock has short-term bullish or bearish momentum. If the short-term RSI is greater than the long-term RSI, it indicates that bullish momentum is increasing in recent intervals. If the short-term RSI is less than the long-term RSI, bearish momentum is picking up.
Of course, you’ll also want to look at the magnitude of the short-term RSI. An RSI around 50 might not indicate significant momentum in either direction. But, an RSI that’s approaching 70 is a strong sign of bullish price action.
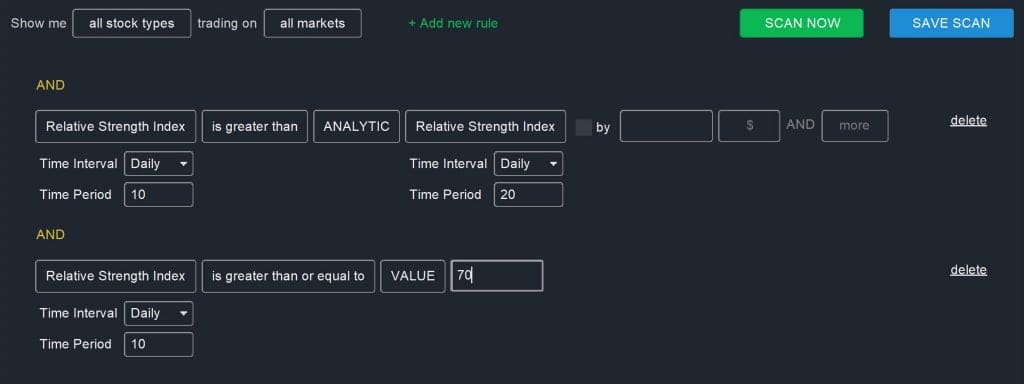
You can scan for stocks that are developing short-term bullish momentum by looking at 10-day and 20-day RSIs:
Relative Strength Index (Daily, 10) is greater than ANALYTIC Relative Strength Index (Daily, 20)
AND
Relative Strength Index (Daily, 10) is greater than or equal to 70
Other Filters to Add to an RSI Screener
RSI is most effective when it’s used with other stock screening parameters or as part of a larger trading strategy. Here are just a few of the additional filters that you can add to improve and customize your RSI screener:
- **Volume **– Allows you to limit your scan to stocks that are trading with high liquidity.
- **Percent Change **– Scan only for stocks that are making large price moves and represent potentially lucrative trading opportunities.
- **Price **– If stock price is a part of your trading strategy, it’s easy to add it as a filter in your RSI screener.
Conclusion
RSI is a commonly used indicator for measuring a stock’s momentum and identifying overbought and oversold conditions. By creating an RSI screener with Scanz, you can quickly find stocks that are trending and have room left to run as well as stocks that may be ripe for a reversal. The best part about RSI screeners is that they are easily customizable, so you can tailor your scan to fit your trading strategy or incorporate other technical indicators.
Related Reading:
- A Comprehensive Guide to RSI
- Overbought Stock Screeners: Trading Extreme Conditions
- MACD Stock Screeners: Adding a Second Momentum Filter
Ready to start scanning? Try for free and choose the plan that fits your workflow.