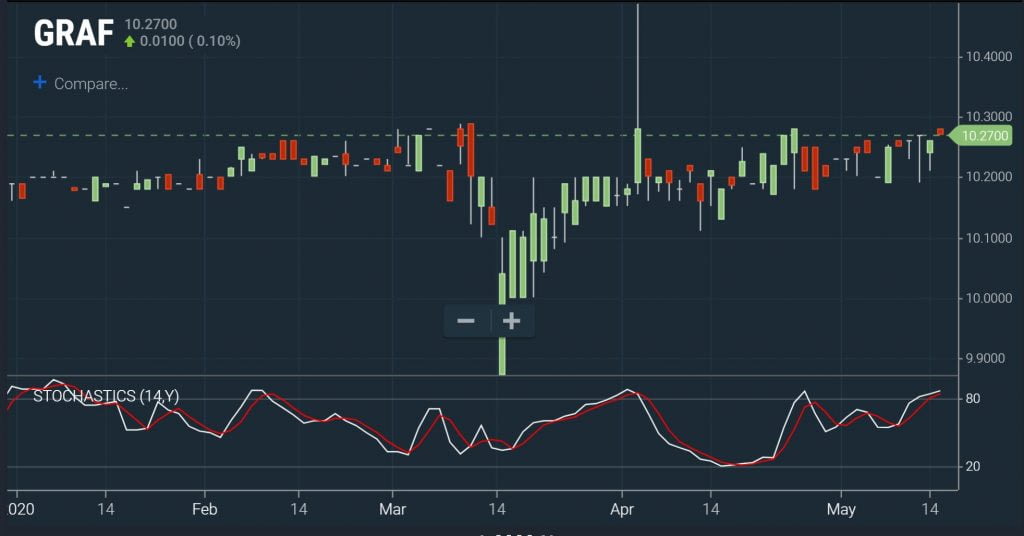
The stochastics indicator was first developed in the 1950s, but it’s as popular among traders now as ever before. This indicator compares the closing price of a stock to its price range over a set period to determine whether it is overbought or oversold. Whereas many traders use RSI for this purpose in trending markets, the stochastics indicator is accurate in choppy and range-bound markets.
In this guide, we’ll cover everything you need to know about the stochastics indicator. Plus, we’ll take a look at some stochastics scanners that you can build using Scanz to find trading opportunities.
What is the Stochastics Oscillator?
The stochastics oscillator moves between 0 and 100 and consists of two lines: %K and %D.
The %K line is the “fast” stochastics indicator. It is calculated as the difference between the current close and the 14-day low, divided by the difference between the 14-day high and 14-day low.
The %D line is the “slow” stochastics indicator, in that it is a three-day moving average of the %K line.
Note that while the stochastics oscillator is typically calculated on a daily chart, it is equally valid to use shorter or longer 14-period intervals or to change the number of bars included in the calculation.
How to Trade with Stochastics
There are a few different ways that traders can use the stochastics oscillator.
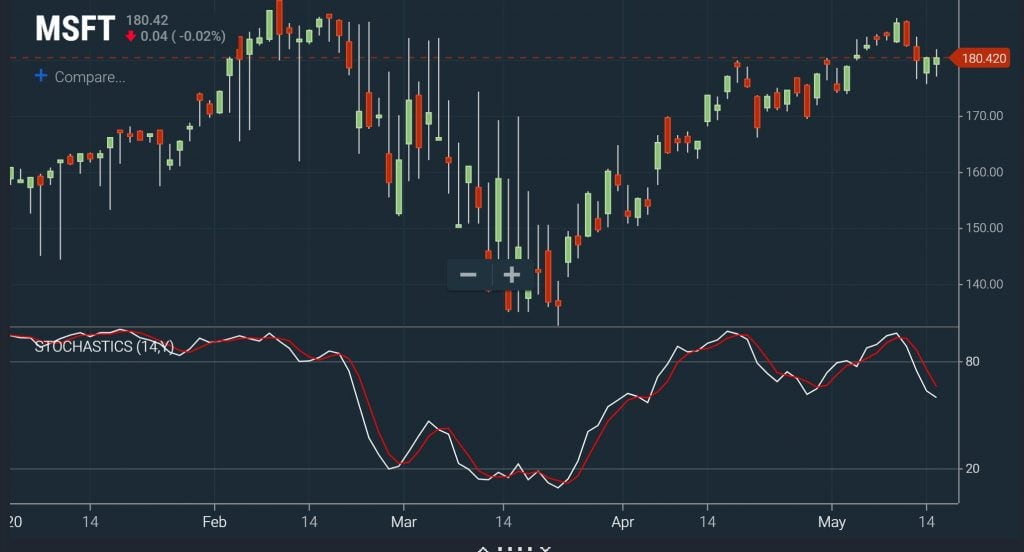
The first and most common application is to look for overbought and oversold stocks. When the %D line rises above 80, the stock is considered overbought. When it falls below 20, the stock is considered oversold. Traders can also make these determinations using the %K line, but beware that it is more prone to false signals than the %D line since it is more responsive to price changes.
Traders can also use crossovers of the %K and %D lines as buying and selling triggers. When the %K line crosses above the %D line, this is a sign that a stock has positive price momentum – which suggests a buy. When the %K line falls below the %D line, momentum is falling and this may be a trigger to sell. Note that the closer that %K and %D are to the extreme ends of the oscillator’s range (that is, above 80 or below 20), the more reliable the crossover signal.
Finally, traders can look for divergence between the stochastic oscillator and the price as a signal of an impending reversal. When the price is setting new highs but the stochastic oscillator – particularly the %D line – is steady or decreasing, this signals that upward price momentum has slowed and a bearish reversal may be coming. When the price is setting new lows but %D is rising, this predicts a bullish reversal.
Creating Stochastics Scanners
Since the stochastics oscillator is a highly accurate signal in range-bound markets, traders can easily incorporate it into scanners to find potential trading opportunities. We’ll use the Pro Scanner in Scanz, which offers %D and %K as parameters.
Note that Scanz includes both “Fast” and “Slow” stochastics parameters. The Fast stochastics are calculated as described above. The Slow %K is a three-day moving average of the Fast %K (and so is equivalent to the Fast %D), and the Slow %D is a three-day moving of the Slow %K. The Slow stochastics parameters are less sensitive, so they may produce fewer false signals but also may miss some signals.
For the examples below, we’ll use the Fast stochastics – but you may want to create scanners with both types to see what works best with your trading strategy.
Overbought and Oversold Levels
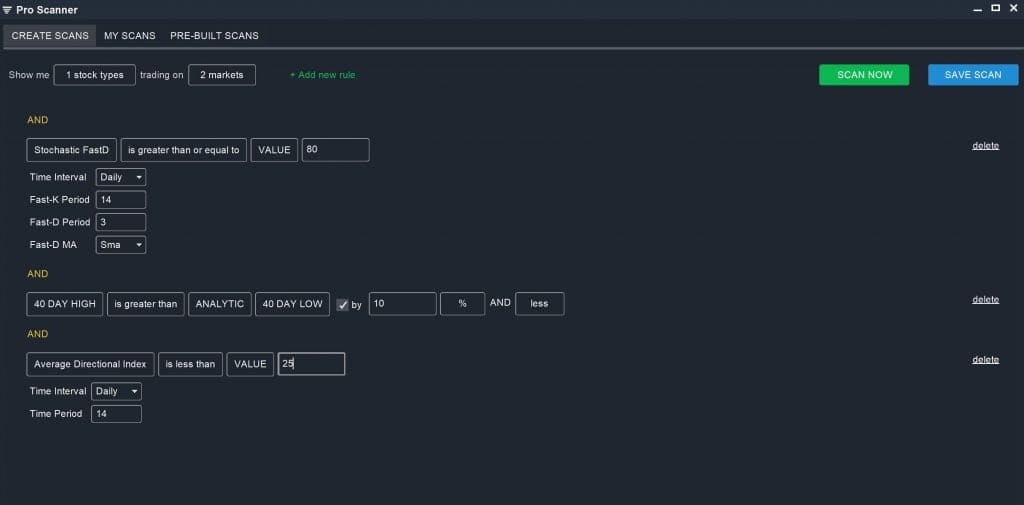
The easiest scanner to create with stochastics is one that looks for overbought and oversold stocks. Importantly, since the stochastics oscillator works best in range-bound trading conditions, the first step in any stochastics scan is to limit your search to range-bound stocks. So, our scanner will use the following parameters:
Stochastic FastD (Daily, 14) is greater than or equal to VALUE 80
AND
40 DAY HIGH is greater than ANALYTIC 40 DAY LOW by 10% AND Less
AND
Average Directional Index (Daily, 14) is less than VALUE 25
The latter two parameters limit our search to non-trending, sideways-moving stocks. You can modify this scan to search for stocks with a %D value less than 20 to search for oversold stocks.
%K and %D Crossovers
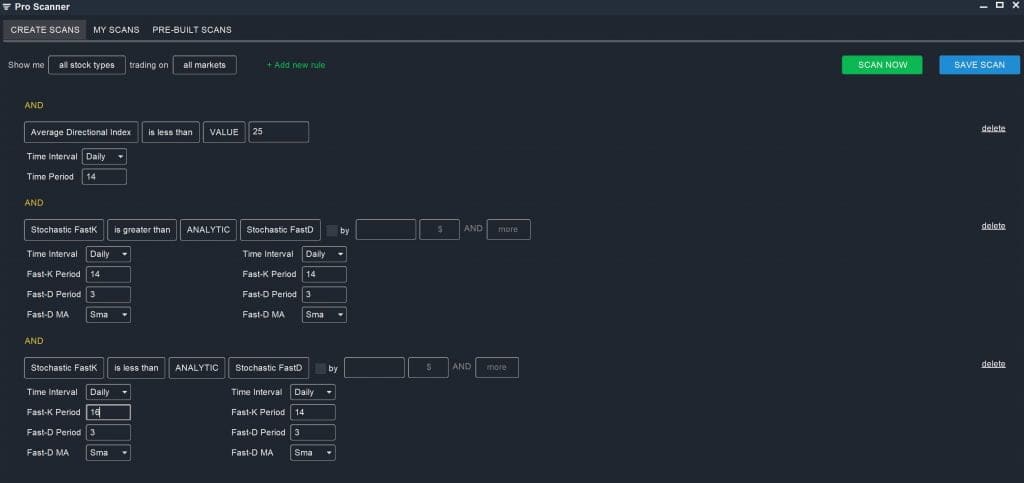
You can also use the Pro Scanner to find stocks that have recently experienced a %K-%D crossover, indicating a gain or loss in momentum:
Average Directional Index (Daily, 14) is less than VALUE 25
AND
Stochastic FastK (Daily, 14) is greater than ANALYTIC Stochastic FastD (Daily, 14)
AND
Stochastic FastK (Daily, 16) is less than ANALYTIC Stochastic FastD (Daily, 14)
In this case, we use a slightly longer 16-period %K to find instances where %K is rising relative to %D. Once again, make sure that your scan is limited to stocks that are trading sideways rather than trending.
Divergence
Finally, we can create a scan to look for divergence between the stochastics oscillator and the price:
Average Directional Index (Daily, 14) is less than VALUE 25
AND
Stochastic FastD (Daily, 14) is less than ANALYTIC Stochastic FastD (Daily, 20)
AND
2 DAY HIGH is greater than or equal to ANALYTIC 20 DAY HIGH
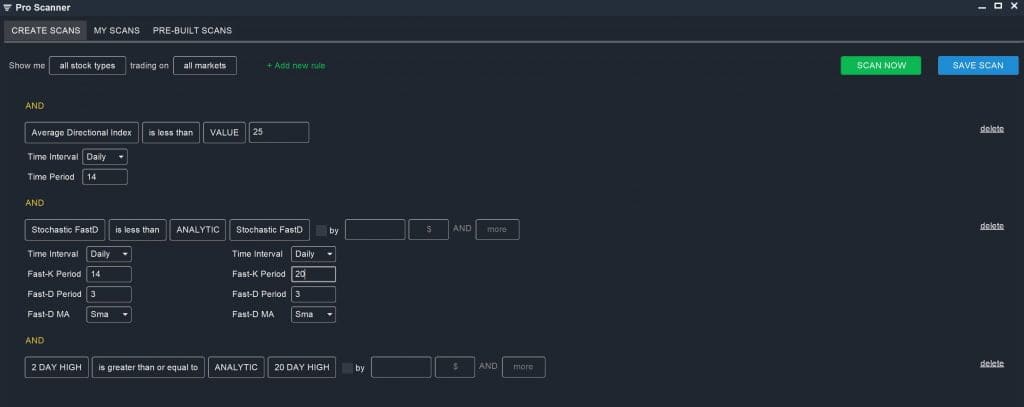
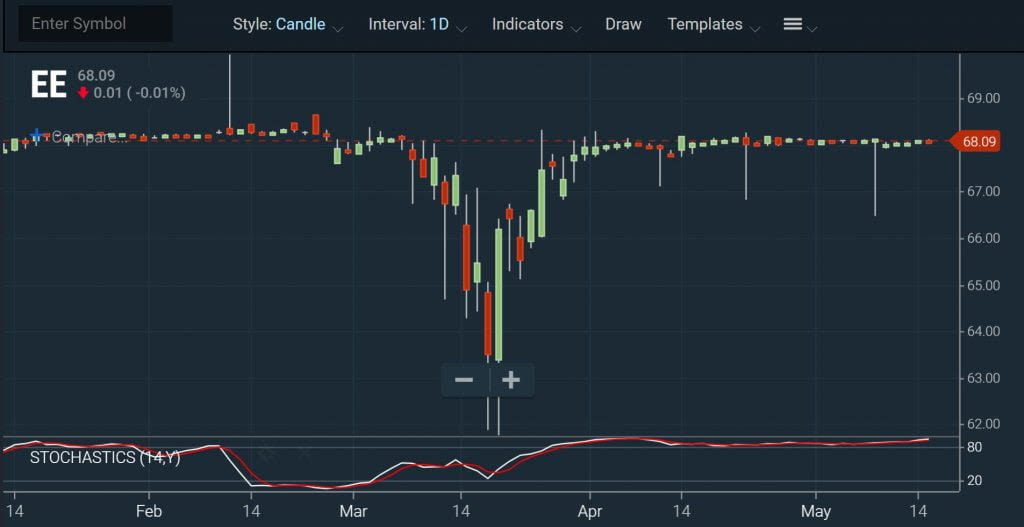
These parameters look for stocks that have a declining %D value, but which are also hitting new short-term highs. Note that divergences are not overly common, so you may need to loosen these parameters in order to find trading opportunities.
Conclusion
The stochastics oscillator is frequently used by traders to spot opportunities to trade choppy and sideways-moving stocks. The indicator is very accurate when used correctly and presents several different options depending for use depending on your trading strategy. With the Pro Scanner in Scanz, you can easily create a custom stochastics scanner and never miss a trade.
Related Reading:
- The Stochastics Indicator: A Complete Guide
- RSI Stock Screeners: Comparing Momentum Oscillators
- Overbought Stock Screeners: Finding Reversal Candidates
Ready to start scanning? Try for free and choose the plan that fits your workflow.