Fundamental analysis is a way for traders to determine the fair value of a stock. In many cases, fundamental metrics give a quantitative overview of a company’s financial situation, future outlook, and stock price relative to finances.
Fundamental analysis is often considered an entirely separate way of looking at stocks than technical analysis, which examines stock price movements. However, fundamental analysis plays an important role in trading. In this article, we’ll explain how traders can put fundamental analysis to work and explain key metrics used in fundamental stock analysis.
What is Fundamental Analysis?
Fundamental analysis is a way of analyzing a company to determine its fair value. This is a theoretical stock price at which the stock exactly reflects a company’s future earnings potential. Fundamental traders look for stocks that are priced above or below the theoretical fair value as determined by fundamental analysis.
The information used as part of fundamental analysis can be wide-ranging. For example, traders may look at a company’s share structure, assets, performance, cash flow, market fit, industry trends, competitors’ financials, and more.
While not all of this information is important for technical traders, some key elements of fundamental analysis can be useful for traders of all stripes. For example, traders may want to look at how many shares a company has issued and who owns them, since this affects liquidity and the frequency of block trades (if the shares are held by institutions). In addition, traders may want to consider a company’s profit and cash flow before picking up shares of a company to ensure that it can weather any short-term changes in the business environment.
Important Metrics for Fundamental Analysis
Let’s take a closer look at some of the essential metrics for fundamental analysis that every trader should know about:
Market Cap
A company’s market cap is the total valuation or worth of that company according to the market. Market cap is equal to the number of outstanding shares a company has issued multiplied by the current share price.
Stocks are often grouped by market cap. For example, the S&P 500 index represents the 500 largest companies in the US by market cap.
Outstanding Shares
Outstanding shares are al of the shares a company has issued. The number of outstanding shares includes shares traded on the open market, restricted shares held by company insiders, and share blocks held by institutional investors. The number of outstanding shares can change significantly over time as companies issue shares as compensation to executives and employees or buy back shares.
Float
Floating shares are all of the shares of a company that trade publicly on the stock market. In contrast to outstanding shares, the number of floating shares doesn’t include restricted stock, shares held by company executives or employees, or shares held by majority shareholders.
Float is especially important for traders because it impacts a stock’s liquidity. If a company has a large number of outstanding shares but low float, the stock could experience more volatility.
% Held by Insiders
The percentage of shares held by insiders describes the number of shares held by a company’s executives and board members relative to the total number of outstanding shares. Shares held by insiders tend not to trade frequently. In addition, a higher percentage of shares being held by insiders may be a sign that the company’s leadership believes the company is headed in a good direction and that the stock price will rise.
% Held by Institutions
The percentage of shares held by institutions describes the number of shares held by large investment firms, insurance companies, or mutual funds. This number can also include private foundations, endowments, or other money management entities.
Institutional investors are often used as a bellwether by traders. More ownership by institutional investors typically means that large firms (which employ teams of professional analysts) believe the share price will rise over time. When institutional investors buy or sell large amount of stock, traders take note as it indicates growing or fading confidence in the company.
Revenue
Revenue is the total amount of money that a company brings in, typically from sales or services. A single revenue number on its own isn’t particularly informative. However, looking at changes in revenue over time can help traders understand whether a company is growing or shrinking.
Gross Profit
Gross profit, or gross margin, is a company’s revenue minus its cost of goods sold. So, it’s the amount of money that a company has after producing and selling a product. Gross profit indicates whether a company has a high-margin product or a low-margin product, or whether the company’s profit margin is changing over time.
EBITDA
EBITDA stands for ‘Earnings Before Interest, Taxes, Depreciation, and Amortization.’ This metric is often used instead of net income because it provides a clearer picture of how much money a company is actually making or losing. However, keep in mind that EBITDA leaves out costs associated with property and capital equipment, which can be high for some types of companies.
Total Cash
Total cash is the total amount of money that a company has coming into its business, from any source. This number includes revenue as well as other income from lawsuits, investments, and any other money-generating events.
Total Debt
The total debt is the total amount that a company owes. This includes short-term debts like accounts payable, wages payable, short-term loans, and credit card debt. It also includes long-term debts, such as bonds, property and equipment leases, loans with terms over 12 months, and deferred compensation (including stock compensation plans for employees).
Shares Short
Shares short is the number of shares of a company that have been borrowed by short sellers and sold. A high number of shares short indicates that short sellers have taken an active interest in a company and are betting against it. At the same time, since short-sold shares must be bought back, a high number of shares short can lead to a short squeeze if the stock price rises.
Short % of Float
The percentage of floating shares that have been sold short is another way to look at short selling activity. This percentage is often more informative than the total number of shares sold short since it gives information about likely liquidity.
Days to Cover
The days to cover ratio is a metric of how many days it would take to close all of the existing short positions for a company’s stock. The days to cover ratio is based on the current number of shares sold short and the average daily trading volume of the stock.
A higher number of days to cover means that short sellers are particularly vulnerable to a short squeeze, as there will not be enough shares being traded in even an above-average volume day to close out all short positions.
Month over Month Change in Short Interest
The month over month change in short interest, usually expressed as a percentage, indicates whether a stock is being shorted more or less in the current month compared to the previous month. When looking at other short selling metrics, it’s important to check the month over month change to see whether short selling activity is increasing or decreasing.
Using Fundamentals in Scanz
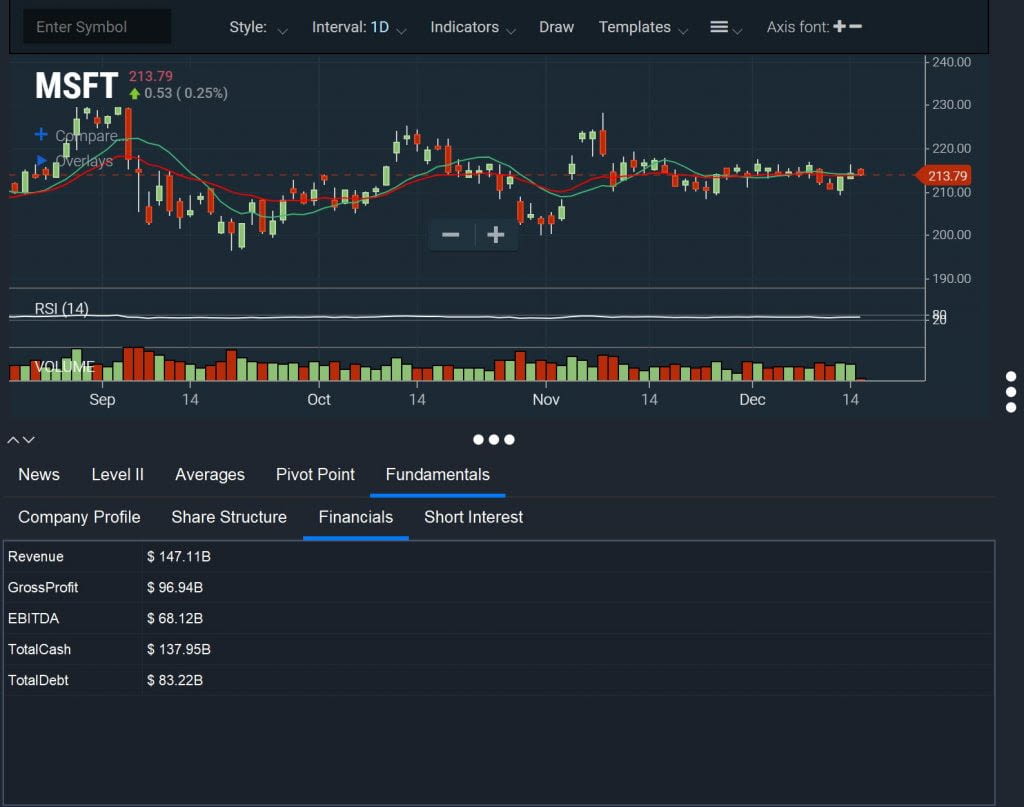
Fundamental metrics are available in Scanz through the Montage module. Just click the ‘Fundamentals’ tab beneath the price chart and you’ll find all of the key metrics we explained above.
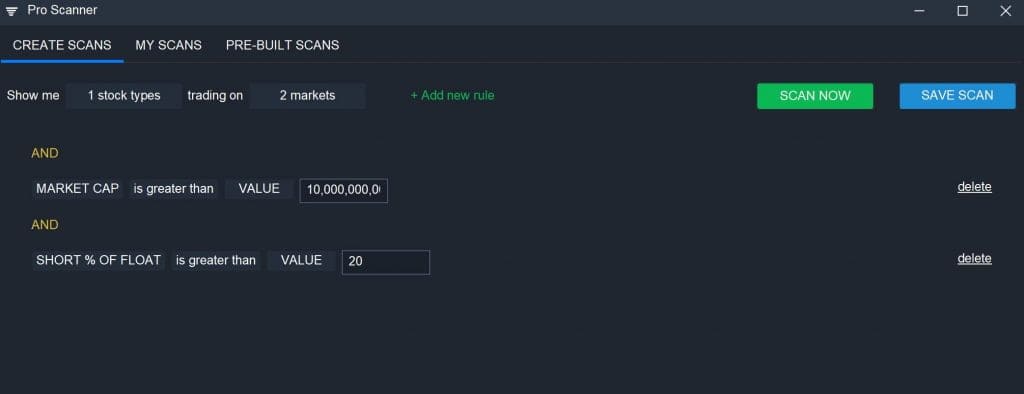
Importantly, you can also use fundamentals when building scans with the Pro Scanner or when sorting results in the Easy Scanner. All of the fundamental metrics we covered can be found under the ‘Fundamentals’ menu when choosing scan parameters in the Pro Scanner.
Conclusion
Understanding fundamental analysis is important for all traders, including technical traders. This style of analysis can help you identify possible trends in a company’s share price and make sense of short selling activity. At the same time, putting fundamentals to work in Scanz enables you to build better scans and more deeply research trading opportunities.
Related Reading:
Ready to start scanning? Try for free and choose the plan that fits your workflow.