A great scanner is one of the most powerful tools in a trader’s toolkit. Scanners help traders filter through the noise of the markets and find the best trading opportunities. Of course, a scanner is only as valuable as the filters inputted. So, how do you create a great scanner?
When you’re getting started, it can be overwhelming to build a scanner from scratch. There are hundreds of different filters you can use and you want to make sure you you’re able to find the best trading opportunities. One of the most efficient ways to build a scan that delivers the results you want is to reverse engineer the process.
“Reverse engineer? Do I need to be a scientist for this?” Don’t worry – you can put your lab coat away. This process is simpler than it sounds. When you reverse engineer the scanning process, you simply analyze your favorite trading setups and build a scanner to find similar setups.
For example, let’s say you place a profitable trade on a stock that was breaking out above its 52-week high. Naturally, you’d want to find more stocks that are about to break out above their 52-week highs. The best way to find these stocks is by creating a scan.
This process is best explained by example.
Before we look for stocks to trade, we need to know what we are looking for. If you have an ideal setup in mind, start there. If you’re unsure about which setups you’d like to find, you can analyze your recent trades and see which ones were most profitable.
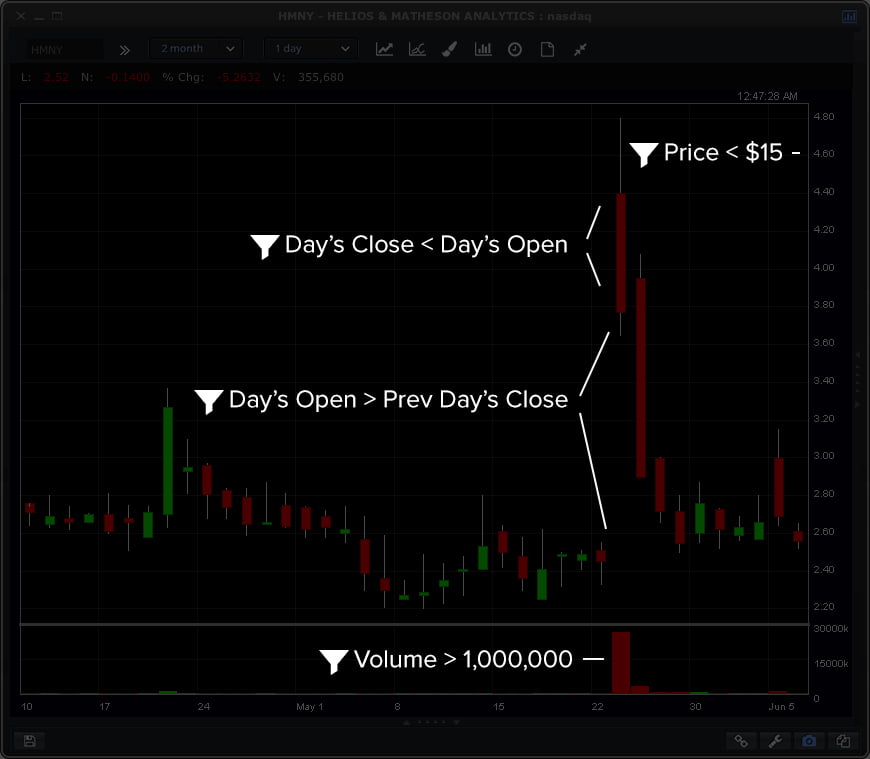
For this tutorial, we will look at $HMNY. The stock closed at $2.45/share on May 22, 2017 and opened at $4.40 on May 23, 2017. From there, it grinded back down to it’s previous range ($2.50’s), making for a great short opportunity.
Of course, you don’t want to find stocks like $HMNY once the move is already over; you want to catch them when they are still hot. So, we will be looking for stocks that gap up and close red. Let’s get started.
In this step, we will work on creating the filters we need to create a quality scan. We want to focus on relevant data that makes this setup unique.
Here are some considerations:
Remember, you only want to focus on relevant filters. For example, $HMNY is well below its 52-week high, but that’s not very significant in this situation. Contrarily, the fact that $HMNY gapped up from it’s previous close is very significant.
Building a scan to find similar setups will require some trial and error. We will tweak and optimize our filters to ensure we get the results we want.
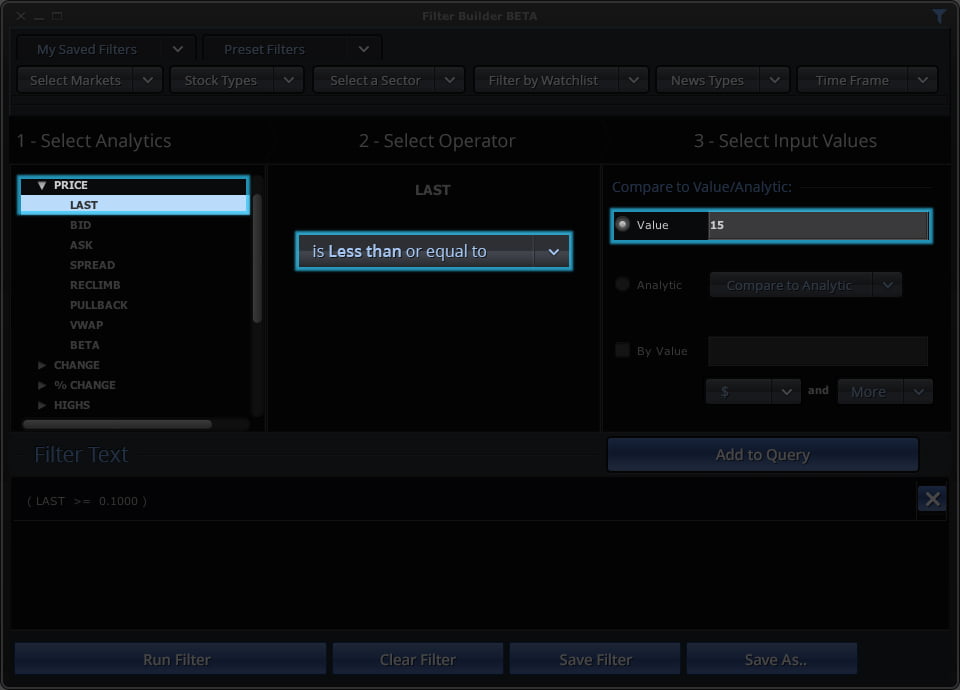
First things first, let’s account for the stock’s price range. On the day of the move, $HMNY was priced in the $4-$5 range. We’ll expand the price range a bit and look for stocks under $15 and above $0.10 (to filter out penny stocks).
Filters:
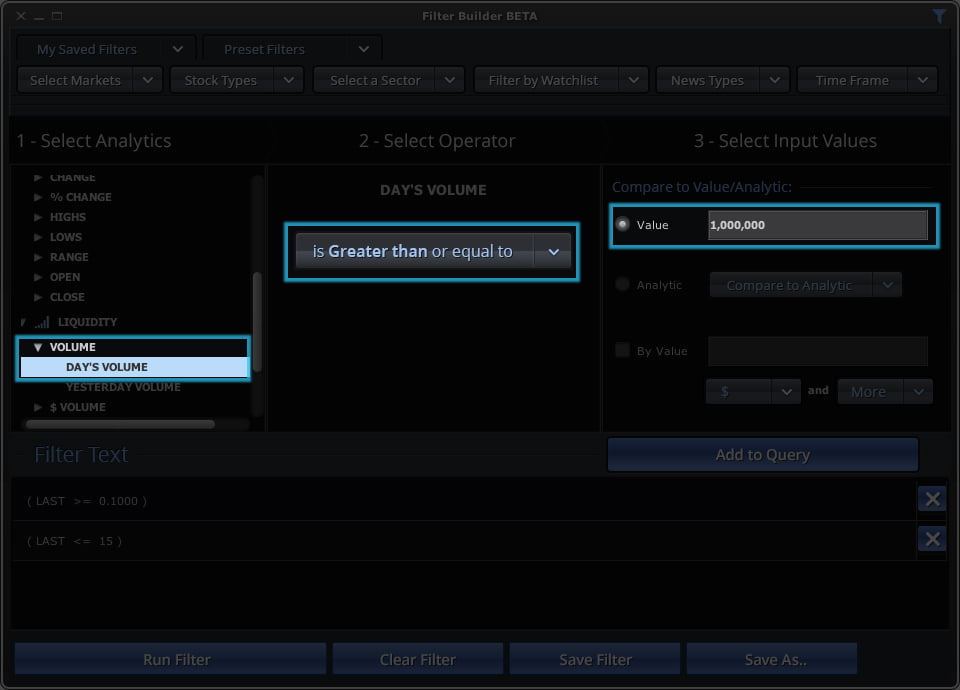
We also want to account for the liquidity of the stock. In our example, $HMNY traded 27 million shares. Moves of this magnitude don’t happen everyday, so we will set the volume restriction a bit lower while still accounting for liquidity.
Filters:
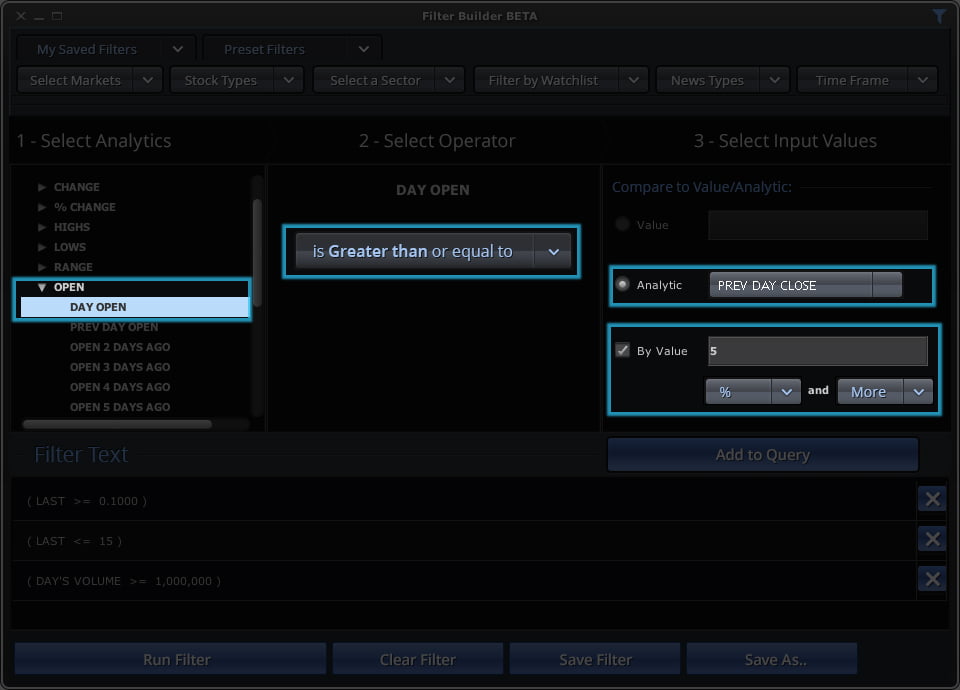
Next, we want to create a filter to find stocks that have gapped up. We will also specify that we want the gap to be at least 5% to ensure that we find significant gaps.
Filters:
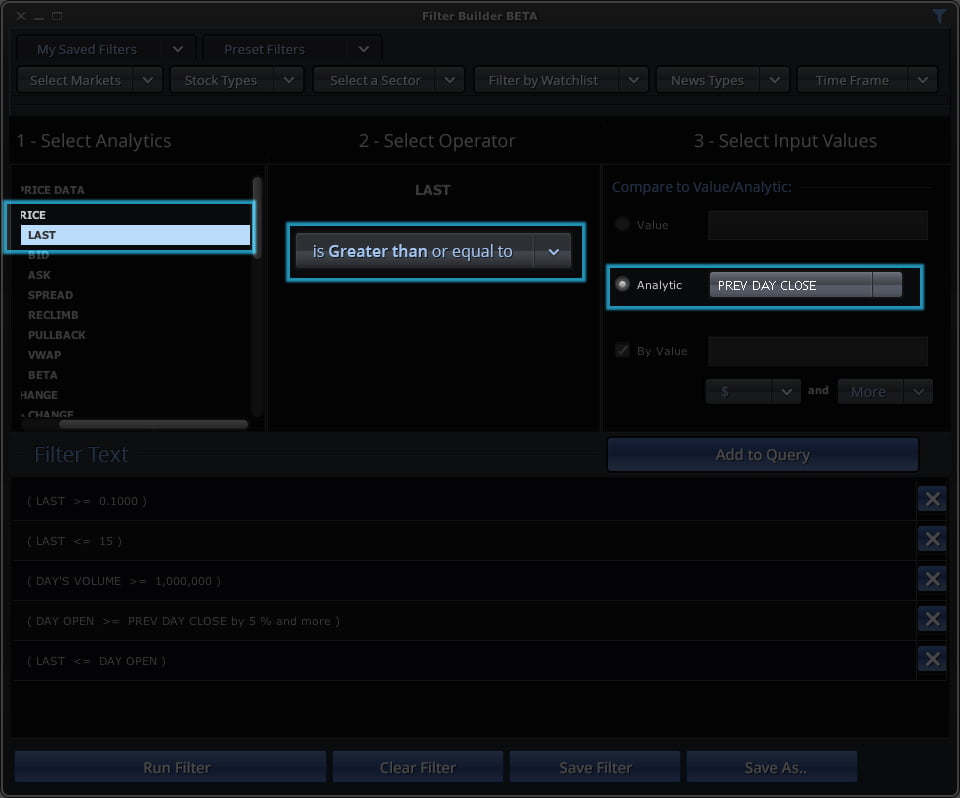
Now, we have a list of stocks in our price range that gapped up with significant trading volume. Because we are looking for short opportunities, we want to isolate the stocks that gapped up but closed red on the day. The red close indicates weakness, making for a better short opportunity. We are also going to add a filter to remove results where the gap has already filled.
Filters:
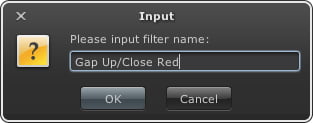
Let’s save this scan as “Gap Up/Close Red” and run it so we can analyze the results.
It’s important to note that the goal of creating this scan is NOT to get tons of results. We don’t want to have to comb through 50+ charts. Instead, we want to focus on finding the most relevant chart setups that will provide great trading opportunities in the coming days.
In this case, we are looking for stocks that gapped up but closed red. If we find any stocks that do not meet those criteria, we need to go back and adjust our filters.
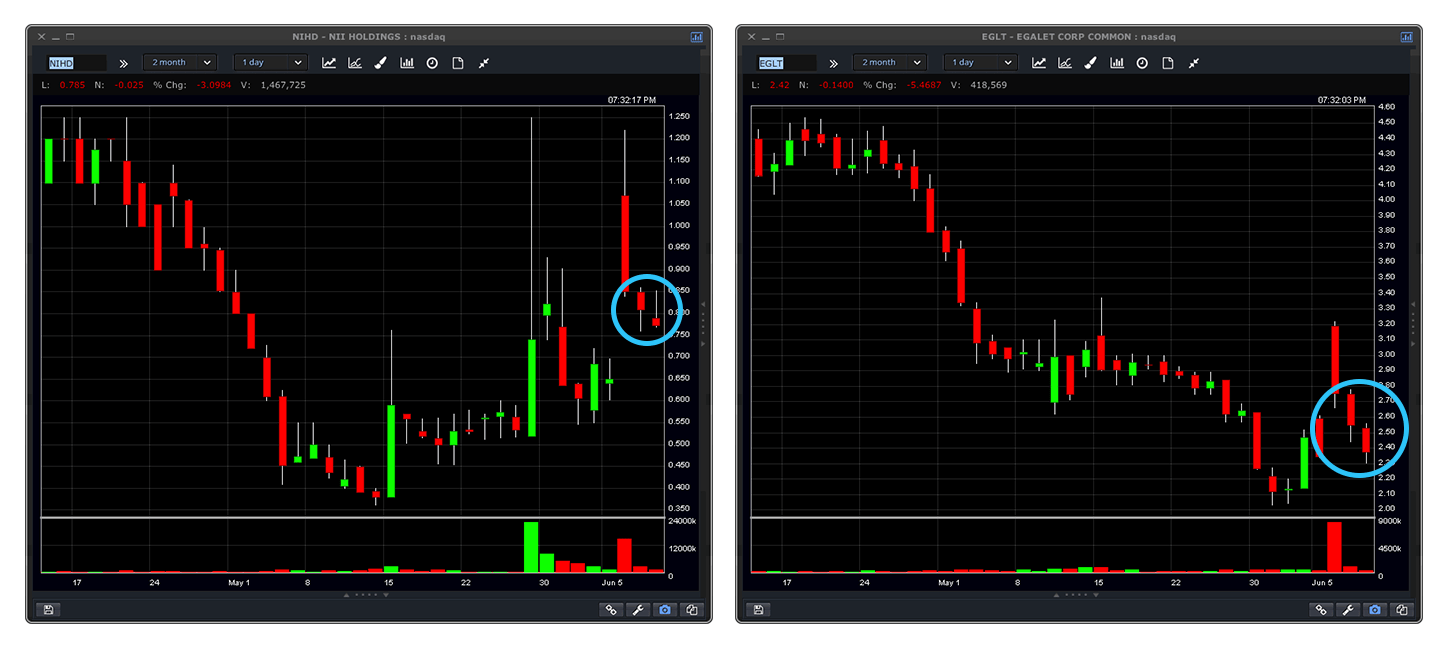
Our “Gap Up/Close Red” scan returned 3 stocks that met our criteria. Now, we will check the charts to make sure we found what we were looking for.
EGLT – Gapped from $2.35 to $3.19 before closing at $2.76
NIHD – Gapped from $0.65 to $1.07 before closing at $0.85
CBRIQ – Gapped from $0.099 to $0.135 before closing at $0.133
We can see that EGLT and NIHD are both perfect matches. CBRIQ fits all of our criteria but the red close is not very significant. If we wanted to filter out this result, we could go back to our scan and add a minimum value to our “Last Price < Day Open” filter (i.e. 2%).
Creating your scan is just the first step of the trading process. The scan helps you find charts that are similar to a particular setup, however there is no guarantee they will pan out the same way as the original setup.
In certain cases, you may need to adjust your scan settings. For example, you may find that our new “Gap Up/Close Red” scan works best when a stock is coming out of a longer term downtrend. If that were the case, you would add filters to find stocks that have been down trending.
For our “Gap Up/Close Red” scan, both NIHD and EGLT played out the same as HMNY, making for great short opportunities.
If you’ve been trading for a while, you already have all of the data you need to create great scans. Go back and analyze your trades to pinpoint where you make the most money. Once you know your ideal chart setups, you can begin creating scans to find more of them.
Reverse engineering the scanning process is one of the most effective ways to find stocks to trade. This process can require some trial and error, but once you create your scans, you will be able to use them to find stocks over and over again.
Our new prebuilt scans make it simple for anyone to start profiting immediately with proven…
Most Active Big Board Stocks TSLA, SPY, AAPL, AMZN, AMD, NVDA, QQQ, TQQQ, MSFT, META…
Most Active Big Board Stocks TSLA, AMZN, AAPL, NVDA, AMD, SPY, MSFT, QQQ, AGLE, TQQQ…
Most Active Big Board Stocks TSLA, NVDA, AMD, SPY, AAPL, AMZN, INTC, QQQ, MSFT, AHI…
Most Active Big Board Stocks TSLA, VCIG, NVDA, AAPL, SPY, AMD, AMZN, MSFT, QQQ, INTC…
Most Active Big Board Stocks TSLA, NVDA, SPY, AAPL, AMD, MSFT, QQQ, AMZN, SPCE, TQQQ…