There are hundreds of great trading opportunities every day. The role of a trader is to filter through the noise of the markets and narrow in on the best setups. This may feel like trying to find a needle in a haystack, but the process is painless once you know how to start. We’re going to show you exactly how you can start uncovering golden trading opportunities by harnessing the power of advanced market scanners.
Every good scan starts with the proper scanning criteria. There is no “one-size-fits-all” scan, as all traders have different styles and strategies. That said, once you understand which filters are available and how they work, you can begin creating a scan that works for you.
If you are brand new to the scanning process, review this post first so you can get a better understanding of the scanning process.
In this post, we are going to discuss some unique scanning filters that can help you consistently find great trade setups.
Dollar Volume
First things first, it’s important to understand the concept of volume. Volume refers to the amount of shares traded in a particular time period. The dollar volume metric takes this a step further by accounting for a stock’s price. To calculate a stock’s dollar volume, simply multiply the volume by the stock price.
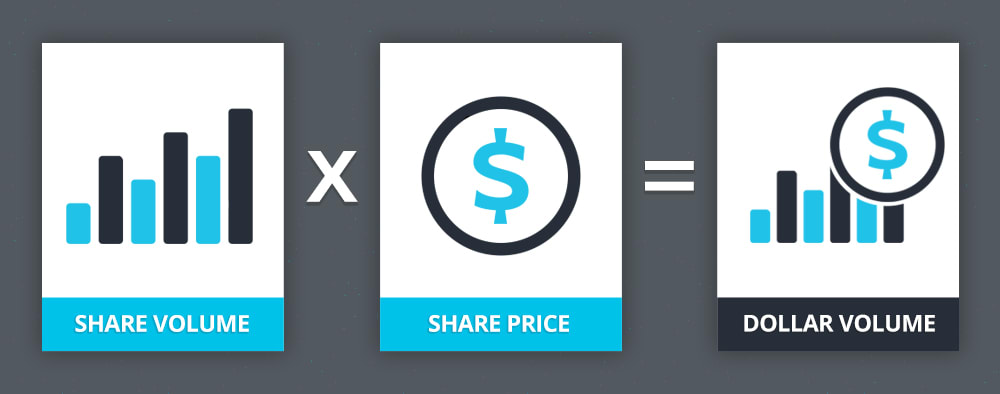
The dollar volume filter is powerful because it can help equalize stocks across a broad price range. For example, if you simply scanned for stocks under $50 with 1,000,000 in volume, you would get a wide range of results. A stock trading 1,000,000 in share volume at $1 per share would only be trading $1,000,000 dollar volume, which isn’t too significant. A stock trading 1,000,000 in share volume at $50 a share would be trading $50,000,000 dollar volume, which is far more significant. In this particular example, you could remove your 1,000,000 volume filter and replace it with a $10,000,000 dollar volume filter. This will allow you to find better trading candidates.
Number of Trades
Liquidity is one of the most important components of day trading. Liquidity can be defined as the ease with which you can get in and out of positions in an equity. This is particularly important for momentum traders and scalpers who rely on precise entries and exits.
The “number of trades” filter helps traders measure the liquidity of a stock. This metric calculates the number of buy and sell orders for a given time period. Once again, this can be far more powerful than a simple volume indicator. For example, a stock may have traded 1,000,000 shares, of which 400,000 came from four block trades. In this aspect, the volume indicator can be misleading. Contrarily, the “number of trades” metric would help you gauge the true interest in a stock.
Moving Averages
Moving averages are used to smooth a stock’s price action by calculating the average closing prices of a stock over a given period. For example, the 50-period simple moving average would take the sum of the past 50 closing prices and divide it by 50.
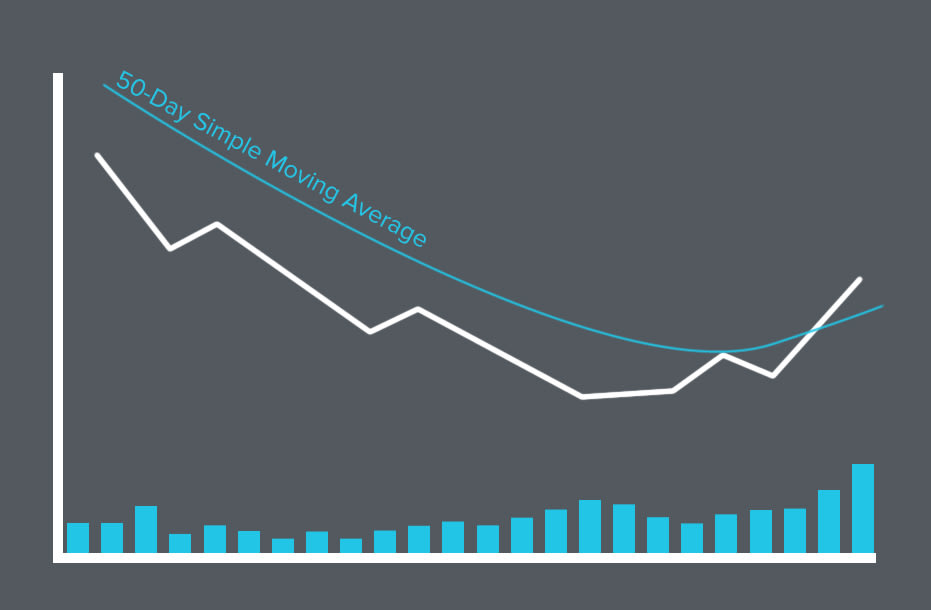
Moving averages can be great when you want to account for the trend of a stock. Unfortunately, there is no simple way to scan for a stock that is in an uptrend. That said, you can incorporate moving averages into your scans. For example, if you were looking for a short-term uptrend, you may look for stocks trading above their 10-day moving average. If you were looking for a longer term uptrend, you may look for stocks trading above their 50 and 200-day moving averages.
Moving averages can be particularly beneficial for swing traders who plan to hold their positions for long periods of time. They can also be beneficial for traders who are interested in trading reversals.
Average Volume
Traders always want to follow the action. In the market, “action” can be quantified by measuring volatility and liquidity. Simply put, traders want to find stocks making big moves that they can get in and out of with ease.
Average volume can be a great comparative metric when looking for breakout stocks. When a stock experiences higher levels of volatility, it is usually fueled by above average volume. You can incorporate average volume filters into your scan to find stocks making big moves. For example, you may look for stocks with daily volume that is at least 50% higher than the 60-day average trading volume. These filters will generally help you find stocks with higher volatility and liquidity, making for prime trading opportunities.
Day Highs and Lows
One of the challenging parts about creating a good scan is finding a way to quantify what you are looking for. For example, most traders would love to catch breakouts before they happen, but there is no “easy button” that uncovers these setups. That said, if you get clever with your scans, you can have a big advantage in trading.
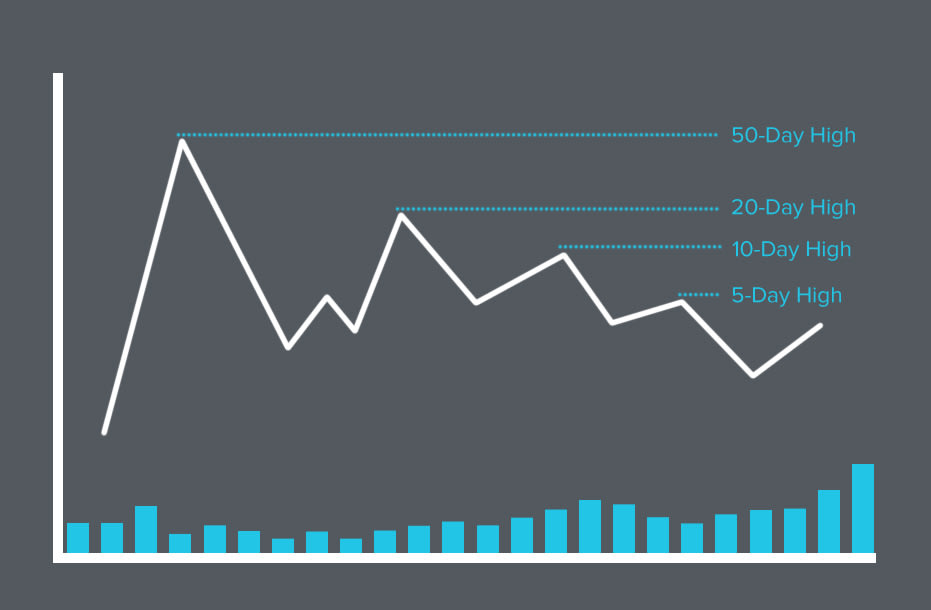
Incorporating day highs and day lows into your scanning process can help you find stocks that are breaking out or breaking down. For example, if you want to find shorter-term breakouts, you may look for stocks that are trading above or below their 30-day highs by 1% or less.
Average Daily Range
The average daily range is a great metric for measuring volatility. Traders want to find stocks that have a broad price range, making for more trading opportunities. For example, if a stock is stuck in a $0.10 range every day, it would be difficult to place profitable trades (without large sums of money). That said, a stock trading in a $5 daily range would provide plenty of opportunities.
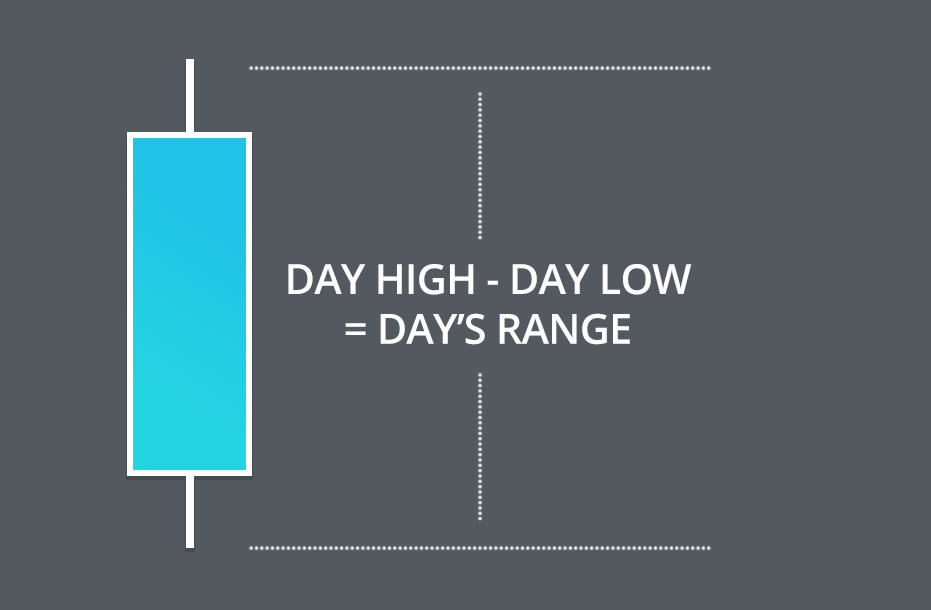
The daily range is calculated by taking the difference between the stock’s daily high and daily low. If you are measuring this data over a period of time, you would add up these daily ranges and divide them by the time period.
Here’s an example:
High Low Daily Range Day 1 $25 $20 $5
Day 2 $28 $24 $4
Day 3 $29 $26 $3
If we were to calculate the 3-day average daily range, it would be $4 ((5+4+3)/3).
A $4 range on a stock price in the mid/high $20 range would provide plenty of great intraday trading opportunities.
Float
A stock’s float is defined as the number of shares available for trading. This is one of the few fundamental indicators that can have a significant impact on technical trading. Low float stocks are generally more volatile because they require less share volume to make big moves. It’s not uncommon to see a low float stock run a few hundred percent in a few days.
The supply on these stocks is lower, so any buying pressure (demand) can push the stock much higher.
While a stock’s float is not a great standalone indicator, it can be combined with other indicators to find prime trading setups. For example, you may look for stocks under $10 that are up 20% or more with a float of 10,000,000 or less.
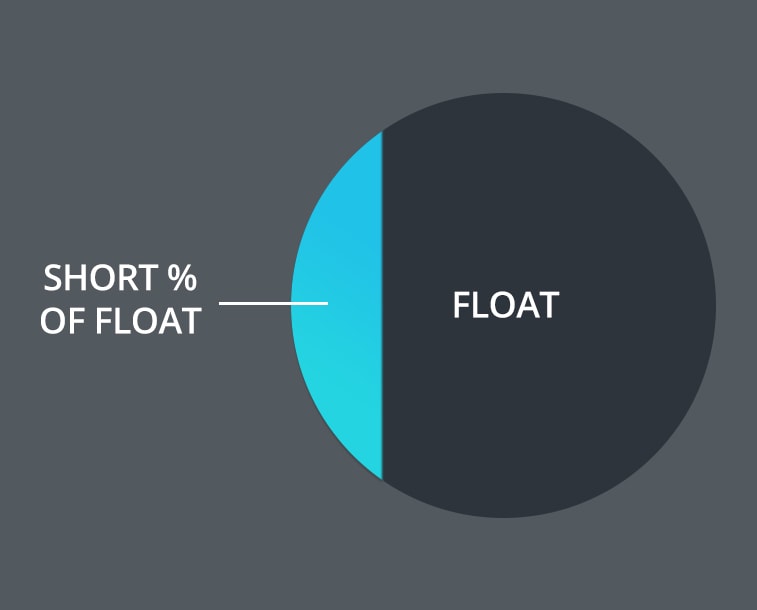
Short Percent of Float
We just discussed how the float is the number of shares available for trading. The short percent of float measures how many of those shares are held by short sellers. Stocks with high percentage of short sellers can be prone to a short squeeze. This occurs when a bunch of short sellers all cover their positions in a close time period.
Similar to the float metric, the short % of float should be used alongside other indicators. When using this indicator, you want to find stocks that are prone to an upcoming short squeeze. You may do this by looking for stocks that are breaking above their 10-day high with 20% or more of the float short.
Conclusion
There’s an endless amount of different filters and filter combinations you can use when creating your scans. Think of these filters as tools in your toolkit. The goal isn’t to use as many filters as possible. Just like tools in a toolkit, you want to understand how each of these filters works so you can use them at an appropriate time. Choose a goal for your scans and use your filters to help you find better trading opportunities.
Related Reading:
- How to Use a Stock Screener
- How to Find Breakout Stocks
- How to Find Low Float Stocks
- 4 Great Premarket Scans for Day Traders
- 6 Great Scans to Build Better Watchlists
- How to Create a Block Trade Scanner
- Scanning for Stocks with Abnormal Volume
Ready to start scanning? Try for free and choose the plan that fits your workflow.