Moving Averages
Moving averages are among the most commonly used indicators in technical analysis and one of the primary indicators that nearly every trader has overlaid when studying a stock’s chart. Moving averages smooth price action to make it easier to visualize trends, help to filter out noise of random price fluctuations, and can be used to identify levels of support and resistance.
Type of Indicator
Moving averages are a lagging or trend-following indicator since they are calculated from previous price data. In contrast to other popular indicators, moving averages do not predict future price action, but rather make it easier to identify trends in recent or historical price data. Moving averages can also be used to identify levels of price support and resistance, which can be useful for confirming breakouts predicted by other indicators.
Calculating Moving Averages
There are a variety of different moving averages used by traders, but by far the most widely used are the simple moving average (often abbreviated SMA), weighted moving average (often abbreviated WMA), and exponential moving average (often abbreviated EMA). All three moving averages operate on a sliding window basis – that is, the moving average slides along the price data such that at each new calculation the oldest data point is dropped from the moving average and the next most recent data point is added to the moving average.
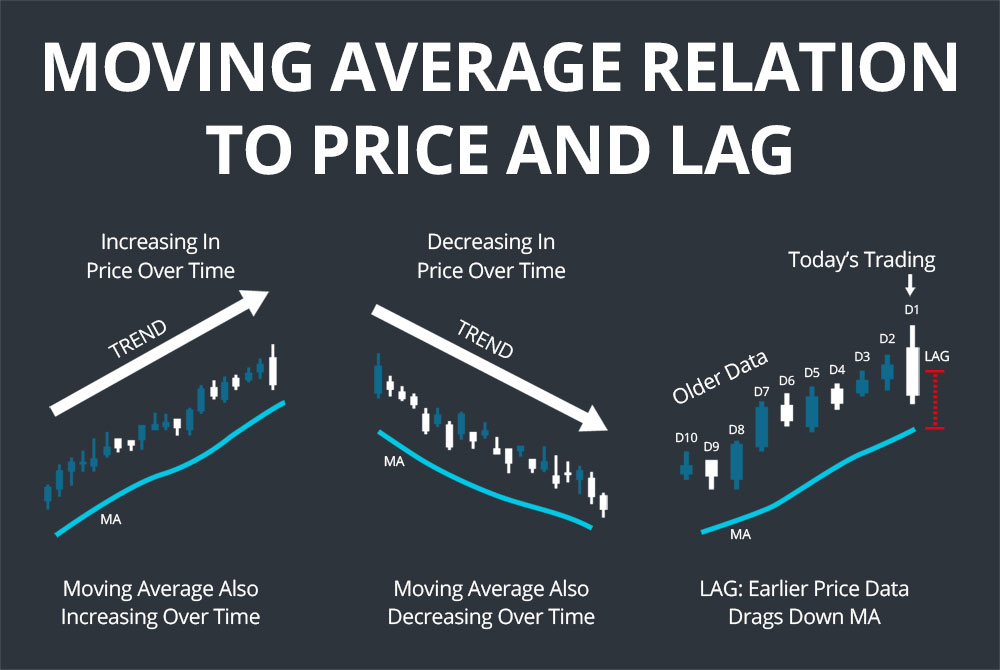
As a result, a stock that is increasing in price over time will have a moving average that also increases, since older, lower price points are dropped from the calculation as newer, higher price points are added in. The opposite is true for a stock that is decreasing in price over time. However, note that the moving average will always lag the price increase or decrease since it is including earlier price data that drags it down or up, respectively, relative to the latest price.
Simple Moving Average
The simple moving average is easy to calculate since it is simply an arithmetic mean of a set of closing prices, with the number of prices included determined by the user-defined length of the moving average. Thus:
Simple Moving Average = Sum of Closing Prices of Each Interval / Number of Intervals
This means that, in the example of a 10-day simple moving average, each day’s closing price is weighed equally when calculating the average – more recent data is not given special attention in the moving average.
Weighted Moving Average
Weighted moving averages give more weight to recent price data than to older price data within the sliding window. The sum of the weights must add up to 100%, but are distributed such that, for example, the most recent closing price in a five-day weighted moving average is weighted 33% while the oldest closing price is weighted only 7%. The weighted moving average is calculated by multiplying each closing price by its respective weight, summing them, and dividing by the number of intervals:
Weighted Moving Average = (Closing Price 1 * Weight 1) + (Closing Price 2 * Weight 2) … / Number of Intervals
Exponential Moving Average
The exponential moving average differs from the weighted moving average in that the calculation applies more weight to recent price data than to older price data on a multiplicative basis rather than based on set weights.
In calculating the the current day’s exponential moving average, the exponential moving averages of all the previous days in the moving average window are required. In general, a simple moving average is used for the oldest data point in the calculation window since the exponential moving average requires an external reference point to start. However, it is worth noting that where in the past an exponential moving average calculation starts will affect its accuracy – back-calculating from years of price data is theoretically required to produce a nearly exact exponential moving average. In reality, to reduce calculation time, most software uses at least 250 intervals and can be accurate to within a fraction of a cent.
The exponential moving average for a given interval is calculated as:
Exponential Moving Average = (Closing Price – Previous Interval’s EMA) * Multiplier + Previous Interval’s EMA
The multiplier is an important term in the exponential moving average and, in the standard use, depends on the length of the exponential moving average window. Typically, the multiplier is calculated as:
Multiplier = 2 / (EMA Length + 1)
In this formulation, a shorter exponential moving average will have a larger multiplier – and thus give more weight to recent price data – than a longer exponential moving average. Doubling the length of the exponential moving average will roughly half the multiplier.
However, it is also possible to define a custom multiplier value when calculating an exponential moving average. In this case, the equivalent moving average length that would produce that multiplier using the above formula can be calculated as:
Length = (2 / Multiplier) – 1
How to Trade Using Moving Averages
Choosing the Type and Length of Moving Average
Choosing the moving average – simple, weighted, or exponential, as well as the length of the average – depends on the questions a trader is interested in asking of a stock.
In general, exponential moving averages will exhibit lower lag than a simple moving average, which can make them better for identifying how a stock’s behavior may be changing. On the other hand, simple moving averages are a more faithful representation of a stock’s price history over a given period, which makes them more suitable for identifying support and resistance levels.
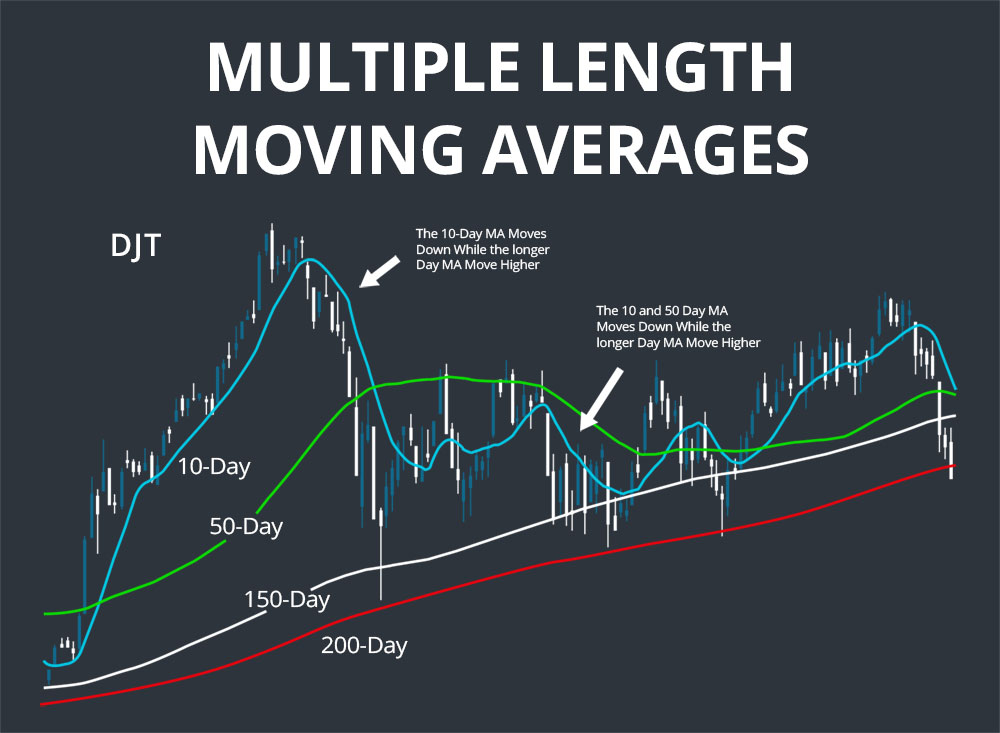
The time period of moving averages can be separated into long-term, mid-term, and short-term, and correspondingly the most popular moving average lengths are 200 days, 50 days, and 10 days. The choice of moving average length is largely dependent on the time frame of trades that a trader is interested in – longer moving averages are most useful for long-term traders, while 10-day or shorter moving averages will be more useful for day traders.
Trend Identification
One of the most basic uses of moving averages is to identify price trends over time. Moving averages, both simple, weighted, and exponential, are especially suited for this purpose since they smooth intraday price action and filter out noisy price data. A falling moving average indicates a bearish trend, whereas a rising moving average indicates a bullish trend. Note that looking at different lengths of moving averages will give information about trends over different timescales, so it may be advantageous to look at multiple lengths of moving averages.
Moving Average Crossovers
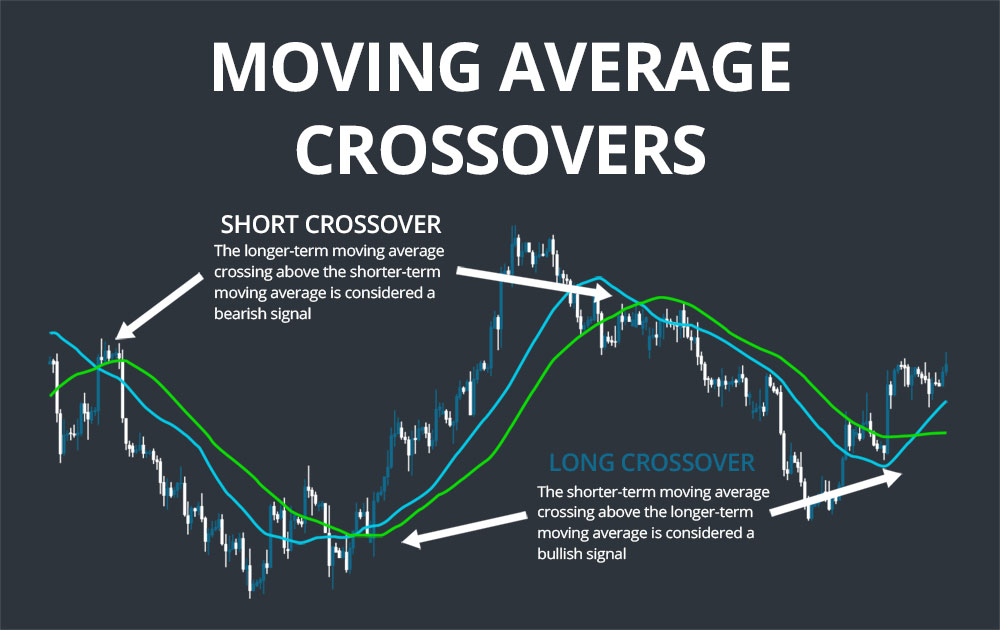
One of the most commonly used signals produced by moving averages is when a shorter-term moving average crosses above or below a longer-term moving average. The shorter-term moving average crossing above the longer-term moving average is considered a bullish signal (also known as a golden cross), whereas a cross below is considered a bearish signal (also known as a dead cross).
The choice of lengths of the two moving averages is important when monitoring for crossovers. A short- to medium-term crossover system may employ 10-day and 50-day moving averages, while a longer-term system may employ 50-day and 200-day moving averages. Since moving averages are lagging indicators, a crossover signal may come very late in a new trend – and this lateness is exacerbated as the length of the moving averages increases. Thus, moving average crossovers are best used when a strong, continuing trend is present and when confirmed with an additional indicator such as MACD.
Moving average crossovers can also be used with a system of three moving averages. In this case, a bullish signal is triggered when the medium-term moving average is above the long-term moving average and the short-term moving average crosses above the medium-term moving average. Similarly, a bearish signal is triggered when the long-term moving average is above the medium-term moving average and the short-term moving average crosses below the medium-term moving average.
Price Crossovers
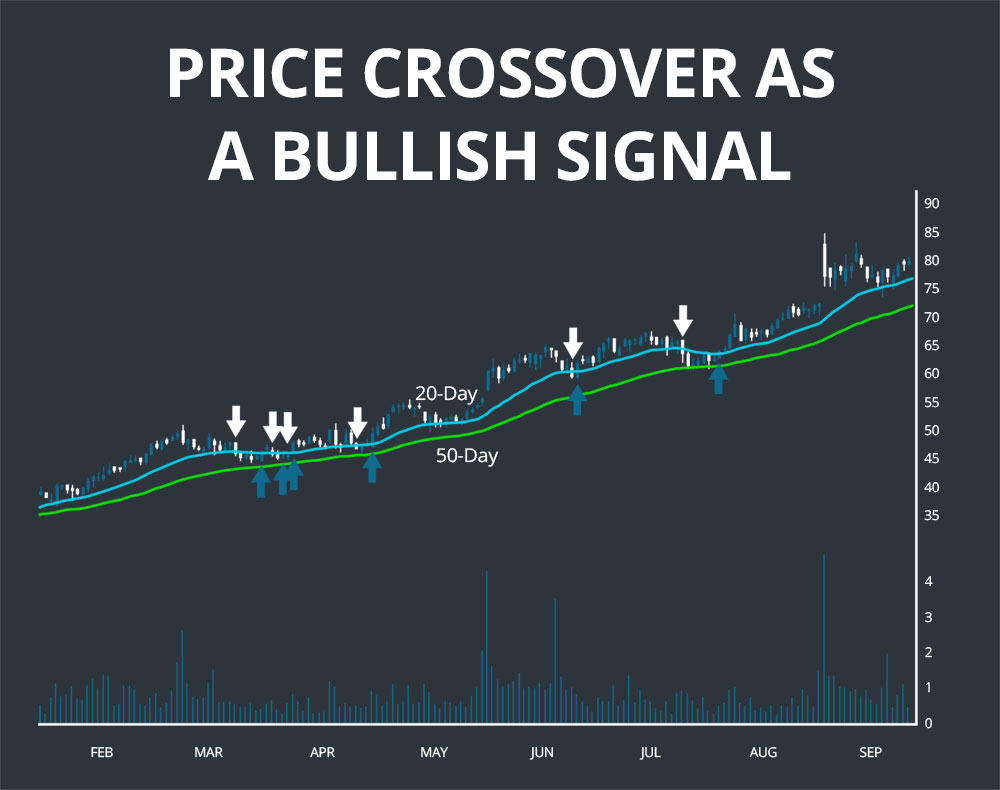
It is also possible to interpret the stock price crossing above or below a moving average as a bullish or bearish signal. Such a signal is given more support when it is in the direction of the long-term moving average. For example, a bullish signal would be triggered with the 200-day moving average is trending positively, the 50-day moving average is above the 200-day moving average, and the price crosses above the 50-day moving average.
Support and Resistance Levels
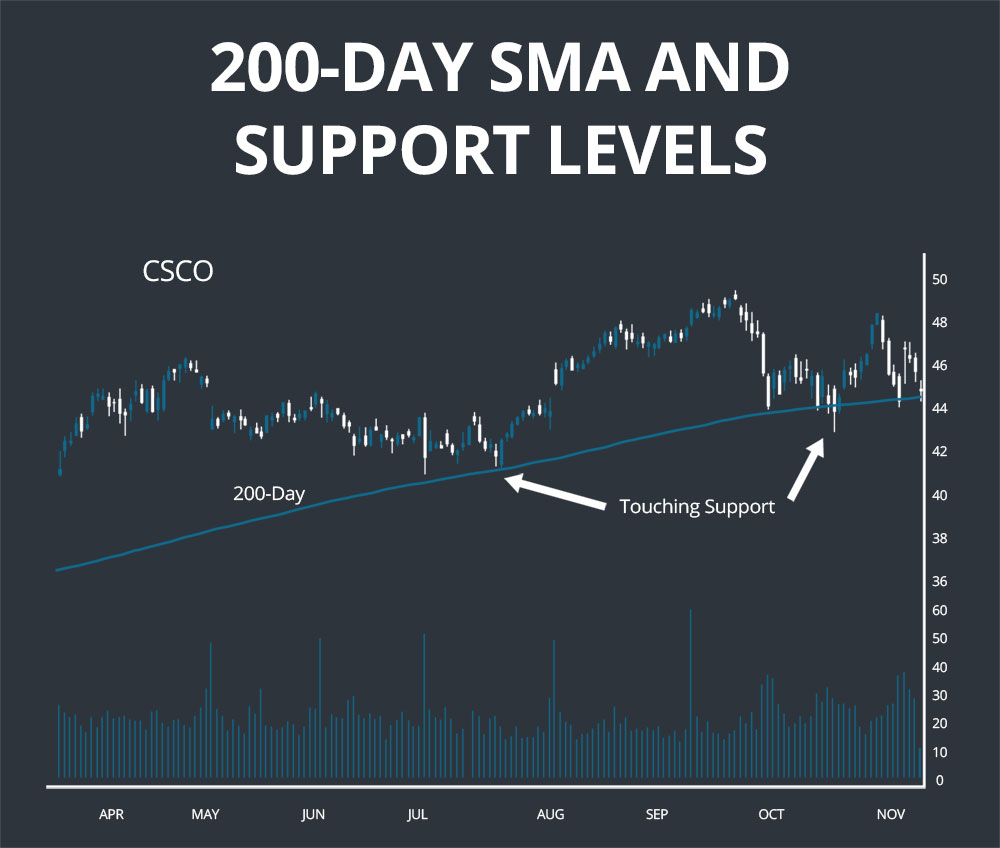
Moving averages can also be used to identify potential support and resistance levels. In many cases, because moving averages such as the 20-day and 200-day simple moving averages are so widely used and traders are watching for crossovers above or below them, the moving averages themselves represent support and resistance levels. However, be cautious whenever using moving averages to delineate support and resistance levels since such levels are defined largely by interpretation and stock prices can frequently overshoot moving averages even while finding support or resistance.
Examples
The first example shows how a price crossover above a moving average can be used as a bullish signal. In this case, the 20-day exponential moving average is greater than the longer-term 50-day exponential moving average over a roughly seven-month period, indicating an already bullishly trending stock price. Within this trend, a bullish breakout can be predicted by the stock price crossing above the 20-day exponential moving average. Furthermore, this breakout is likely to subside when the price crosses back below the 20-day exponential moving average.
The second example shows how the 200-day simple moving average can serve as a marker for support levels. Cisco (CSCO) stock repeatedly touches down to the 200-day simple moving average and may even slightly overshoot it, but is not able to break below this support level on multiple tests and rebounds each time. Once the rebound is confirmed, it can present a buying opportunity.
Conclusion
Moving averages are one of the types of indicators used most frequently by traders of all skill levels and trading styles. While moving averages on their own do not forecast price movements, they are extremely useful for clarifying price trends and identifying levels of support and resistance. In addition, moving average crossovers can be used in combination with additional technical indicators to predict bearish and bullish breakouts.

