What Is MACD
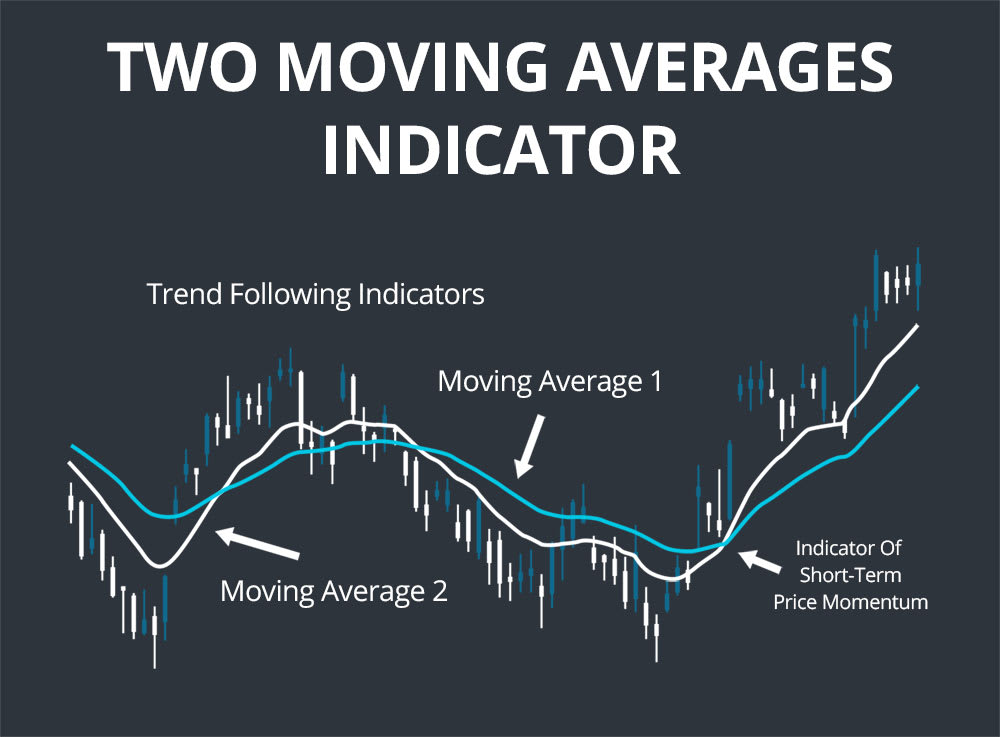
The moving average convergence divergence (MACD) was developed in the 1960s by Gerald Appel and has since become one of the most commonly used indicators thanks to its simple application and interpretation. The MACD compares the differences in two moving averages of a stock price to indicate buy and sell signals via crossover of a median line. The MACD is both a trend following indicator as well as an indicator of short-term momentum.
Type of Indicator
The MACD combines two trend following indicators – two moving averages – such that it is both a trend following indicator in itself as well as an indicator of short-term price momentum.
MACD Calculation
The MACD line is calculated by simply subtracting the 26-day exponential moving average of a stock’s price from the 12-day exponential moving average. Typically, the MACD line is plotted as a line on a chart so that it is easy to visualize whether the MACD is positive or negative – that is, above or below the centerline.
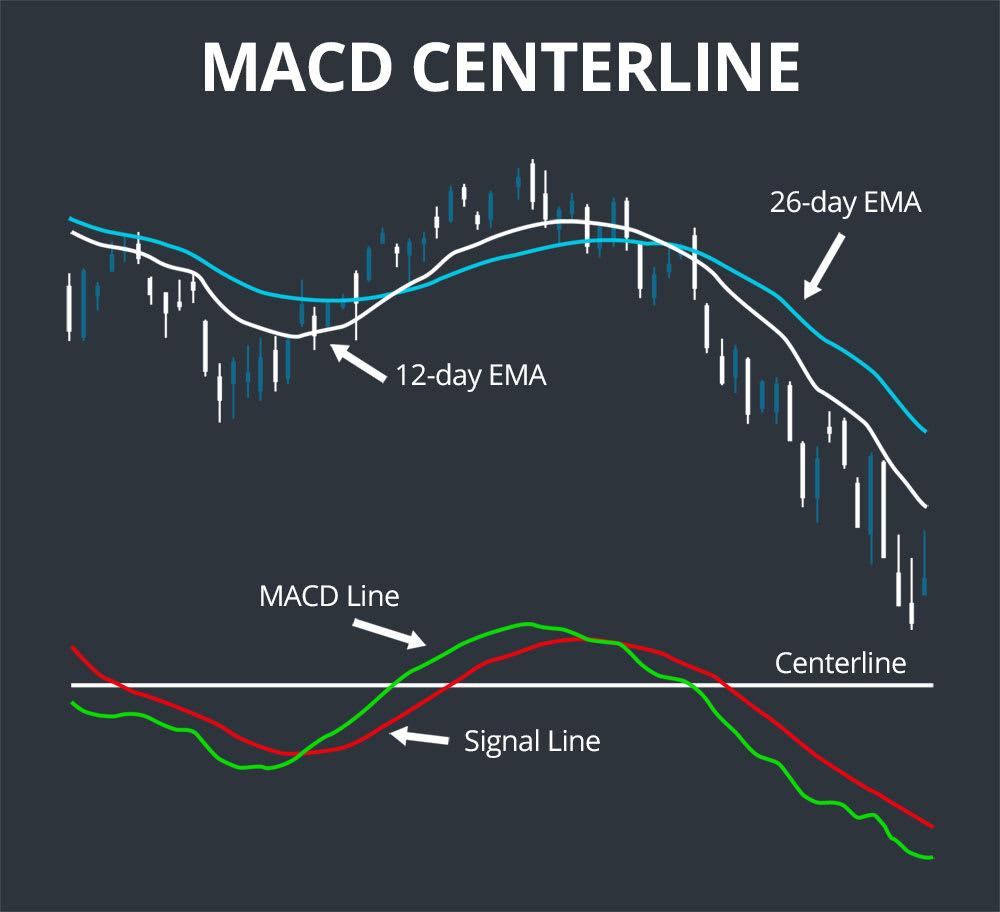
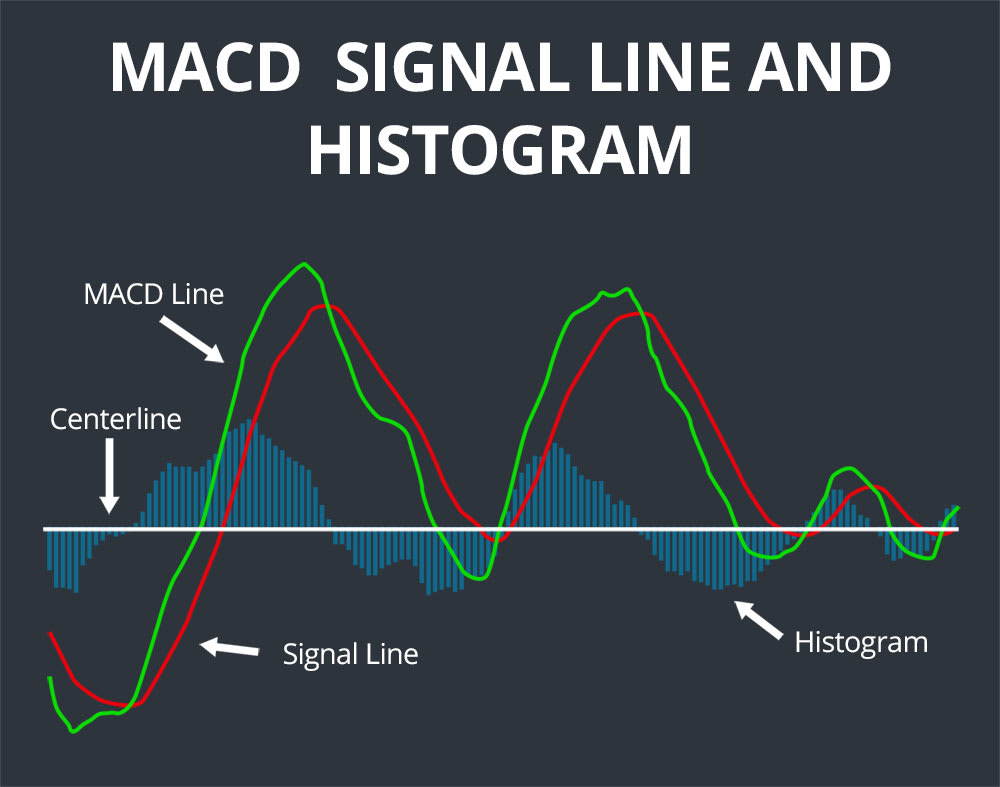
In addition, the 9-day exponential moving average of the MACD itself – known as the signal line – is frequently plotted on the same chart. The chart usually features a histogram as well, which represents the difference between the MACD and the signal line.
To summarize:
MACD Line = 12-day EMA – 26-day EMA
Signal Line = 9-day EMA of MACD Line
(+) MACD when MACD Line > 0
(-) MACD when MACD Line < 0
Histogram plot: MACD – Signal Line
While these are the standard lengths and types of moving averages used in calculation of the MACD, it is entirely possible to substitute in longer- or shorter-term moving averages or to use a simple or weighted moving average rather than an exponential moving average. However, note that doing so may change the interpretation of the MACD with respect to short-term momentum.
How to Trade with MACD
The MACD is relatively straightforward to interpret. When the MACD is positive, it indicates that a stock’s price is trending upwards and it has or is gaining short-term momentum. When the MACD is negative, the price is trending downwards and it is gaining short-term momentum in the negative direction.
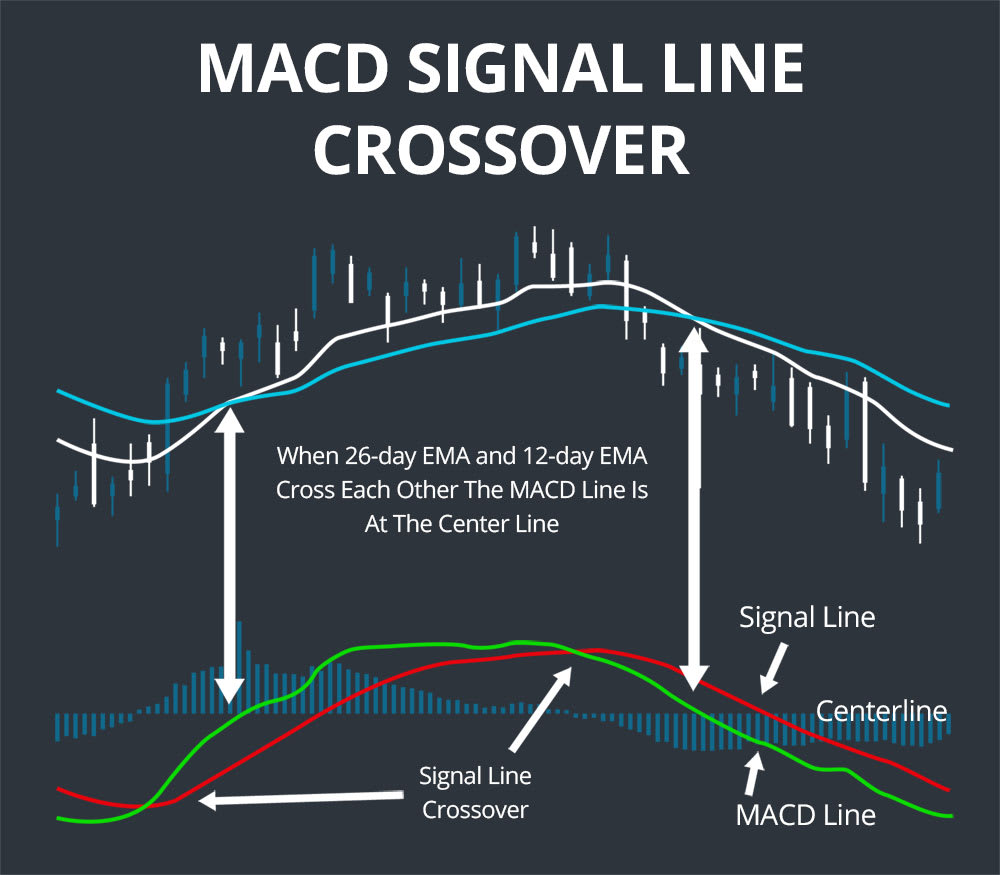
When the 12-day and 26-day exponential moving averages converge on a single price, signaling a lack of momentum in either price direction, the MACD line will approach zero and sit close to the centerline of the chart. The further the MACD line is in either direction above or below the signal line – that is, the more divergent the two exponential moving averages – the more short-term momentum the stock price should be considered to have.
With this in mind, the MACD can be used as an indicator for momentum trading. If there is strong divergence between the two exponential moving averages, the stock price has momentum that will take some time to wear off. An inflection in the slope of the MACD can also indicate when that wearing off begins, signaling that it might be time to exit a position. Although the MACD chart does not have upper or lower limits, it is relatively easy and informative to look back at historical MACD data for a particular equity to get an idea of what a highly positive or negative MACD is for that equity.
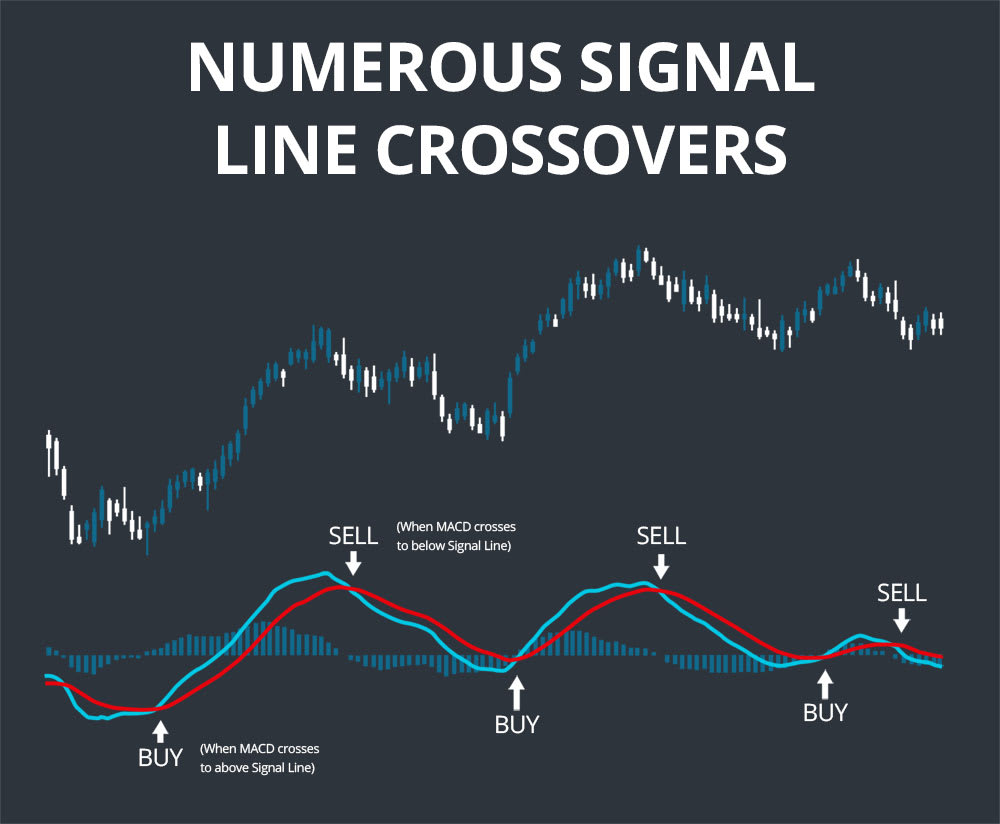
Signal Line Crossover
When the MACD line crosses above or below the signal line, known as a crossover, the histogram on the chart will also shift from negative to positive or vice versa. This is a common signal of the MACD and indicates that the MACD – and thus a stock’s price momentum – is shifting, since the signal line should lag behind changes in the MACD line. Crossovers can last a few days or a few weeks and should be traded on cautiously, especially if the stock in question features a lot of price volatility. However, crossovers can be a more rigorous way to identify weakening or strengthening momentum than simply looking for inflection points in the MACD line.
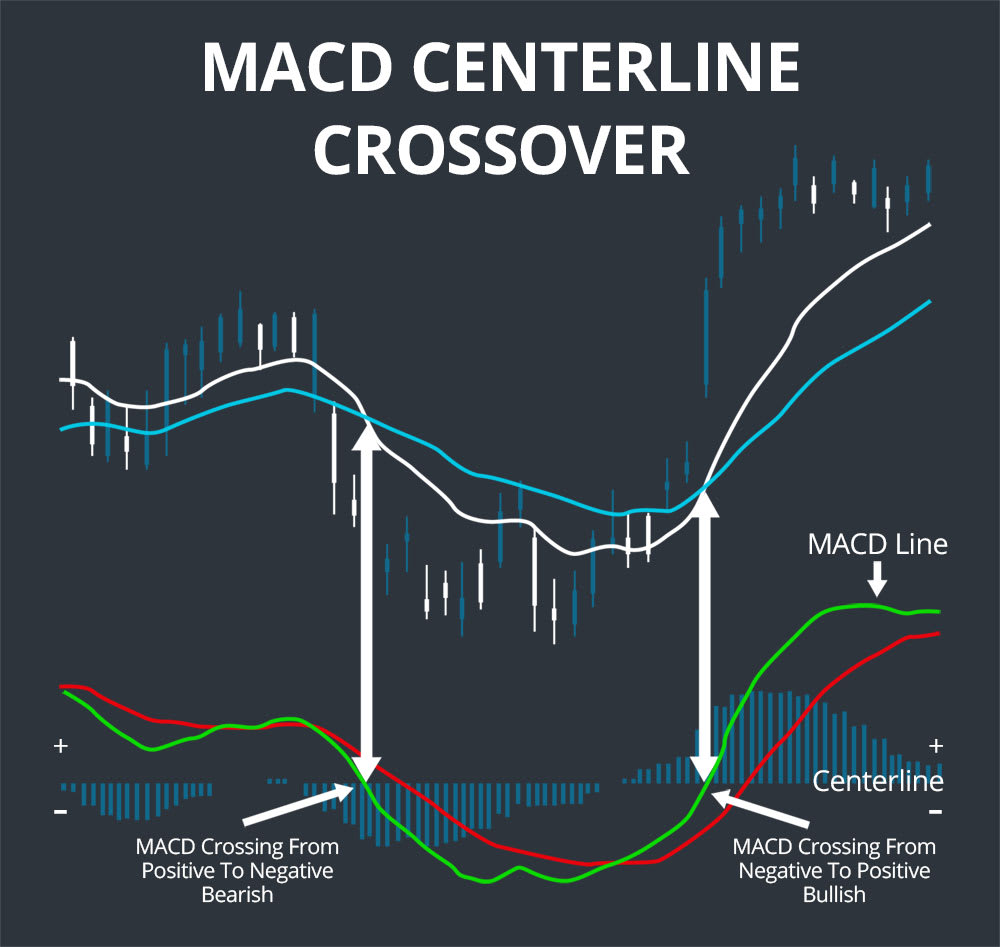
Centerline Crossover
A crossover of the centerline can be analyzed similarly, but without the consideration of short-term momentum provided by the lagging signal line. The MACD crossing from negative to positive territory indicates that a stock’s price is gaining momentum in the upward direction, while the opposite crossover indicates that the price is gaining downside momentum.
Divergence
Divergence between the stock price and the MACD can also be informative as a way to determine whether momentum is wearing off or building. For example, consider a stock with a falling price and an MACD that is growing more negative, indicating downside momentum. The stock price may continue to push lower while the MACD line inflects and begins to push upwards towards zero, thus indicating that the downside momentum is decreasing even though the stock price has not yet exhibited positive gains. The same divergence indication can be applied to a stock that is gaining in price but losing upside momentum.
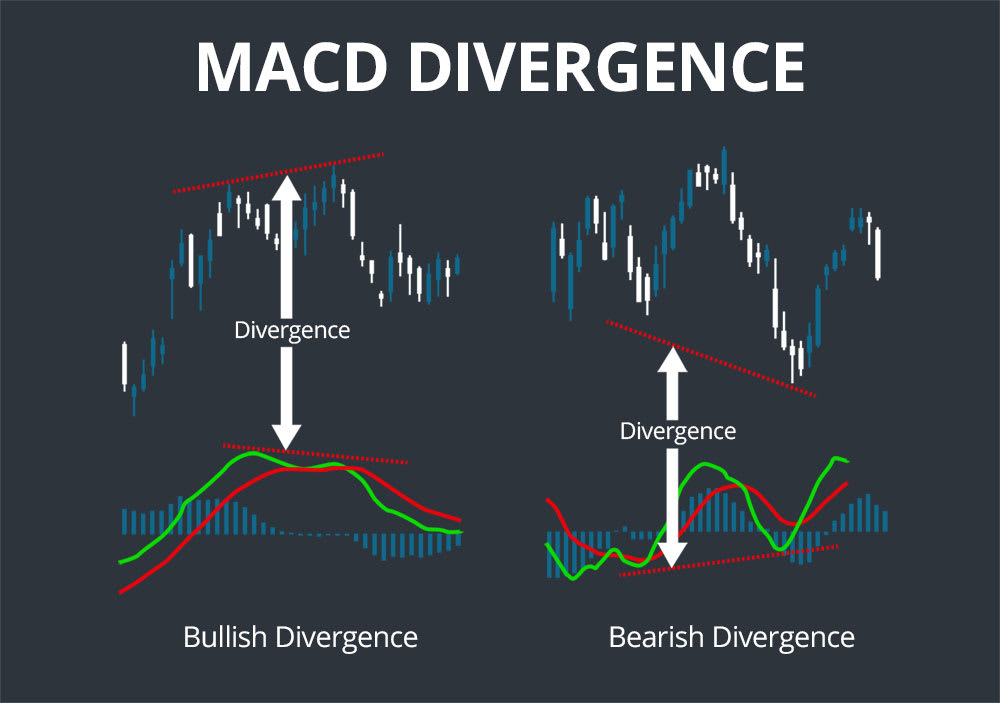
However, it is important again to interpret divergences cautiously since many price movements, both gains and losses, involve a large initial price action followed by a long tail. While this would cause a divergence when looking at MACD, the price action will continue in its current direction until the MACD line gets much closer to zero.
Indicator Comparison
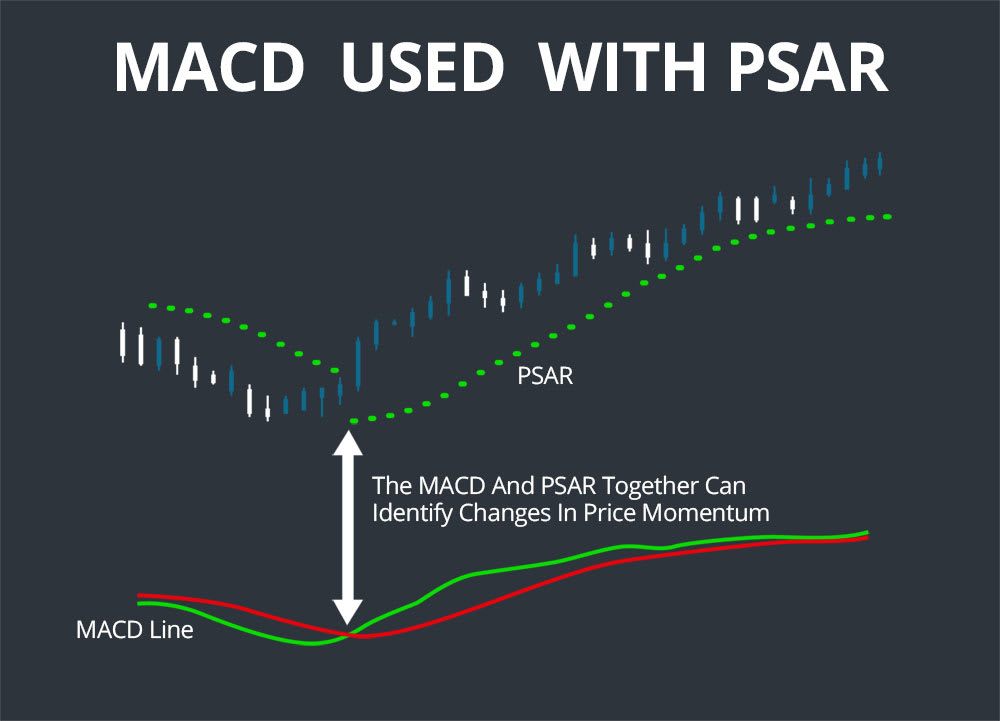
The MACD is most related to, and often used in conjunction with, the parabolic stop and reverse (PSAR) indicator. However, whereas the MACD relies on exponential moving averages to indicate short-term momentum, the PSAR uses a multiplicative factor to visually indicate when a price trend is about to flip. Swing traders often use the MACD and PSAR together to identify stocks that are experiencing changes in price momentum.
Examples
In this first example, numerous signal line crossovers in the MACD correspond with significant upswings and downswings in the stock price. These crossovers can be used as entrance and exit points for swing trades.
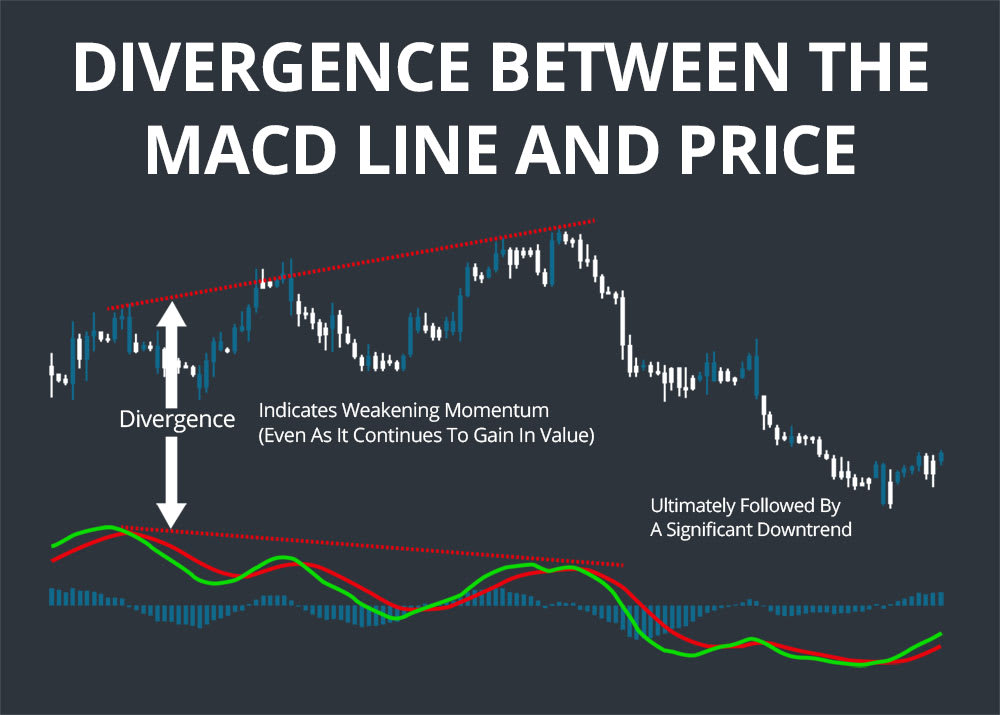
Another example shows divergence between the MACD line and the stock price. In this case, the divergence indicates weakening momentum in the price rise of the stock, even as it continues to gain in value. This divergence is ultimately followed by a significant downtrend several weeks later.
Conclusion
The MACD can be a powerful momentum indicator for making swing trades. The indicator can allow day traders to identify entry and exit points based on a longer-term MACD crossing over a shorter-term MACD, or it can be used to predict changes in price trends of stocks before the price itself reacts.