What is a Technical Indicator?
A technical indicator is a visual tool added onto price charts that help illustrate various aspects of the price action of the underlying stocks. Technical indicators usually pertain to the direction, price action or the momentum of price action. They are usually calculated using various data points relating to time, volume and price. Factors like velocity are a measure of both time and price, whereas moving averages measure mostly price based on a specified time period. Technical indicators are used to interpret and forecast potential price action.
Types of Technical Indicators
There are two types technical indicators used to augment charts, overlays and separate indicators that use a separate window on the chart.
Overlay indicators are placed right on the price portion of the chart (candlesticks, bar, line). By overlaying them, the indicators become aligned with the stock price and provide more accuracy and convenience. These indicators scale and fit to the price chart providing key information like visual trend direction, trading range and support/resistance levels. Examples of overlays include moving averages, pivot points and Bollinger bands.
Independent indicators that aren’t usually overlaid are displayed in a separate portion of the chart window away from the price charts. They indicators are easier to follow and interpret on their own, without the distraction of attempting to overlap them on top of a price chart. These include momentum indicators like stochastic, MACD, RSI and money flow index (MFI).

Goals of Using Technical Indicators
Technical indicators are used to better identify key price levels like support and resistance or nominal trading ranges with Bollinger Bands. Indicators like moving averages also smooth out the price action and momentum indicators like the MACD, stochastic and RSI determine when the price action is overbought or oversold.
Common Technical Indicators
These are the more commonly used indicators by traders and found on most charting and trading platforms.
Moving Averages provide a visual illustration of the trend, as well as support/resistance and trading channel when using two simultaneously. The simple moving average value is calculated and plotted by connecting the rolling average closing prices by specific period of time. Weighted moving averages factor in volume in addition to time and price thereby placing more weight on the most recent closing prices. Exponential moving averages are a form of weighted moving averages that will give a quicker ‘heads up’ on reversals but are prone to more headfakes due to less smoothing.
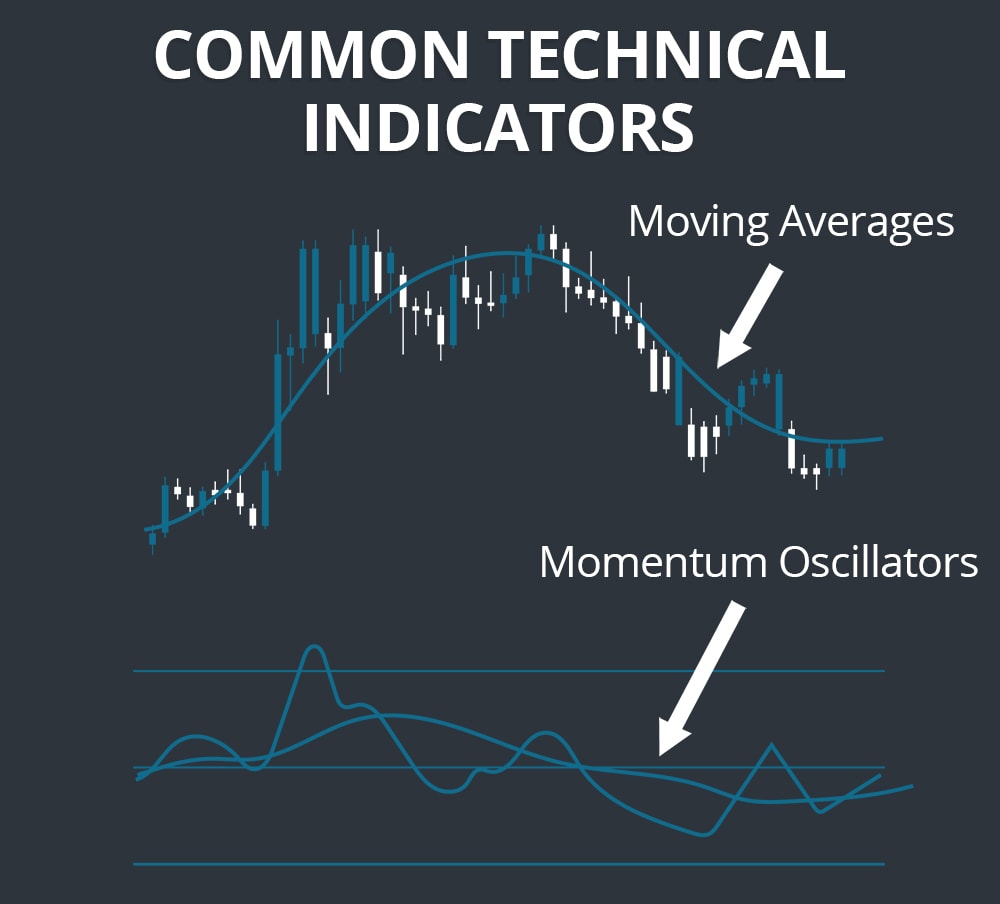
Momentum Oscillators are separate indicators attached to the price chart that illustrate when the price is becoming overbought or oversold. This is not a valuation indicator, but a momentum indicator that tells you when the velocity of the move is peaking or bottoming out. Traders can time their long entries when oversold conditions start to rebound or sell when overbought conditions form. The relative strength index (RSI) and stochastic are used very similarly. RSI above 70 bands are overbought and fewer than 30 bands are oversold. Stochastic oscillators are considered overbought above the 80 bands and oversold below the 20 bands. Buy triggers tend to form when the oscillators re-pierce the lower bands up and sell/short signals when they pierce the bands back down. MACD functions in the same manner with the 30/70 crossovers but can also be illustrated in the form of a histogram.
How to Apply Technical Indicators to Your Trading
Application of the technical indictors you select to use takes time and familiarity. It is always best to start off with just one or two indicators, preferably a price indicator and a momentum indicator. Observe the relationship between the price and momentum indicator and learn firsthand where the nuances and inconsistencies form.
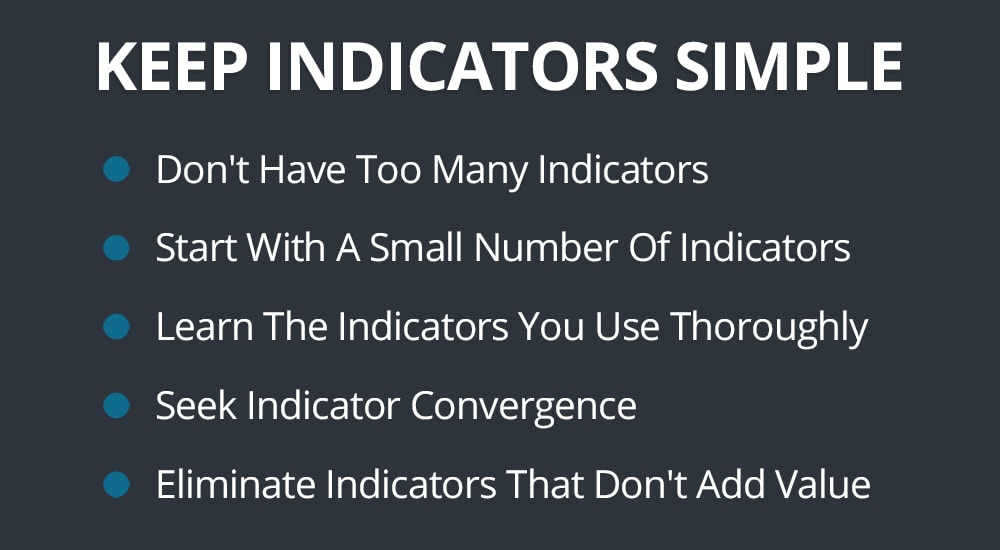
Rule #1 – Keep it Simple
It’s easy to fall into the indicator overload mode where you have so many indicators that the interpretation gets bogged down or contradictory. Bottom line, start with the least indicators but learn them thoroughly. The goal is to find convergence with the indicators so that you decision making is quick, accurate and efficient. Indicators should enable, not restrict your decisions.
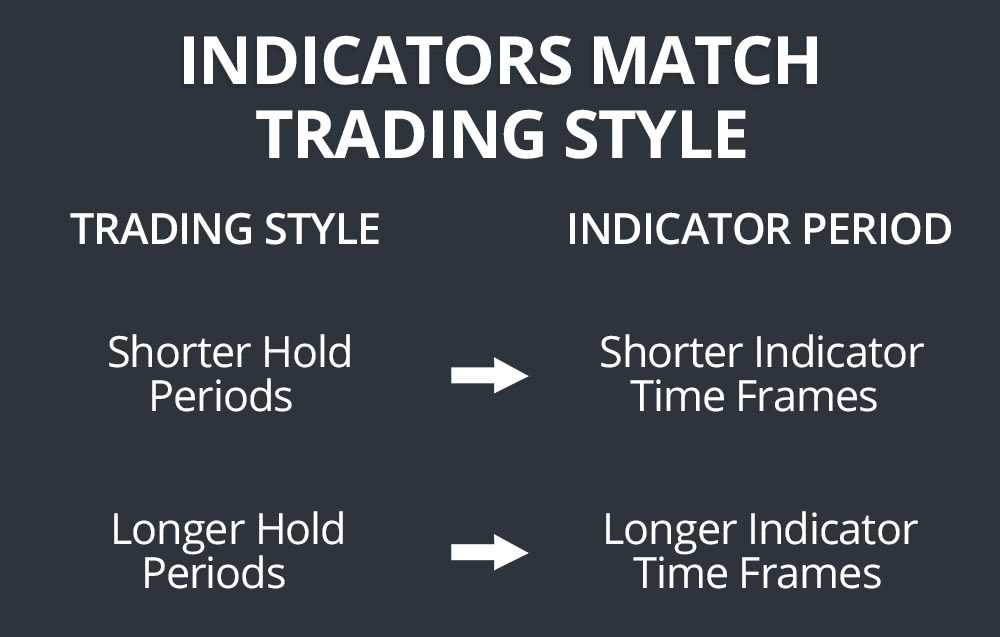
Rule #2 – Apply Indicators To Your Style
If you have an affinity for fast action and smaller holding periods, then consider intra-day trading indicators on a smaller time frame. For example, a 5 and 15-period moving average provides accurate intra-day trends along with a stochastic oscillator on a 5-minute chart. However, a swing trader may prefer to use a 50-period and 200-period moving average on a daily chart to determine the larger overall trend. It’s a matter of capital, time allocation and temperance. Determine your style and apply indicators that accommodate it.
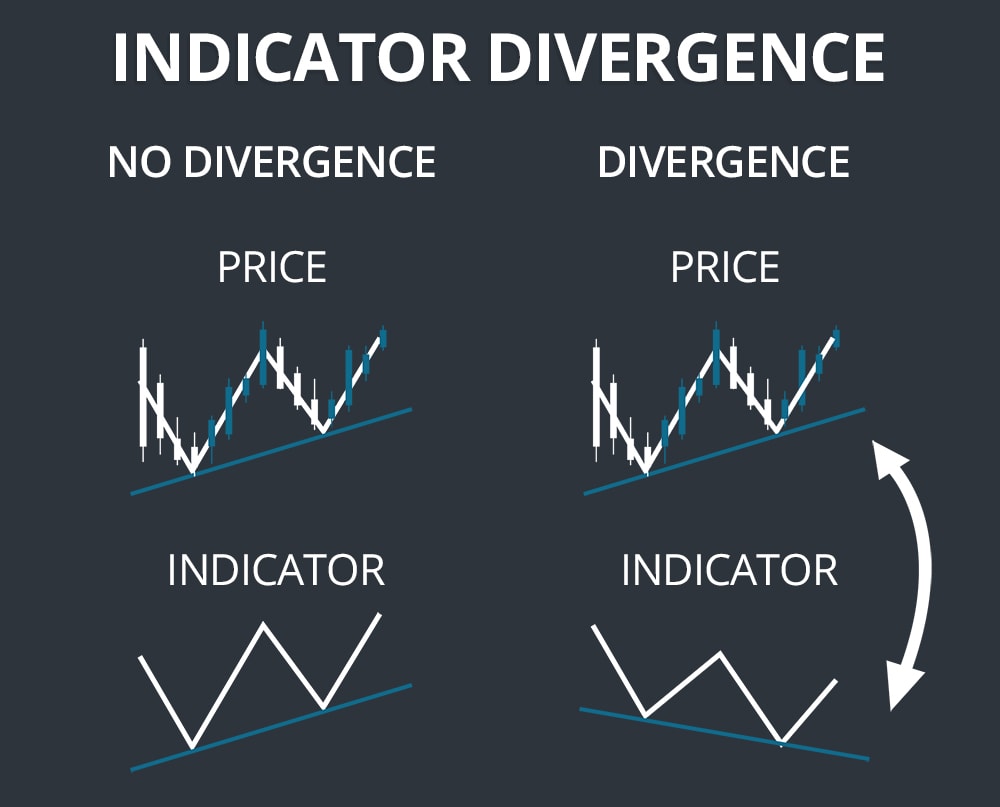
Rule #3 – When in Doubt, Get Out
If your indicators start contradicting or diverging during a trade, keep precautionary stops and watch how it resolves from the sidelines. Being in the eye of the storm (a position) compared to spectating are two different contexts altogether. Familiarity breeds confidence so don’t be in a rush to jump headfirst into trades without first getting familiar with the indicators.
Related Reading:
Ready to start scanning? Try for free and choose the plan that fits your workflow.