Bollinger Bands
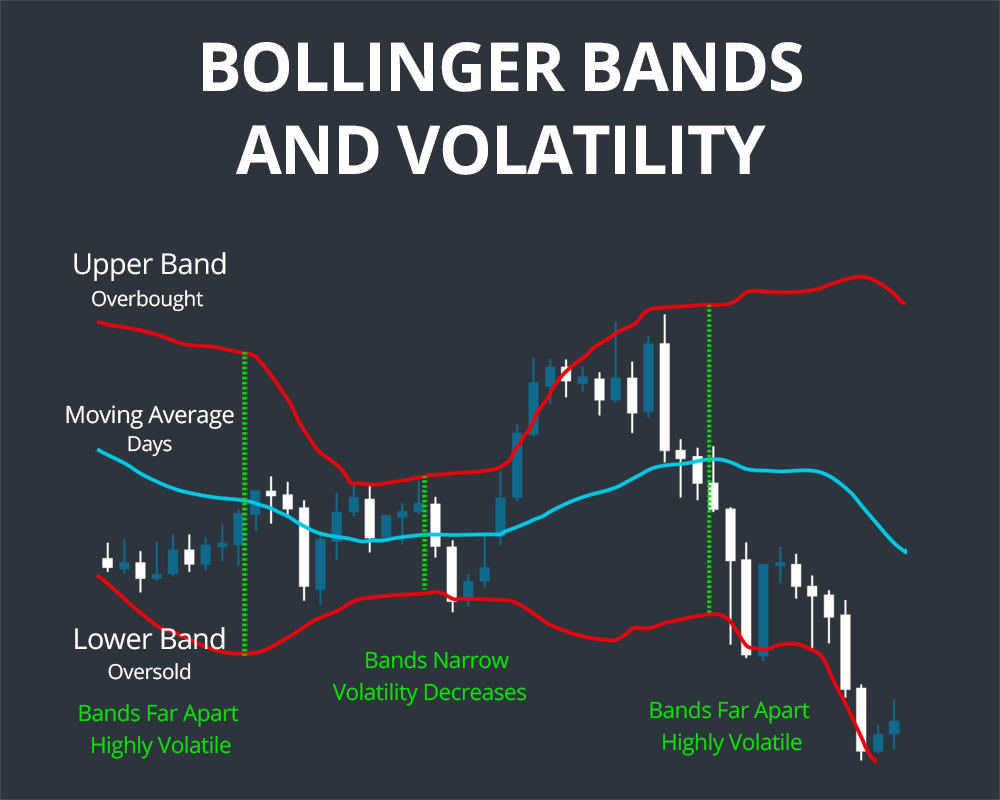
Bollinger Bands, developed by financial analyst John Bollinger, are a technical indicator that account for volatility to indicate when a stock is overbought or oversold. Bollinger Bands describe lines corresponding to twice the standard deviation of the 20-day simple moving average of a stock’s price, such that the bands are farther apart as volatility increases and close together as volatility decreases. This indicator is a favorite among traders since it has many built-in signals and works well with other technical indicators like the MACD.
Bollinger Bands Type of Indicator
Bollinger Bands are above all else an indicator of volatility. When the price of a security is highly volatile, the upper and lower bands will be far apart from one another, while the bands will narrow as price volatility decreases. In addition, many traders use Bollinger Bands to identify overbought and oversold conditions in the market. In this case, when the price approaches the upper band the stock is thought to be overbought, while when the price approaches the lower band it is thought to be oversold.
Calculating Bollinger Bands
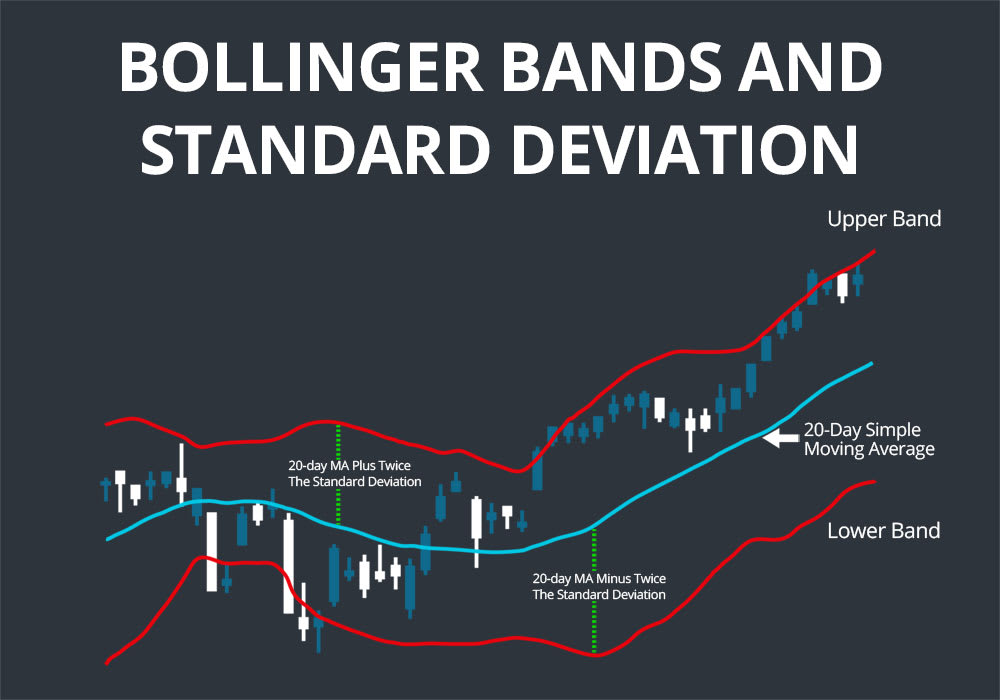
Bollinger Bands are straightforward to calculate, as they are simply twice the standard deviation from the 20-day simple moving average. Thus, if you calculate the 20-day simple moving average, the upper band is that average plus twice the standard deviation of the stock price over that same time period, while the lower band is the average minus twice the standard deviation.
The use of the standard deviation of the price as the defining variable in calculating Bollinger Bands is what allows them to serve as an indicator of volatility. Note that while Bollinger Bands are traditionally calculated from the 20-day simple moving average, there is no reason that the time period or calculation of the moving average, or even the multiplicative number of standard deviations away from the moving average used in the bands’ calculation, cannot be modified. Bollinger recommends increasing the multiplier to 2.1 when using a 50-day moving average and decreasing it to 1.9 when using a 10-day moving average.
How to Trade Using Bollinger Bands
Bollinger Bands can be excellent indicators, although without consulting other technical indicators they are not in themselves the best at signaling potential trades.
As discussed before, many traders consider a stock to be overbought when the price approaches the upper band and oversold when the price approaches the lower band. However, there is no trading signal inherent in this interpretation and overbought and oversold conditions should be confirmed with RSI.
Squeeze
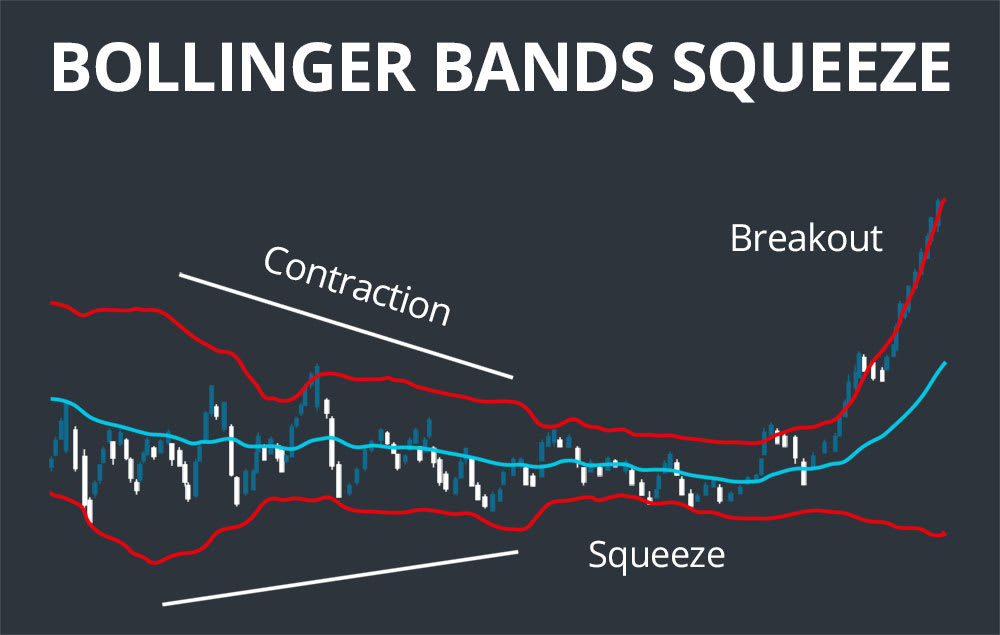
The distance between the bands, which is related to the volatility in a stock’s price over the previous 20 days, can also be informative but not conclusive on its own. When volatility decreases and the bands get close together – known as a squeeze, since they are “squeezing” the 20-day simple moving average line – this is considered to indicate that volatility will increase in the future. Conversely, when the bands move far apart as volatility increases, it is expected that volatility will decrease into the future. However, there is no time constraint on when the change in volatility may occur from Bollinger Bands alone.
Breakouts and Walking the Bands
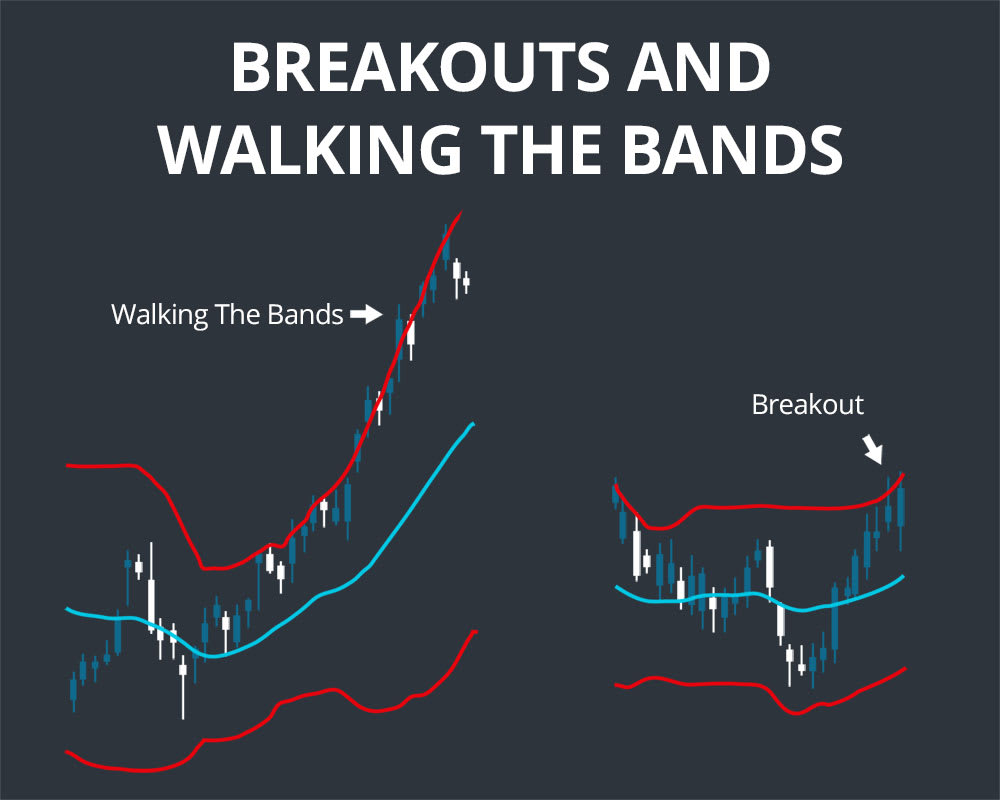
Breakouts above or below the Bollinger Bands are important events for a stock, since approximately 90% of price movements should occur between the bands. However, Bollinger Bands alone do not provide information about whether a breakout will lead to a positive or negative price shift, and thus should not be considered a signal in the absence of other technical indicators.
In cases when a stock is moving strongly bullishly or bearishly, the price can also “walk the bands” – that is, repeatedly touch or mildly break either the upper or lower band. In the case of walking the upper band, this is typically a sign of strength since it takes significant strength to continue to push this resistance level, even if in other conditions the stock would be considered overbought. The converse is true for walking the lower band. In this case, it is important to check other indicators, especially the RSI, to identify when buying and selling opportunities will occur as the stock price repeatedly rebounds off of one of the bands.
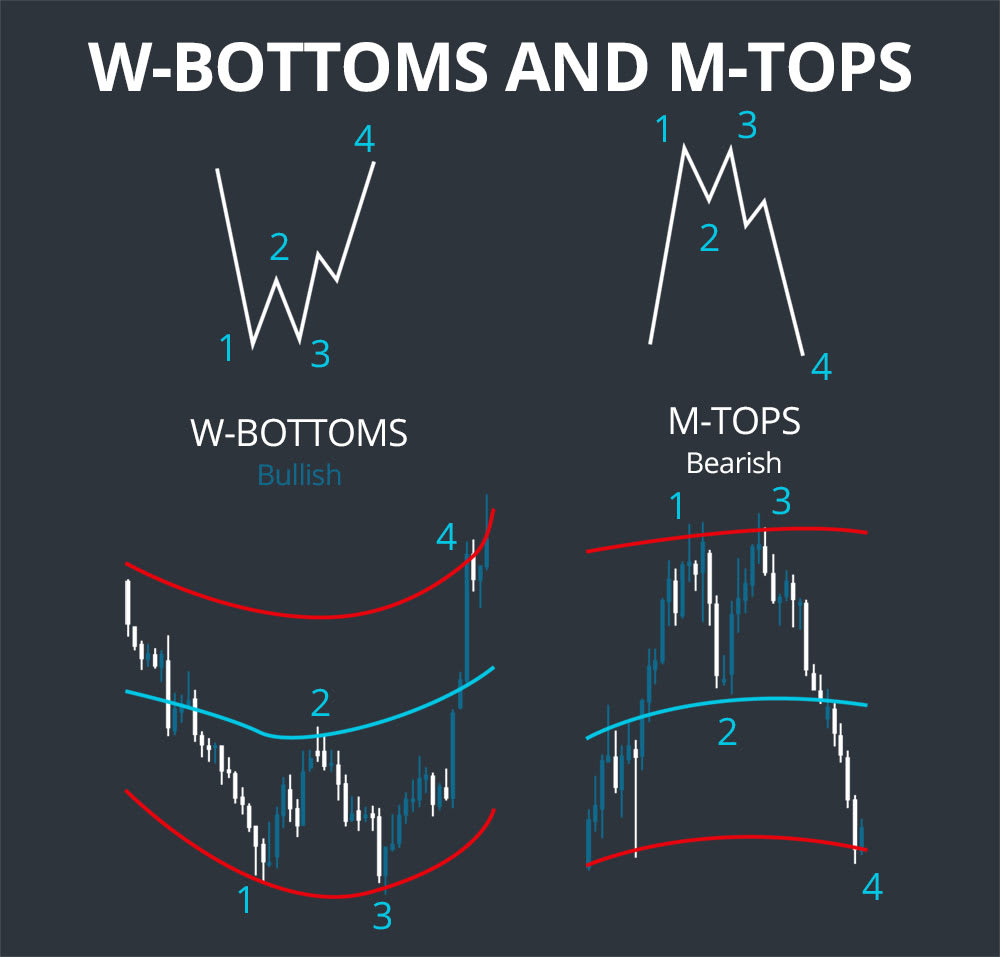
W-Bottoms and M-Tops
A bullish W-bottom is considered to have formed when four consecutive steps occur. First, a stock’s momentum shifts and the price drops to near or often below the lower Bollinger Band. Second, the stock price rebounds to approximately the price of the 20-day simple moving average. Third, the price drops to a lower low, but remains above the lower Bollinger Band this time. Finally, the price should bounce up and then experience a positive breakout once it passes the previous high in the W pattern. The breakout can be confirmed with additional indicators, in particular a signal line crossover in the MACD.
The M-top is essentially the bearish converse of the W-bottom. This occurs when a stock’s price breaks above or nearly above the upper Bollinger Band before dropping towards the 20-day simple moving average and then failing to break above the upper Bollinger Band on the subsequent bullish movement. An M-top can similarly be confirmed with a bearish MACD signal line crossover and indicates that the stock price will decline precipitously.
Indicator Comparison
Bollinger Bands are highly similar to Keltner Channels. The two indicators differ primarily in how they calculate volatility bands – Bollinger Bands use the standard deviation of the simple moving average, whereas Keltner Channels use the average true range and an exponential moving average as their centerline. These differences lead Keltner Channels to be smoother than Bollinger Bands since the standard deviation is more volatile than the average true range of a stock’s price. In addition, the exponential moving average is more sensitive to recent price changes than the simple moving average, so Keltner Channels respond to price action more quickly than Bollinger Bands.
Examples
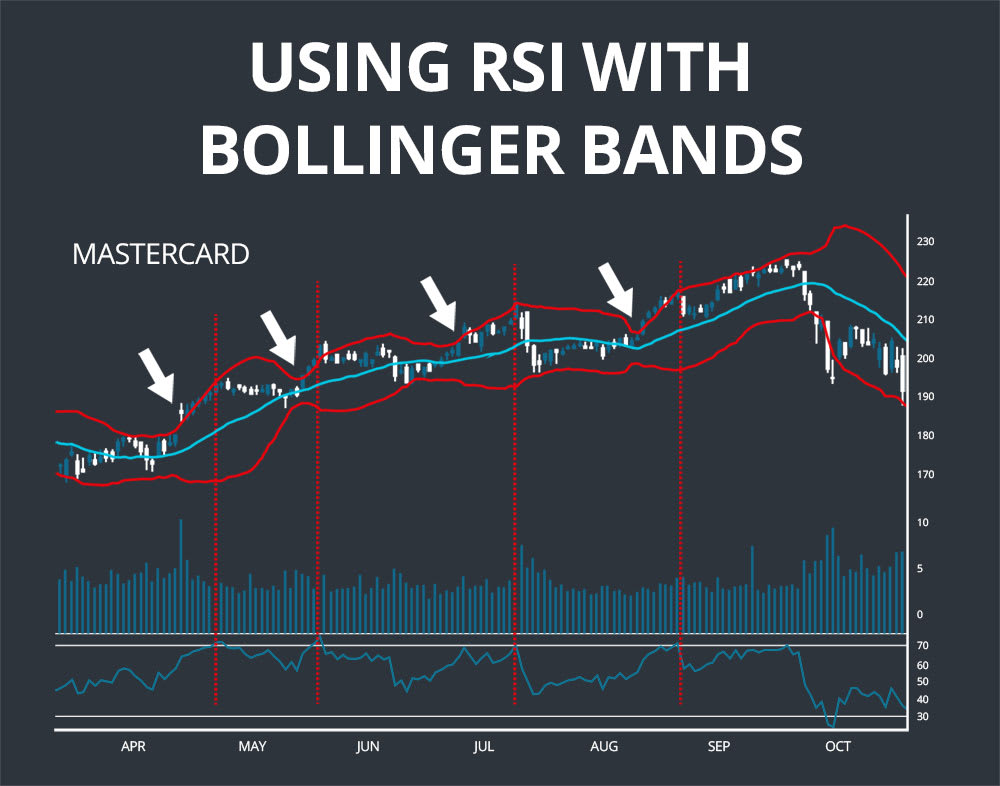
The first example shows how RSI and Bollinger Bands can be used in tandem to identify buying and selling opportunities in a bullishly trending stock. Mastercard is walking the upper Bollinger Band, breaking it repeatedly over the course of a several-month period before falling back towards the simple moving average. While the Bollinger Bands themselves do not give any information about when to consolidate gains, the RSI provides an overbought signal that triggers relatively reliably ahead of a sell-off.
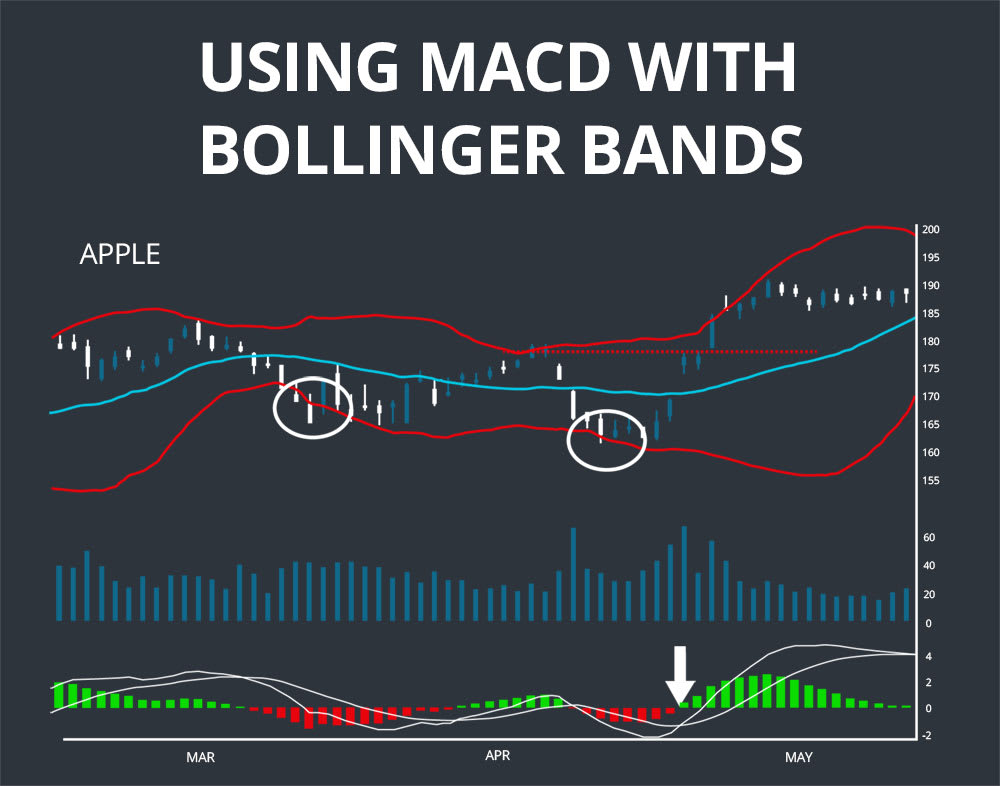
The second example shows a W-bottom. Apple’s stock price drops below the lower Bollinger Band on March 21st before rebounding somewhat strongly. On the second drop, even as the price sets a lower low, the closing price remains above the lower Bollinger Band (only the closing price is important because the Bollinger Bands are calculated with closing prices). The stock breaks out once it surpasses the previous high in the W pattern, and the breakout is confirmed with a bullish signal line crossover in the MACD.
Conclusion
Bollinger Bands are a popular technical indicator for evaluating volatility. Although Bollinger Bands only provide trading signals on their own in very specific cases such as W-Bottoms and M-Tops, they can be paired with other indicators such as the RSI and MACD to enhance more widely applicable trading strategies.