What is the Relative Strength Index (RSI)?
The relative strength index (RSI) is a straightforward indicator for identifying when an equity has been overbought or oversold following recent price actions. The RSI is widely used by traders for its ease of interpretation in determining whether a stock is a value or overpriced given the equity’s recent trading history.
Type of Indicator
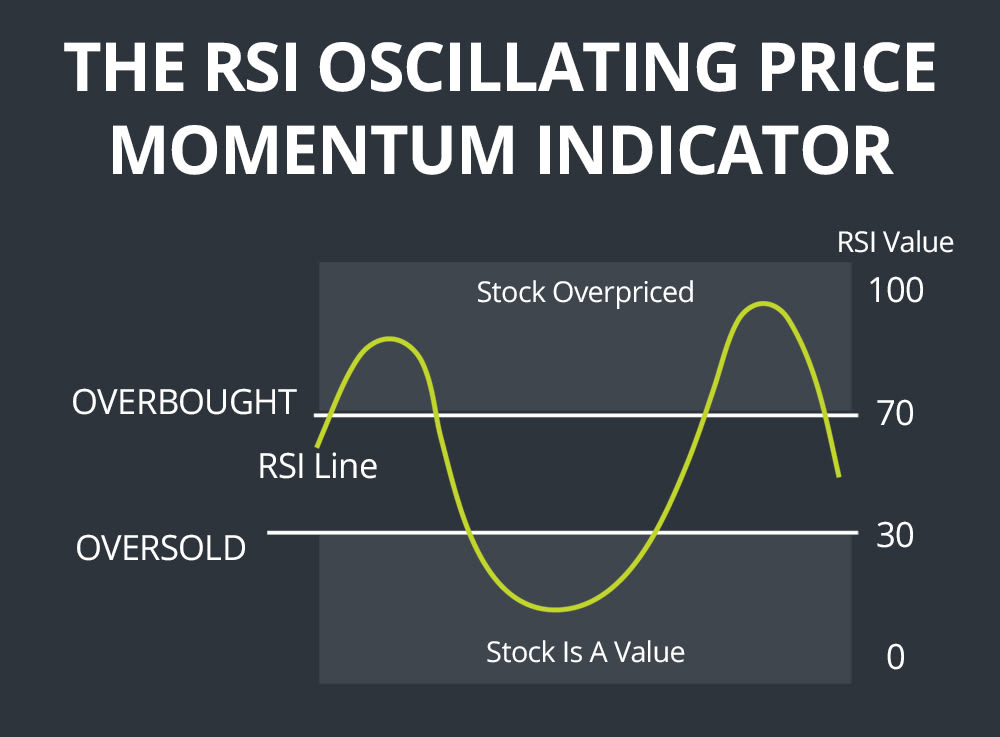
The RSI is an oscillating price momentum indicator that moves between values of 0 and 100. Values of 30 or below are typically considered to indicate that a stock is oversold and priced below its worth based on recent price movements, while values of 70 or above are considered to indicate that a stock is overbought and priced too high relative to its recent price action.
RSI Calculation
The relative strength index is calculated as:
RSI = 100 – 100/(1+RS), where RS is the average gain of periods of gain divided by the average loss of periods of loss during a specified timeframe.
This essentially pits a stock’s upward momentum against its downward momentum to identify whether the current momentum is out of character with recent movements. For most RSI calculations, the timeframe specified is 14 days, although this can be shortened or lengthened with significant effects on the RSI calculated.
How to Trade with RSI
Overbought and Oversold Conditions
In general, a stock is considered to be overbought when its RSI is above 70, indicating that it is priced too high and may be due for a swing towards declining price. A stock is considered to be oversold when its RSI falls below 30, indicating that it is priced too low and may be shifting momentum towards an upward movement.
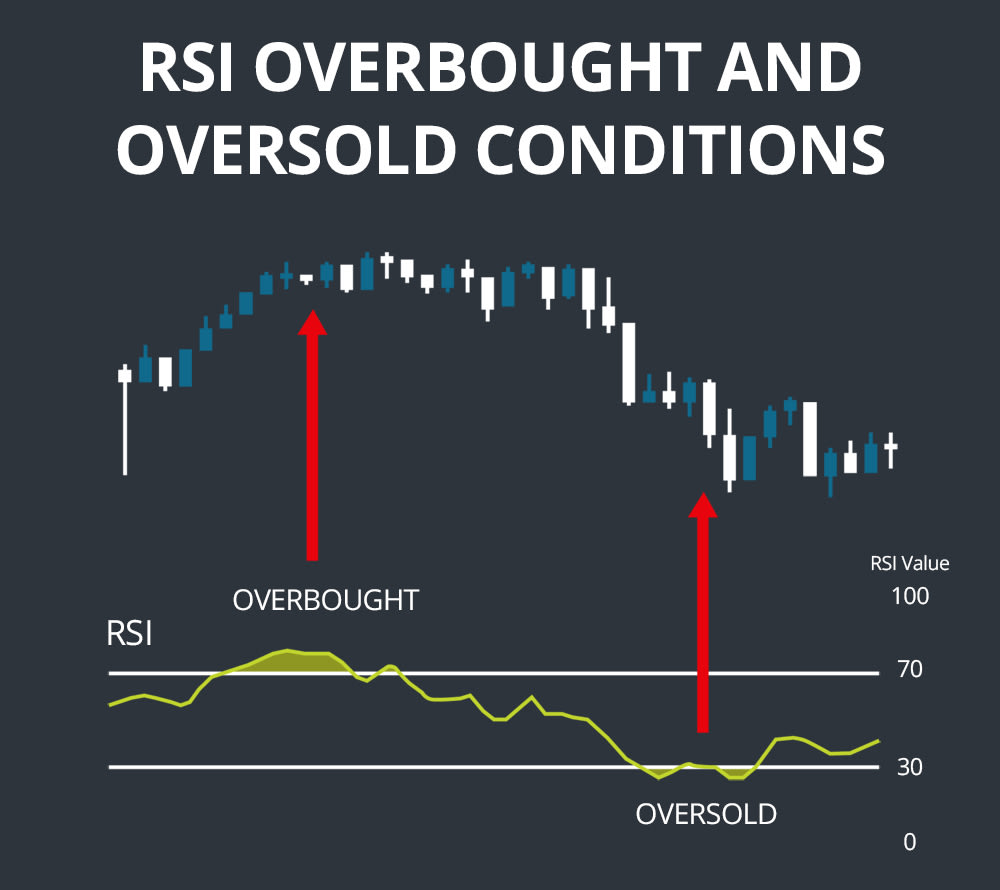
However, the RSI is best used in combination with other indicators to determine whether momentum shifts are likely since sudden large price movements can push the RSI above 70 or below 30. Thus, RSI works best as an indicator when a price moves sideways within a range and with relatively low volatility. It is also possible to define overbought and oversold conditions at more extreme levels, such as 80 and 20, to avoid false signals.
Divergence
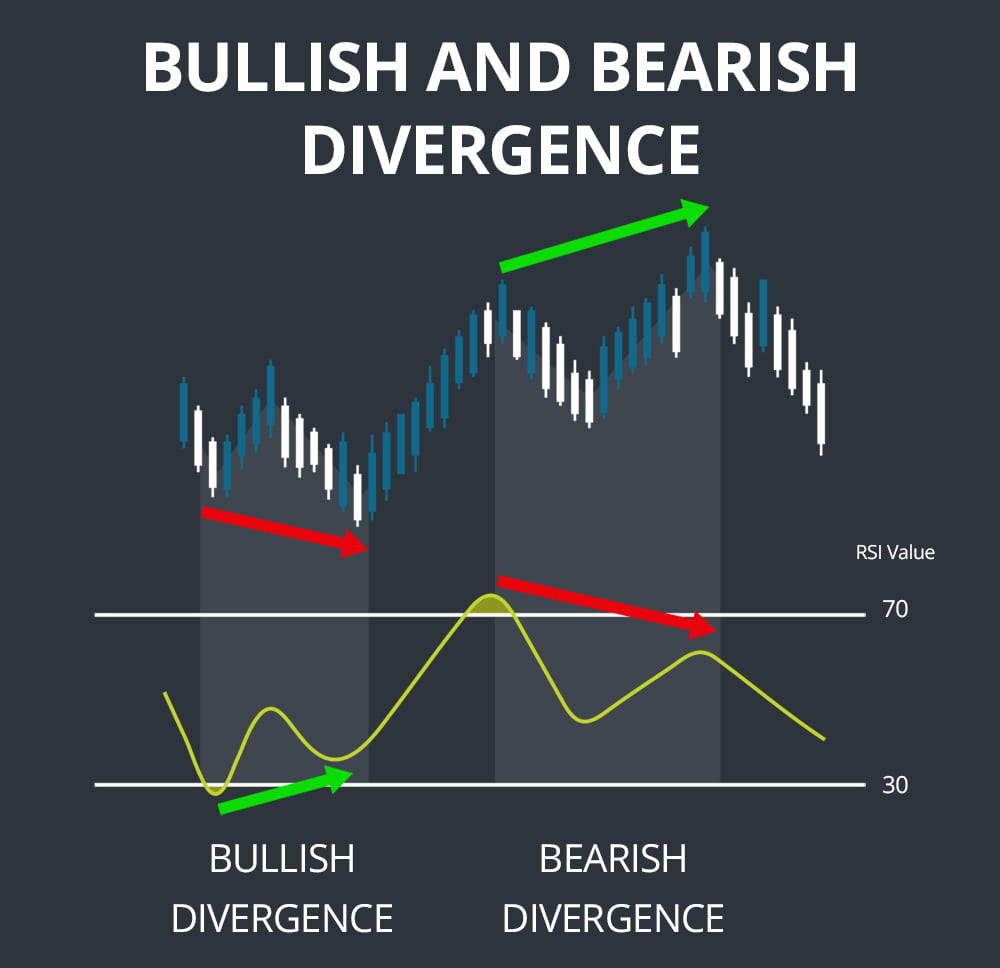
Divergences between movements in stock price and RSI can also be informative. When a stock’s price is falling and setting lower lows, while the RSI slowly climbs and sets higher lows, this is considered a bullish divergence and indicates that the downward momentum of the stock price may be weakening. The reverse is true when a stock price is climbing and setting higher highs, while the RSI slowly falls. However, note that divergences can be misleading during a strong trend and should be analyzed in conjunction with other momentum indicators.
Failure Swings
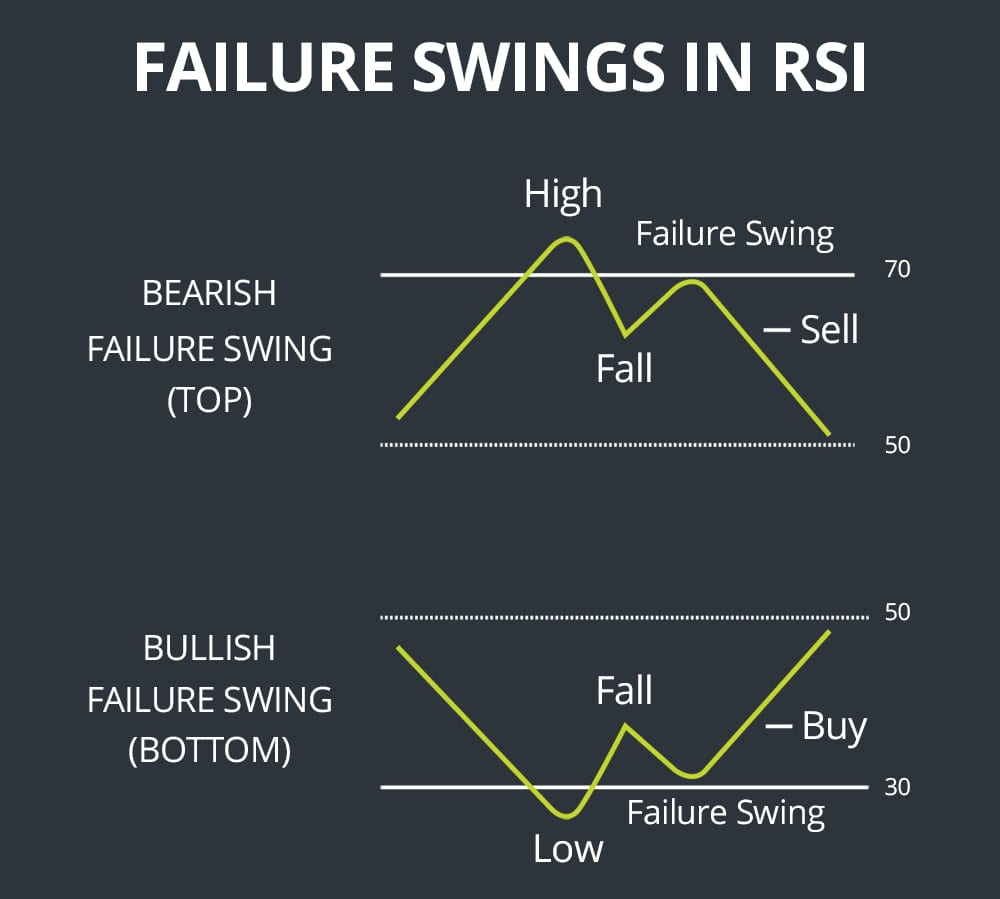
Failure swings are a pattern in the RSI itself, independent of price action, that can be used to identify when a reversal is likely to occur. A bullish failure swing occurs when the RSI drops just below 30 briefly and then bounces, before falling back down to hold just above 30. If the RSI bounces again and breaks its prior high, a failure swing is said to have occur and should predict a significant price movement. A bearish failure swing follows the opposite pattern around an RSI of 70, with the RSI bouncing below its previous low indicating a failure swing.
Potential Trading Strategies
There are two common trading strategies that incorporate the RSI with each of two other popular indicators – the moving average convergence divergence (MACD) and moving average crossover.
For either combination of indicators, a bullish signal is triggered when the RSI falls below 30, indicating oversold conditions, and a bullish crossover is identified in the other indicator. For the MACD, this means that a bullish signal line crossover occurs simultaneously or soon after the RSI falls below 30. For moving averages, this means that a shorter-term moving average crosses above a longer-term moving average coincident with the RSI below 30.
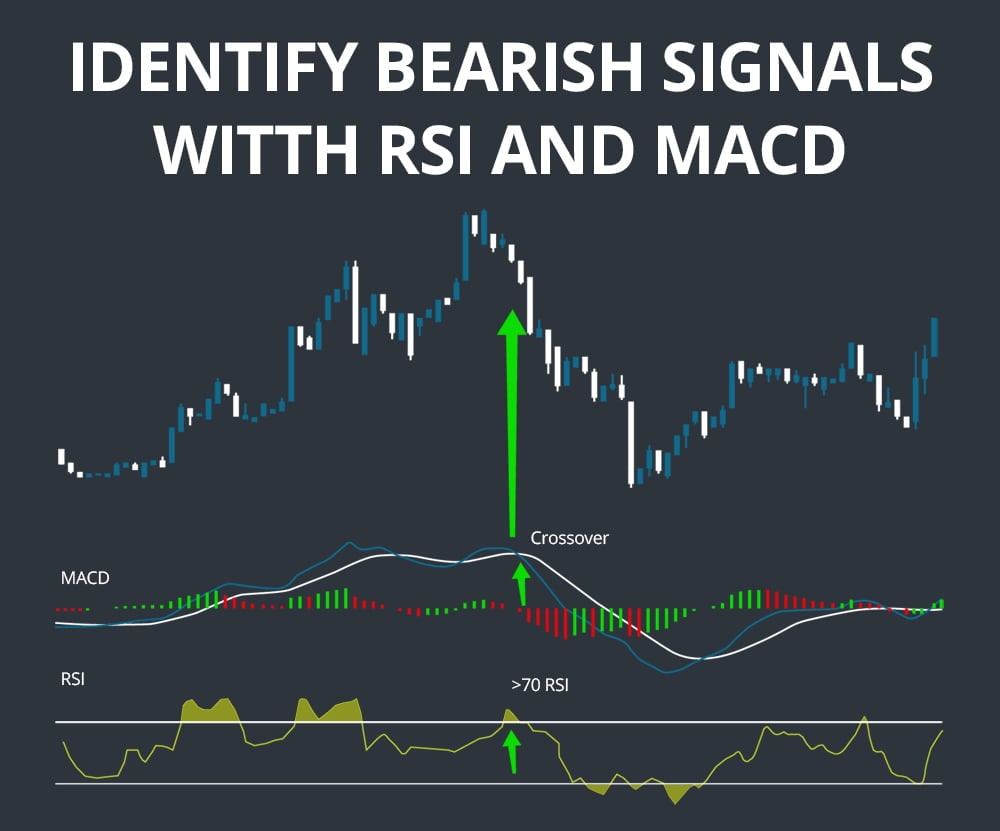
The RSI can also be used in combination with these indicators to identify bearish signals when the RSI is above 70 and a bearish crossover is observed in either the MACD or moving averages.
Indicator Comparison
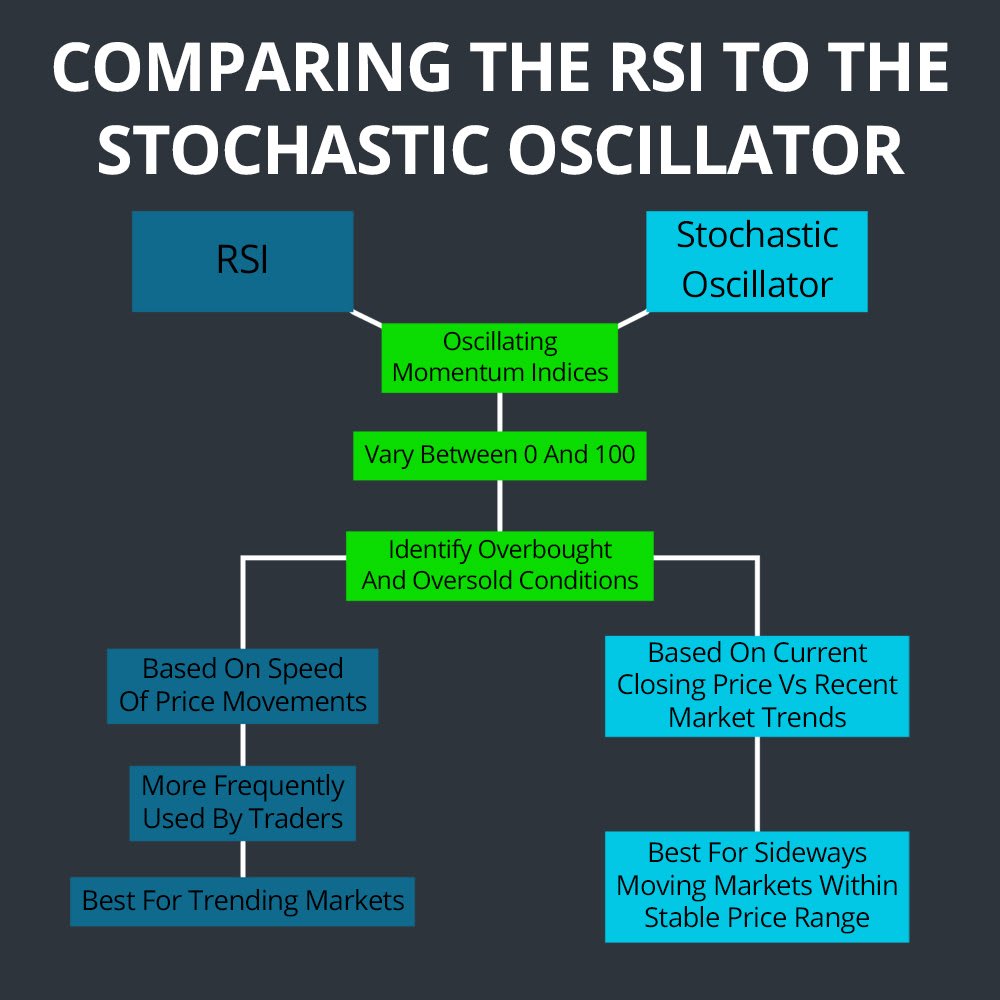
The RSI is somewhat similar to the stochastic oscillator in that both indicators are oscillating momentum indices that vary between 0 and 100 and that are used to identify overbought and oversold conditions. However, the underlying calculations of the two indicators are somewhat divergent. RSI is based on the speed of price movements and offers a single number. The stochastic oscillator, on the other hand, looks at current closing prices in relation to recent market trends based on the idea that an upward-trending stock will close near its recent highs and vice versa for a downward-trending stock. The RSI is more frequently used by traders and is best for trending markets, while the stochastic oscillator is best for sideways-moving markets trading within a stable price range.
Examples
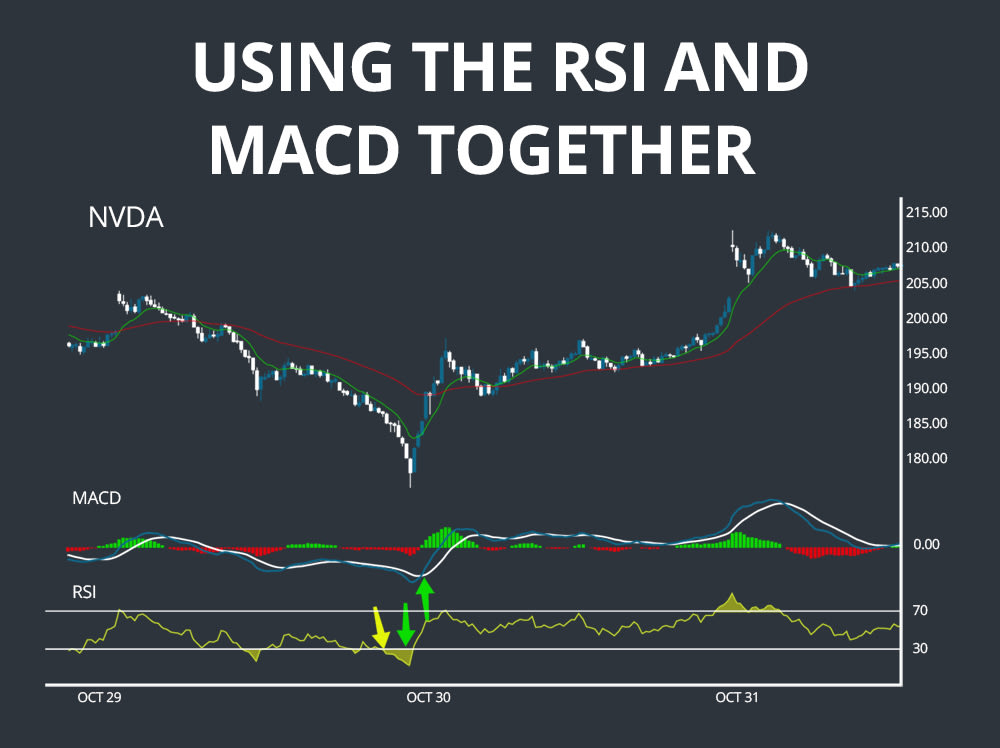
The first example shows the power of using the RSI and MACD together. The sharp price increase follows a period of oversold RSI and the bulk of the increase comes after the bullish signal line crossover in the MACD. In this case, trading on an RSI below 30 alone would have entailed holding through the drop and subsequent price increase to profit from the movement.
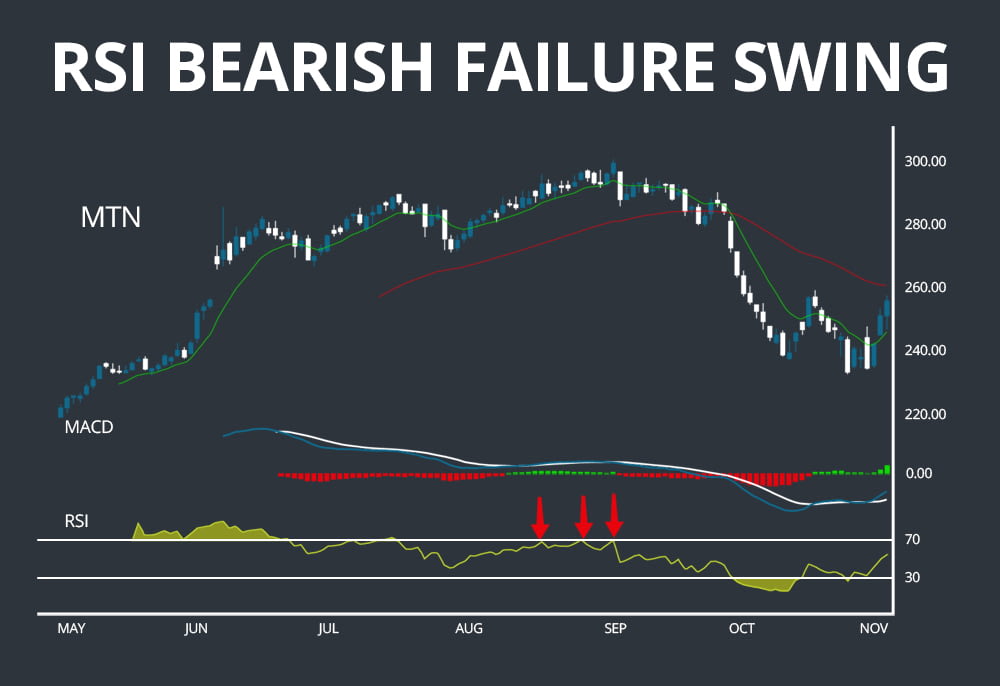
The second example shows a bearish failure swing. The RSI tests overbought conditions three times before setting a new low, after which point it drops sharply all the way to oversold conditions coincident with a significant reversal in price movement. Note that this reversal was poorly predicted by MACD and the failure swing identifies the swing in momentum long before a moving average crossover occurs.
Conclusion
The RSI is a powerful momentum oscillator for identifying when a stock has been overbought or oversold relative to recent price trends. In comparison to similar oscillators like the stochastics oscillator, the RSI is more widely used by traders and performs better in trending markets. While the RSI on its own can be useful for identifying potential swing trades, it can also be combined with additional indicators such as the MACD and moving average crossover to develop robust buy and sell signals.
Related Reading:
- Best Scans for Momentum Traders
- How to Find Momentum Stocks
- A Comprehensive Guide to Moving Averages
Ready to start scanning? Try for free and choose the plan that fits your workflow.