Stochastics Oscillator
The stochastics oscillator, developed by analyst George Lane in the 1950’s, is a momentum indicator used widely by traders to predict reversals in trending stocks. While the stochastics oscillator can be used similarly to MACD, the stochastics oscillator is calculated fundamentally differently – it compares current price data to the high-low range of a stock’s price over a set timeframe. In addition, the stochastics oscillator is frequently used by traders as a complement to RSI since it can be used to identify overbought and oversold levels.****
Type of Indicator
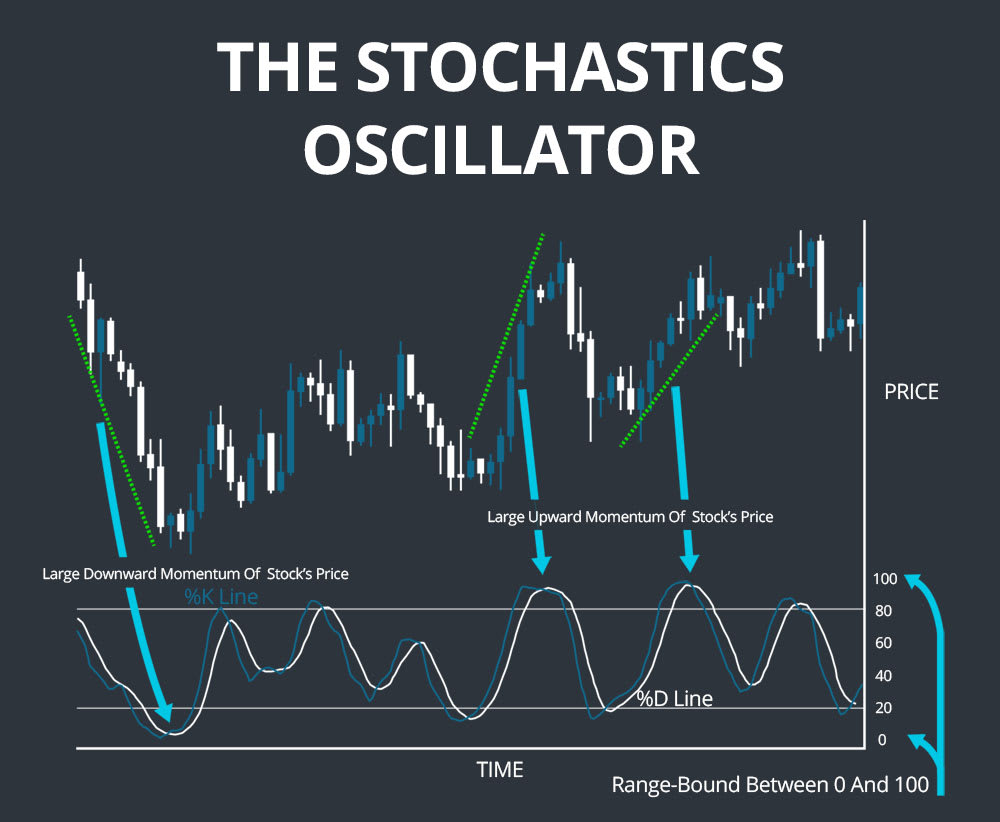
The stochastics oscillator is an oscillating momentum indicator, meaning that it is range-bound between 0 and 100 and tracks changes in the momentum of a stock’s price rather than the price itself. As a momentum indicator, it can be used to predict upcoming reversals in a stock’s price.
Calculating Stochastics
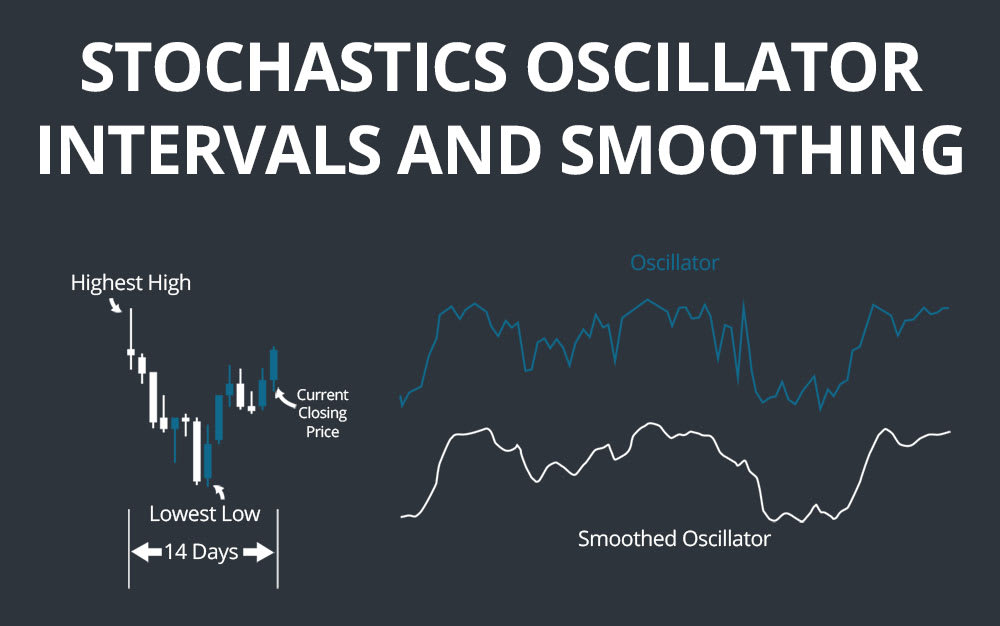
The calculation of the stochastics oscillator depends on the current closing price of a stock as well as its highest high and lowest low over a set time period. Typically, this time period is set to 14 intervals, which can be minutes, days, weeks, or another time frame depending on the time scale a trader is interested in studying. The primary variable calculated from this information, %K, is calculated as the difference between the 14-period low and the current close, divided by the difference between the 14-period high and 14-period low, all multiplied by 100 to yield a percentage. The second variable, %D, is simply a three-day simple moving average of %K. Thus:
%K = 100 * (Current Close – 14-period Low) / (14-period High – 14-period Low)
%D = 3-day simple moving average of %K
In this way, the 14-period high-low range of a stock’s price is the denominator in the calculation of %K, and %K will be above 50 when the stock closes in the upper half of the high-low range and below 50 when it closes in the lower half of the range. %D will respond more slowly to changes in a stock’s price action than will %K.
Note that it is possible to change the time period in the calculation of the stochastic oscillator, as well as to smooth the oscillator by taking an X-period (often a three-period) simple moving average of %K. In the latter case, %D is calculated as a three-day simple moving average of the smoothed %K.
How to Trade with Stochastics
Divergences
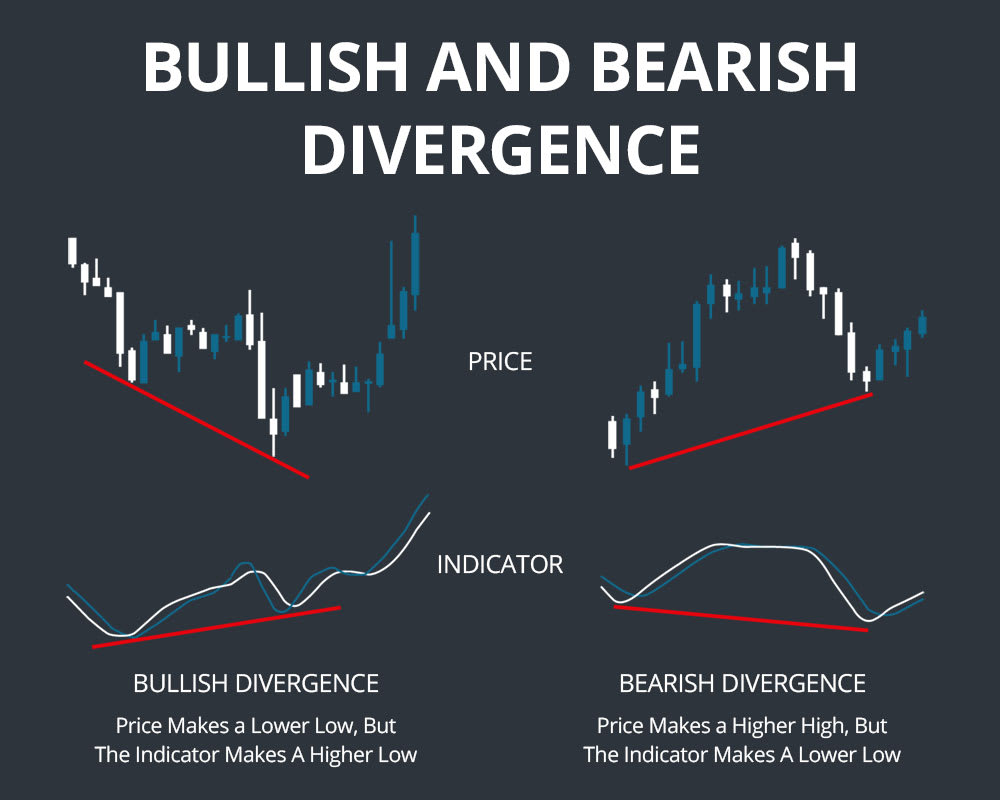
The primary use of stochastics is to predict potential reversals in a stock price, and a divergence between a stock’s price and the stochastic oscillator is the first indication of a potential reversal. A divergence occurs when a stock’s price reaches a new lowest low or highest high, while the stochastic oscillator (that is, %K) forms a higher low or lower high, respectively. This divergence indicates that there is less downside or upside momentum, which may precipitate a reversal.
Divergence alone cannot confirm a reversal, but there are additional signs in the stochastics oscillator that can provide information. The most important is whether the oscillator breaks above 50 in the case of a potential bullish reversal or below 50 in the case of a potential bearish reversal. If this occurs, it is significantly more likely that a reversal will follow since this indicates that the stock is trading above or below the average of its price over the 14-interval period.
The second thing to look for to confirm a potential bullish or bearish reversal is whether the %K line crosses above or below the %D line, respectively. Since the %D line lags the %K line, this indicates a shift in momentum similar to a signal line crossover on an MACD chart. A move back above 20 or below 80, if the stochastic oscillator had indicated oversold or overbought conditions, can also be used as evidence of a likely reversal.
Looking at other indicators as well as checking whether the stock has broken above or below a key resistance line can provide additional evidence to confirm a reversal predicted by stochastics.
Setups
Setups are essentially the inverse of divergences. A bullish stochastics setup occurs when a stock sets a lower high while the stochastics oscillator sets a higher high, while a bearish setup occurs when a stock sets a higher low while the stochastics oscillator sets a lower low. This situation indicates strengthening upside or downside momentum even as the stock price fails to set a new highest high or lowest low. This indicates that buying on the following pullback or rebound, especially as the stochastics oscillator dips below 20 and then rebounds or rises above 80 and then falls, will be lucrative since the stock should break sharply up or down afterwards. Traders can interpret either a move above 20 or below 80, a cross of the %D line, or a move above or below 50 as signals to buy or short.
Overbought and Oversold Levels
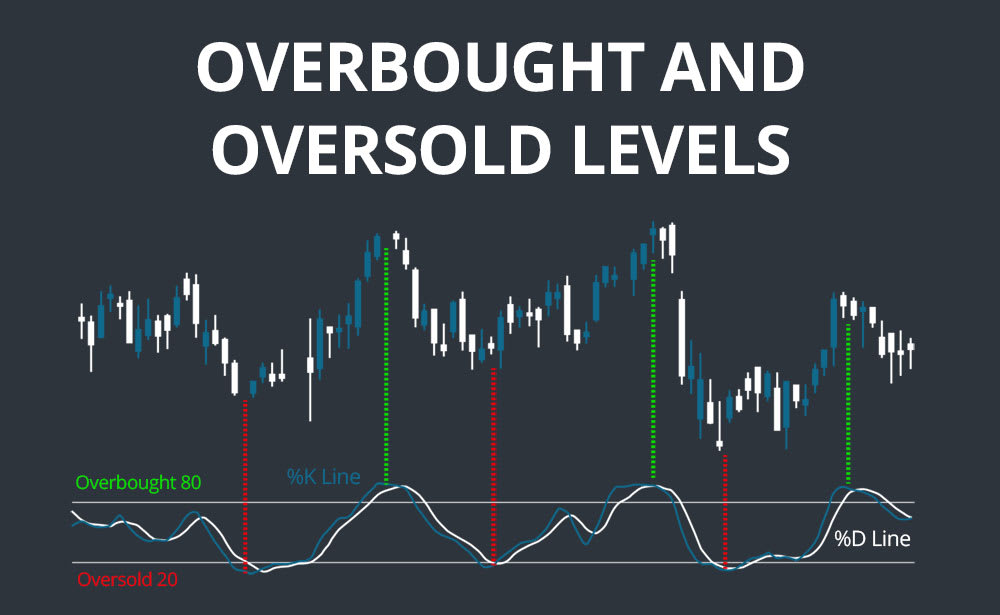
Because of the oscillating nature of the stochastics indicator, it is possible to use stochastics to identify overbought and oversold levels in a similar way to how RSI is used. %K is bound between 0 and 100 and most traders consider %K values above 80 to indicate that a stock is overbought while values below 20 indicate that a stock is oversold.
However, as with RSI, the interval used for calculating stochastics may alter the interpretation of overbought and oversold levels. In addition, overbought or oversold conditions do not in themselves signal an imminent reversal, since it is possible for a stock to be consistently overbought or oversold during a strong uptrend or downtrend. A move in %K back above 20 or below 80, combined with a %D crossover and information from additional indicators such as RSI and MACD, is necessary to identify a potential reversal.
Indicator Comparison
The stochastics oscillator has similarities to both MACD and RSI and in many ways combines features of the two. First of all, all three indicators are oscillators. Like MACD, the stochastics oscillator tracks a stock’s momentum and involves a signal line - %D – that lags the primary oscillator to provide a trading signal based on changes in price momentum. Like RSI, the stochastics oscillator can be used to identify overbought and oversold levels in a stock.
However, it is important to remember that the calculation for stochastics is very different than that for MACD and RSI. The result is that stochastics works better in sideways-moving markets trading within a set price range, while MACD and RSI work better in strongly trending markets.
Examples
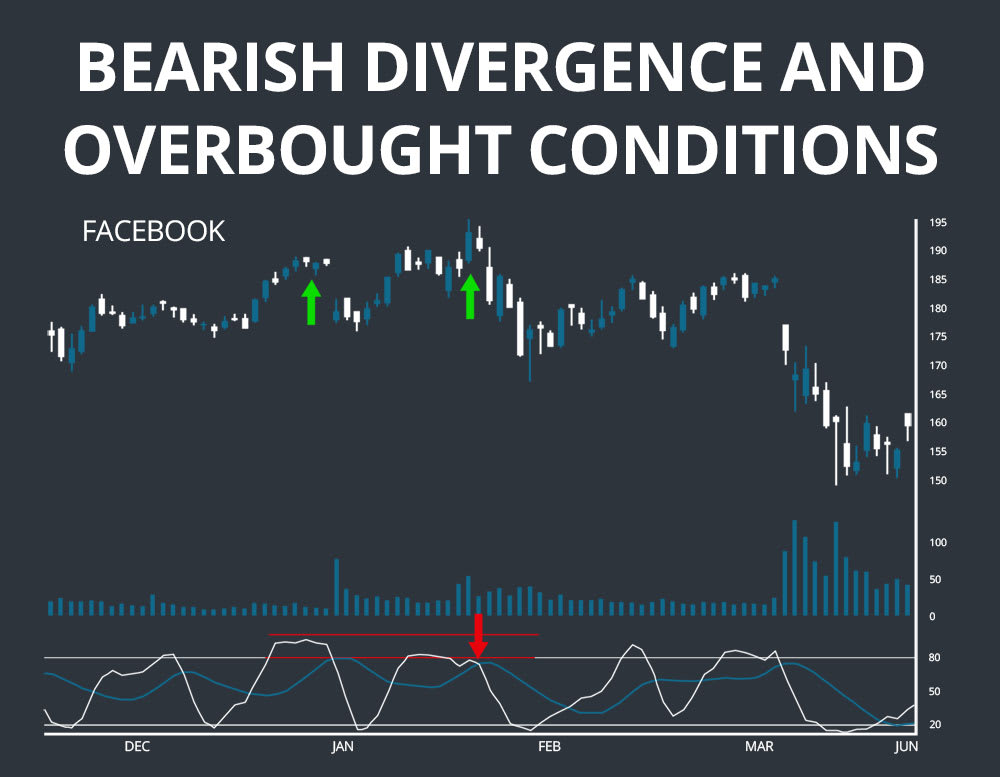
The first example shows a bearish divergence in the stochastic oscillator. The price of Facebook (FB) reaches a high on January 11 before falling, rebounding, and posting a higher high on February 1. However, the stochastic oscillator has posted a lower high on February 1 than on January 11, establishing a divergence. This divergence is further supported by the fact that the stochastic oscillator is above 80, indicating overbought conditions. As the divergence predicts, the bullish trend reverses sharply after February 1.
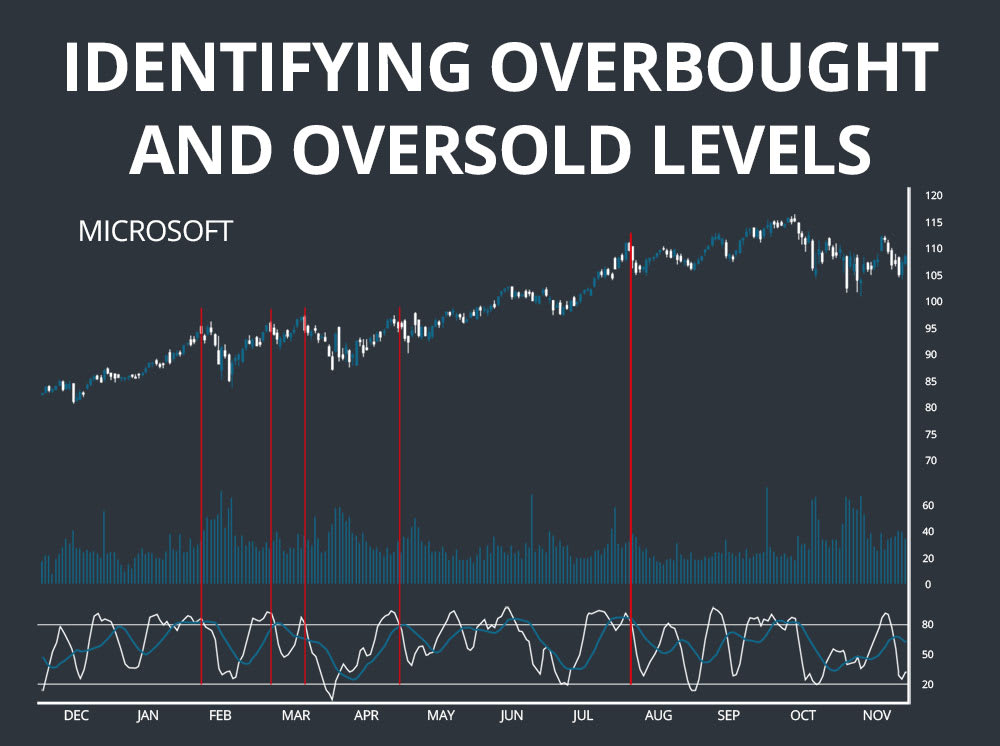
The second example shows the effectiveness – and complexity – of using stochastics to identify and trade on overbought and oversold levels. The chart of Microsoft shows numerous periods during which the stochastics oscillator indicates that the stock is overbought given a %K above 80. At the end of many of these periods, a dip below 80 coincides with a bearish crossover of the %D line and immediately precedes a pullback that could be traded on.
However, it is also worth noting that one of the most profitable strategies in hindsight would be simply holding Microsoft stock to ride the entire uptrend. This demonstrates that overbought and oversold conditions may in many cases simply be the result of a strong trend and are not always indicative of a reversal.
Conclusion
Stochastics is an oscillating momentum indicator widely used by both beginning and advanced traders to predict potential reversals and to identify overbought and oversold levels. While stochastics bears many similarities to MACD and RSI, this indicator often works more effectively in sideways-moving markets and can be used in combination with MACD and RSI to provide additional information about potential changes in price momentum.
Related Reading:
Ready to start scanning? Try for free and choose the plan that fits your workflow.