Jump to: The scan · Float rotation · The card · Example · The test · Conditions · Failures · Checklist
What is a low float stock, and why does it move so far?
A stock’s float is the number of its shares free to trade: all the shares outstanding, minus those held by insiders and other holders who cannot sell freely. A low float stock has few of them. There is no official line; most traders and scanners draw it at 10 million or 20 million shares, and the Scanz template on this page uses 10 million.
On any given morning the float is fixed and demand is not. When a stock with 1.5 million free shares suddenly has buyers for 10 million, every share on the offer gets taken and the price climbs until someone is willing to sell. A 500 million share float absorbs the same buying without noticing.
What brings the buyers is attention. A study of how individual and institutional investors trade found “individual investors are net buyers of attention-grabbing stocks”, where attention means news, unusual volume or an extreme one-day move (Barber and Odean, 2008). A low float that starts moving produces all three at once: it tops the gainers lists and every relative-volume scan, and each new buyer pushes it higher in front of the next.
The thin supply works in reverse too: when the buying stops there are few bids underneath, and everyone who bought the last leg wants out at once. The rules on this page are for taking part in the spike without being the one still holding at its top.
How do you scan for low float stocks?
The list has to answer three questions at once: is the float small, is the stock moving today, and is anyone trading it. Scanz has a ready-made scan for that, Low Float Runners. This is what it returned for November 5, 2026, with the one column you add.
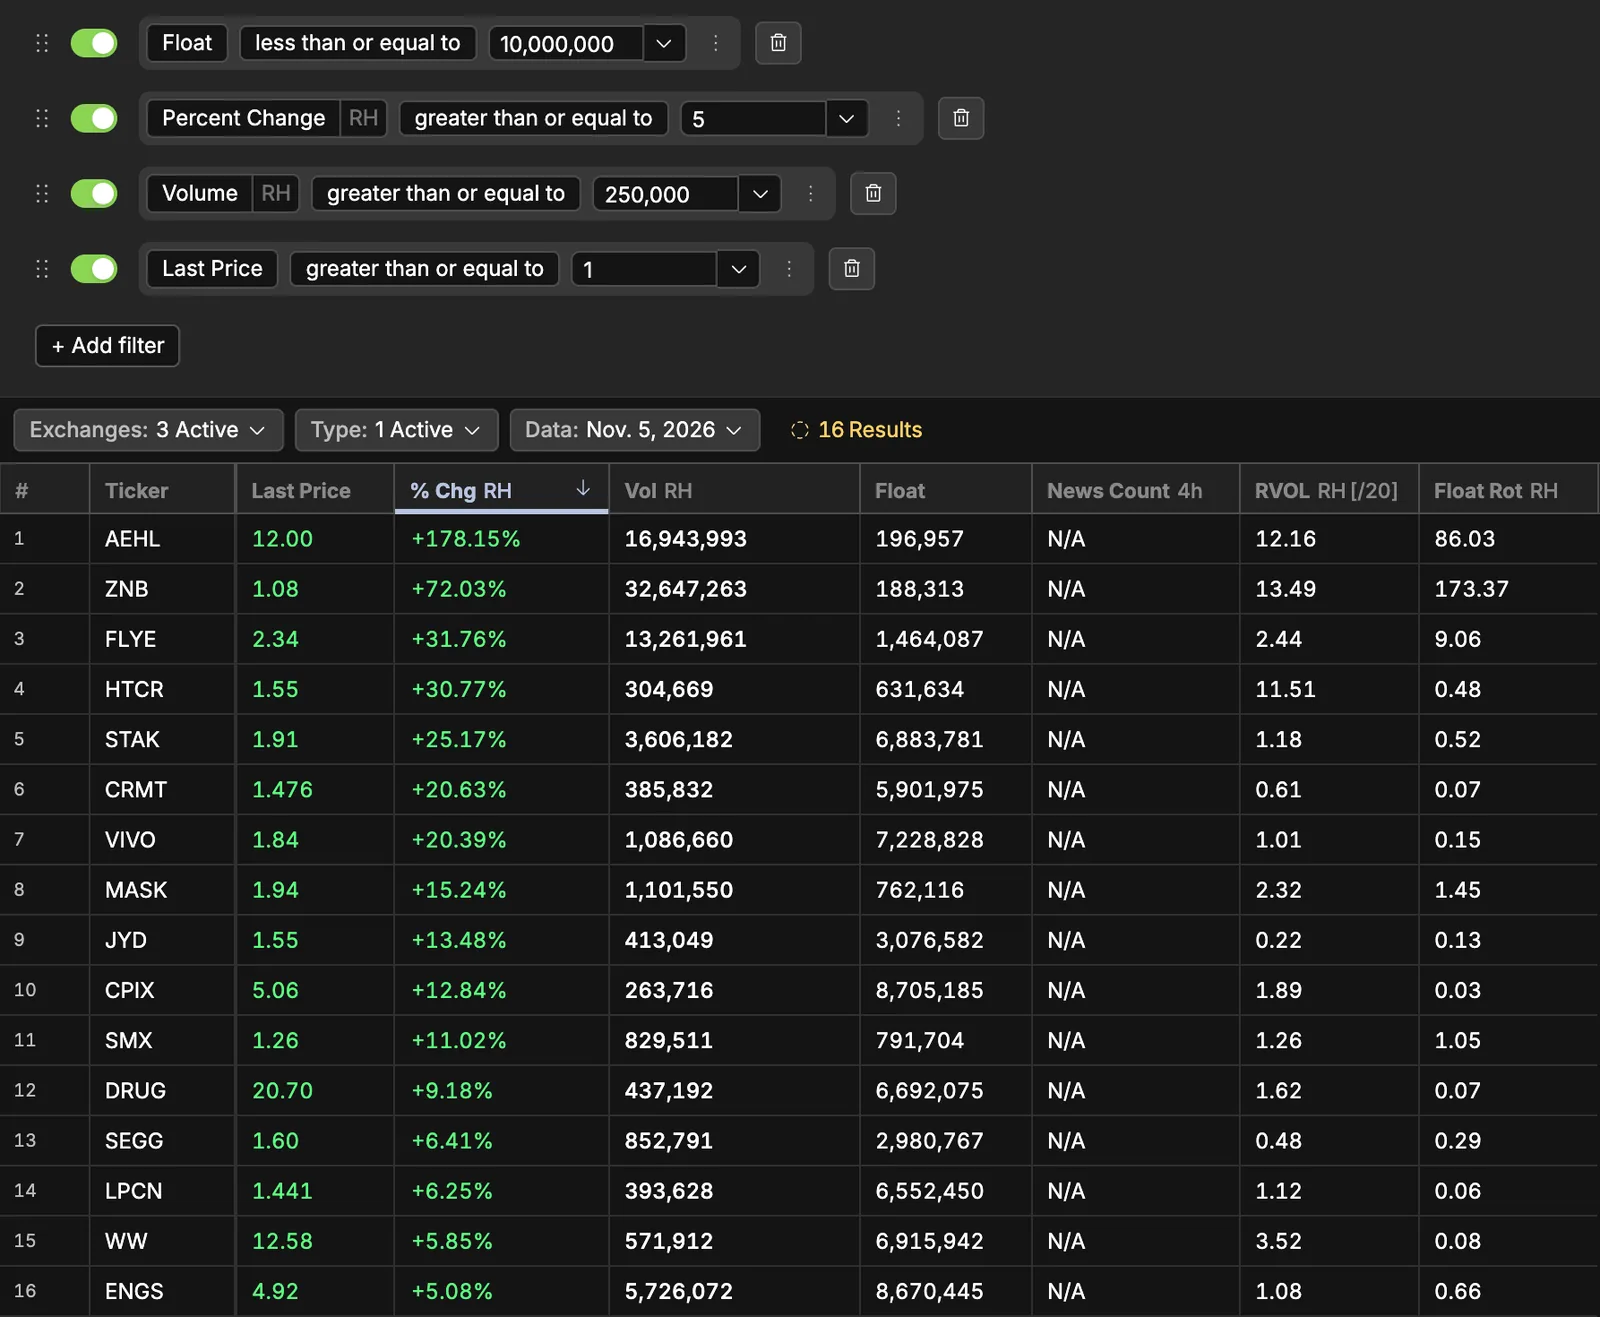
These are its rules exactly as the template stores them.
The scan · Data Scanner · Regular hours, 9:30 am–4:00 pm ET
Low Float Runners
| Rule | Setting | Why it's there |
|---|---|---|
| Float | ≤ 10,000,000 shares | Small enough that a few million shares of buying takes out every offer. Raise it to 20,000,000 for the wider definition. |
| Percent Change (Regular Hours) | ≥ 5% vs the previous close | Only stocks already moving today. |
| Volume (Regular Hours) | ≥ 250,000 shares | Real participation. Under that, a low float can be up 30% on a handful of trades you could not get out of. |
| Last Price | ≥ $1 | Leaves out sub-dollar stocks, where one cent is a big slice of the price and the spread swallows the move. |
The template has no float rotation filter or column, so add it: in your copy, click + Add column and add Float Rotation (Regular Hours), or add it as a filter at 1 or more, the card's in-play rule. It sits with Float and Percent Float in the Capital Structure filters. The list shows Ticker, Last Price, % Chg RH, Vol RH, Float, News Count 4h and RVOL RH (20-day), sorted by the day's regular-hours change.
7 days of Pro free, card required: this list, a Float Rotation column and the Float Rotation Trigger signal with a sound. At this page's pace a five-session trial week brings one or two triggers, or none. $199/month after day 7 unless you cancel in the app.
Get told when it happens. The Float Rotation Trigger template in the Signal Scanner fires the moment a stock’s regular-hours volume passes its float, priced $1 or more. Its ratio can be set from 0.25 to 10 times the float. Once you copy it with Use template you can give it a sound (Signals guide).
Variations on the scan
A stricter list. Small-Cap Momentum keeps the 10 million float cap and adds a $2 to $20 price, a 10% gain, relative volume of 5 or more against a 50-day average (the average and session can be changed) and at least one headline or filing in the last four hours.
Before the bell. The scan fills from 9:30. To watch the same stocks form earlier, copy it and switch Percent Change and Volume to the Pre-Market session. Clicking a row opens its chart in QuickView in the web app (QuickView guide).
What is float rotation, and how do you read it?
Float rotation is today’s volume divided by the float: how many times the free shares have changed hands. FLYE traded 13,261,961 shares in regular hours on November 5, 2026 against a float of 1,464,087, a rotation of 9.06.
Scanz shows it in the scan column (filter reference) and in every Montage’s stats panel, as ROTATION, beside FLOAT and % FLOAT. Read ROTATION as a multiple even though the panel prints a % sign: FLYE’s 9.06 is 9.06 times the float. % FLOAT is the float as a share of all shares outstanding (about 90% for FLYE), not short interest.
- Under 0.5. Most of the float has not traded; a gain on light volume can vanish when one holder sells.
- 1. Every free share has, on average, changed hands once. The Float Rotation Trigger fires here, and the rules below require it.
- Several times. Everyone who wanted the stock has had a chance to buy, and many have sold. The swings get bigger both ways.
Rotation tells you how crowded a stock is, not which way it goes next. AEHL and FLYE both rotated hard before the bell on November 5: AEHL traded 7.31 million shares in pre-market against the 196,957-share float Scanz showed, about 37 times, and FLYE 14.2 million, about 9.7 times. AEHL went on to rise 44% past its pre-market high; FLYE never got back to its own. Price separated them, which is why the rules never buy on rotation alone.
What are the entry, stop and exit rules?
The setup on one card
- In play
- On the Low Float Runners list, with Float Rotation (Regular Hours) of 1 or more
- Time window
- No entry in the first five minutes (9:30–9:35 am ET); no new trade after 3:30 pm ET
- Mark
- The level: the pre-market high. Once the stock has traded above it, the level is the day's high, the top the pullback comes down from
- Setup
- A pullback after the open that stops making lower lows: at least two 5-minute bars that hold above its low
- Trigger
- A 5-minute bar that closes above the level on at least twice the pullback's average bar: the average volume of the bars from the one after the level was set (9:35 at the earliest) to the one before the trigger
- Entry
- At the close of the trigger bar
- Stop
- Under the trigger bar's low. Shares = the dollars you will risk ÷ the distance from the entry to the stop
- Exits
- Half off at 1R. Trail the rest under each higher 5-minute low; out on a 5-minute close back under the level you bought the break of. Anything still open comes off by 3:55 pm ET: nothing is held after hours or overnight
- Attempts
- Two a stock a day. After a stop, the level is the day's high, and a new pullback has to form under it
- Size
- Half your normal dollar risk under a 1 million share float, or when the stop is wider than the stock's pause band (10% over $3, 20% from $0.75 to $3): a pause can reopen the stock through your stop
- Skip it when
- It is under $1; the spread is more than a tenth of the risk; a registration or offering filing is out today: S-1 or S-3, F-1 or F-3 from a foreign company, or a 424B prospectus supplement
Why each rule is there
- No entry in the first five minutes. A gap-up opens into pre-market buyers looking to sell: on November 5, AEHL and FLYE fell more than 20% from their opens within half an hour, and ZNB 16%. It costs you the stock that runs from the open; none of the five in the example below did.
- The pre-market high. It is where the pre-market’s most eager buyers paid up. A close back above it after a flush means their shares have been absorbed.
- A close, on twice the volume. Low floats poke through a level and fall back inside the bar. The close shows the level held; the volume, that more traders bought the break than sold the pullback.
- Two bars that hold above the low. One bar can be a pause in the fall; two in a row is the least the card takes as a low that held. OMH’s pullback in the test held for nine.
- Half at 1R. Low-float spikes reverse as fast as they rise. A tight trail on the rest gives back part of a big run.
- No new trade after 3:30 pm. Everything comes off by 3:55, so a later entry has under 25 minutes to reach 1R. OMH’s run to $18.23 came at 3:50, and the rules sat it out.
- Two attempts a stock a day. It caps what one stock that keeps failing can cost you at 2R.
- A spread under a tenth of the risk. Buying at the ask and selling at the bid costs about one spread, so at a tenth of the risk the round trip costs about 0.1R before the stock moves.
- No offering filed today. New shares are usually priced under the market, and a run is what they get sold into.
How to size it
A stock back under the trigger bar’s low has failed the break, so the stop goes there and the share count comes from it: the dollars you will lose ÷ the distance to the stop. In the test below the three stops were 3%, 8% and 28% under the entry. With a $100 normal risk all three were half size, $50, because all three floats in Scanz were under 1 million (two of those figures were out of date; see why runs fail): TNMG’s 12-cent stop was 416 shares ($1,826 of stock) and OMH’s $2.48 stop was 20 shares ($178). Tight stops are where the spread rule bites: TNMG’s 12 cents allows a spread of 1.2 cents, so a 2-cent spread means no trade.
What a halt does to your stop
A stop fills at the reopen, not at its price. Under the Limit Up-Limit Down plan, 15 seconds at the band around the last five minutes’ average price brings a five-minute pause: 10% for most stocks over $3 and 20% from $0.75 to $3, doubled in the last 25 minutes for stocks at $3 or less (LULD plan). A float under 1 million can reach the band in seconds, and a stop wider than one band can be jumped, so the card halves the risk for both. Scanz carries no halt data; a pause leaves a 5-minute bar with no trades.
A real example: AEHL and FLYE on November 5, 2026
Five stocks on the November 5, 2026 list traded their whole float in regular hours. AEHL and FLYE met all four Low Float Runners rules within the first five minutes; one ran 178% and the other faded all day. The other three are at the end of this section. Prices, times and volumes are read from the Scanz 5-minute chart and Montage, and floats are the figures Scanz showed; volume is shares per bar.
AEHL (Antelope Enterprise Holdings) closed at $6.27 on November 4. Its float in Scanz was 196,957 shares, a figure that turned out to be out of date (below). Scanz’s news feed shows no press release or SEC filing for AEHL on November 4 or 5, and EDGAR shows none either: no headline a trader could read explains the move.
The result: one trade, in at $14.38 at 10:40 and stopped at 10:45 for −1R, on a stock that closed up 178%.
| Time (ET) | What AEHL did | What the rules said |
|---|---|---|
| 4:00–9:25 | Opened pre-market at $9.37 and climbed to $13.45 by 8:05 on 7.31 million shares, about 37 times its float | Mark the pre-market high: $13.45. |
| 9:30 | Opened at $12.60, up 101%, and traded 343,467 shares in the first bar | Every rule met; regular-hours volume already past the float (rotation 1.74). No entry in the first five minutes. |
| 9:35–9:55 | Fell to $10.01, 21% under the open | The flush. The open’s buyers are trapped. |
| 10:00–10:35 | Held $10.20, then $10.43, and climbed back to close at $13.17 | The setup: the pullback stopped making lower lows. |
| 10:40 | Traded to $14.80 and closed at $14.38 on 418,094 shares | Trigger: a close above the pre-market high on 2.1 times the pullback’s average bar (9:35–10:35) of 201,398. Entry $14.38, stop under the bar’s $13.20 low, risk $1.19, 1R at $15.57. Rotation 17. |
| 10:45 | Hit $15.49, eight cents short of 1R, and closed at its low, $13.07, on 777,370 shares, the day’s heaviest bar | Stopped out: about −1R. |
| 10:50 and 11:00 | No trades in either bar; it reopened at $12.00 at 10:55 and $13.90 at 11:05 | The trace of two pauses. A stop still waiting when the first began would have filled near $12.00, about −2R. |
| 11:05–11:35 | Back to $15.40 | After the stop the level is the day’s high, $15.49 from 10:45, and a new pullback has to form under it. |
| 12:30 | Poked to $16.06 and closed at $14.52 | Closed under the $15.49 level: no trigger. |
| 12:55 | Traded to $16.15 and closed at $15.70 | Closed under the $16.06 level: no trigger. |
| 1:00 | Closed at $17.59 | Above the $16.15 high set one bar earlier, with no pullback beneath it: no setup. |
| 1:05–3:30 | Hit $18.60 and closed the 1:05 bar at $15.98; made the day’s high, $19.39, at 1:55 | No second trade. |
| 4:00 | Closed at $17.44, up 178.15%, on 16,943,993 shares | Rotation 86 for the day. |
A pause landed in the trade, and every later break either closed under the day’s high or had no pullback beneath it; a buyer of the 1:00 break, which had no setup, was out at the 1:05 close for about −0.85R. Waiting for a pullback that held the $13.45 pre-market high would have skipped the first trade too, because the 10:45 bar went straight through it.
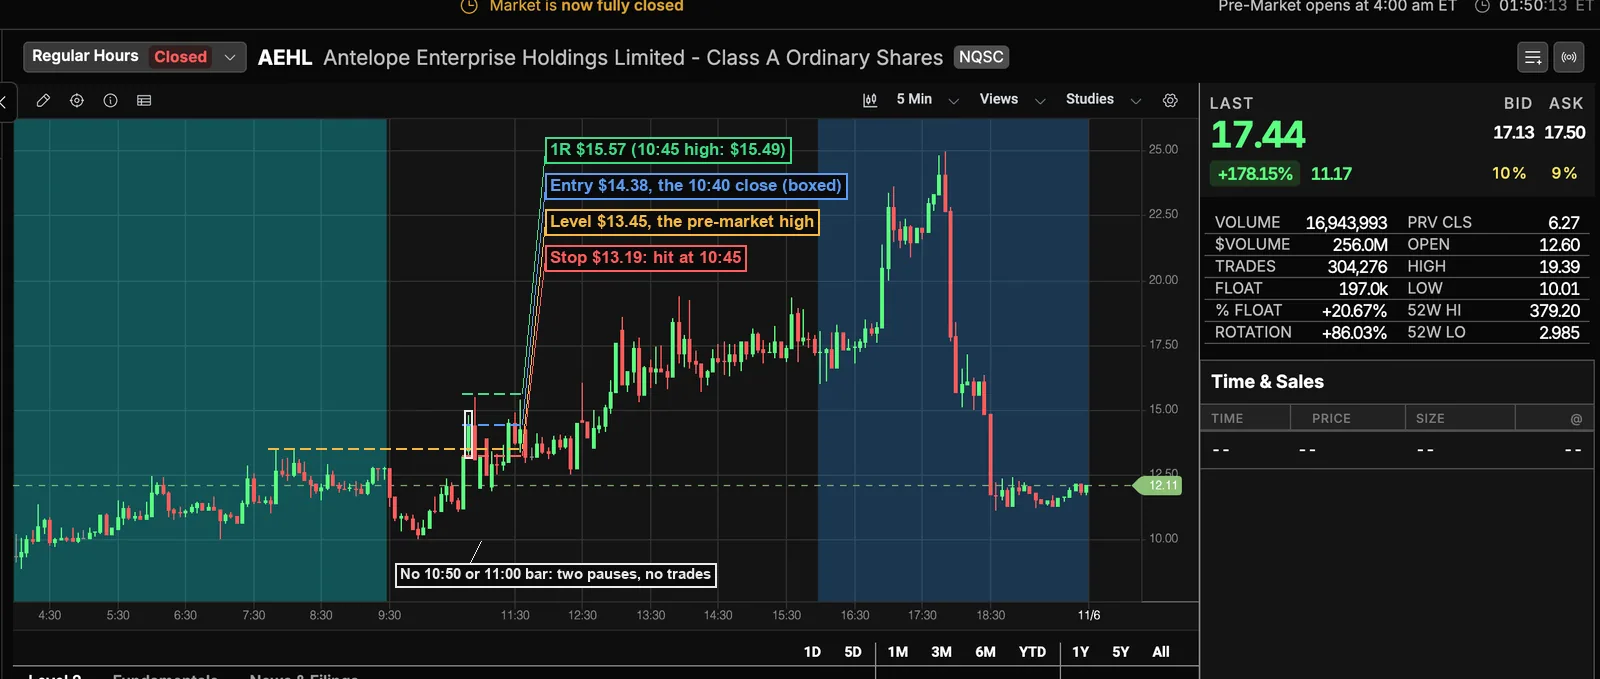
The day did not end at 4:00. After hours AEHL ran from about $18 to $24.99 by 5:50 pm, then fell to $11.11 by 6:35 pm, 55% in about 45 minutes.
EDGAR does show supply. An at-the-market program, in a prospectus supplement dated October 1 and amended October 22, lets AEHL sell up to $100 million of shares through its sales agent “from time to time” (prospectus supplement), and a 6-K filed November 2 describes a $6 million convertible note that converts at 80% of the lowest daily VWAP of the three trading days up to conversion (6-K). The same prospectus supplement counts 18,764,856 shares outstanding once AEHL’s 2026 share sales and note conversions are included. Scanz’s float and % FLOAT imply about 950,000: the float on the list was out of date, so the rotation figures above are too high by an amount no filing settles.
FLYE (Fly-E Group) closed at $1.70 on November 4, with a float of 1,464,087 shares, which squares with the 1,632,386 shares outstanding in its September 1 10-Q.
The result: no trigger all day. FLYE never closed back above its $3.34 pre-market high, and a buyer of the open was down 17% at the close.
| Time (ET) | What FLYE did | What the rules said |
|---|---|---|
| 4:00–8:55 | Traded 15,714 shares all morning, between $1.71 and $1.98 | Not on anyone’s list. |
| 9:00–9:25 | Spiked from $1.90 to $3.34 in the 9:00 bar on 2,849,966 shares; 14.2 million traded in the half hour, about 9.7 times the float | Mark the pre-market high: $3.34. |
| 9:30 | Opened at $2.70, up 59% but 64 cents under the pre-market high; made its regular-session high, $2.85, and closed the bar at $2.28 on 2,945,559 shares | Every rule met, rotation 2.0, near the top of the list. No entry yet. |
| 9:40 | Fell to $2.07 | The flush: 23% under the open. |
| 9:45–10:00 | Held $2.15 and $2.20 and bounced to $2.49 | A setup, but the trigger is a close above $3.34. |
| 10:00–4:00 | Never closed above $2.46; traded between $2.05 and $2.49 and closed at $2.24 | No trigger, no trade. A buyer of the open was down 17% at the close. |
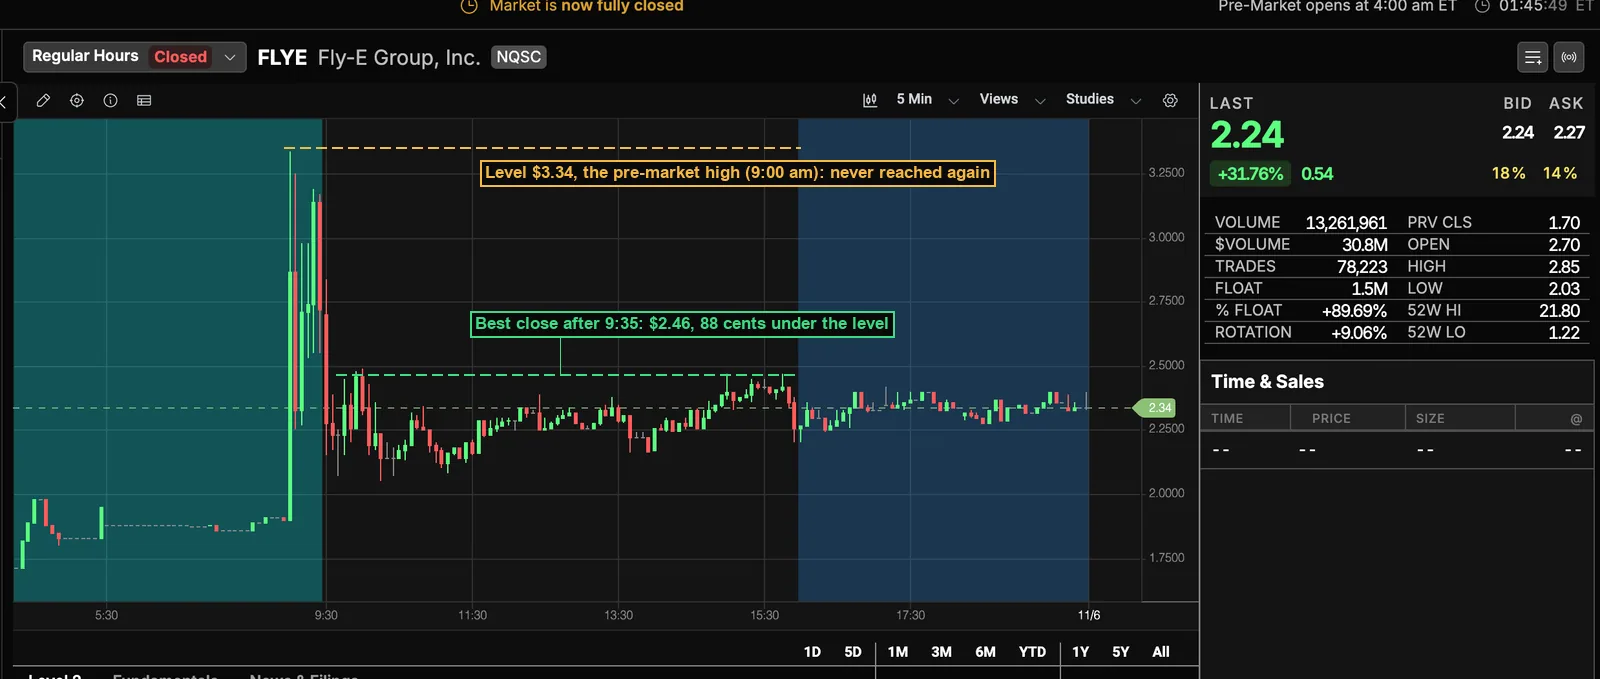
At 9:30 FLYE had everything a low-float trader looks for: a tiny float, a 59% gap, heavy rotation, a place at the top of the list. Scanz’s news feed had one FLYE item across November 4 and 5: an 8-K filed at 5:00 pm on November 4 under Item 2.04, the item a company files when an event speeds up or increases a debt (SEC filing). Nothing came out near the 9:00 spike, and the rules do not need to know what started it.
All five that traded their float
| Stock | Float in Scanz | Regular-hours rotation | Pre-market high | What the card did |
|---|---|---|---|---|
| AEHL | 196,957 | 86.0 | $13.45 at 8:05 am | One trade at 10:40: −1R |
| ZNB | 188,313 | 173.4 | $1.825 at 4:10 am | No trade: opened at $1.19; its best close after 9:35 was $1.205 |
| FLYE | 1,464,087 | 9.1 | $3.34 at 9:00 am | No trade: its best close after 9:35 was $2.46 |
| MASK | 762,116 | 1.45 | $2.17 at 7:55 am | No trade: its best close was $2.06, at 1:30 pm |
| SMX | 791,704 | 1.05 | $1.54 at 6:15 am | No trade: opened at $1.44 and never closed back above $1.54 |
Does it work? Eight sessions, 29 stocks, three trades
Three trades in 29 chances, one winner, −1.46R. The rules passed on 26 of the 29 times a low float traded its float.
The same 29 stock-days, run with the plain break the card replaces: buy the first 5-minute close above the level, with no pullback or volume test, and the same in-play test, time window, stop, exits and two attempts a day.
| Version | Trades | Winners | Total |
|---|---|---|---|
| The card | 3 | 1 | −1.46R |
| Plain break | 14 | 5 | −2.86R |
The pullback and volume tests skipped 11 trades: seven losers worth −5.99R and four winners worth +4.59R, the biggest PARA’s 9:40 break on November 3 (+1.64R). Neither version made money over eight sessions; the tests cut the trades by nearly four in five and roughly halved the loss.
| Date | Stock | Sample | Float in Scanz | Entry | Stop | Exit | Result |
|---|---|---|---|---|---|---|---|
| Nov 2 | TNMG | Out | 237,300 | $4.39 at 11:30 | $4.27 | Stopped, 11:35 | −1R |
| Nov 4 | OMH | Out | 425,700 | $8.92 at 11:45 | $6.44 | Half at $11.40 (12:00), half at $9.14 (12:05) | +0.54R |
| Nov 5 | AEHL | In | 196,957 | $14.38 at 10:40 | $13.19 | Stopped, 10:45 | −1R |
| Total | −1.46R |
- Out of sample, October 27 to November 4, the seven sessions the card was not written from: 22 stock-days, 2 trades, −0.46R. The plain break: 12 trades, −1.01R.
- In sample, November 5, the session the card was written from: 7 stock-days, 1 trade, −1R. The plain break: 2 trades, −1.85R.
Every stock-day and every trade
| What the rules did | Stock-days | Examples |
|---|---|---|
| No trade: never closed back above the level after 9:35 | 19 | ZNB, FLYE, MASK and SMX on November 5 |
| No trade: broke the level with no pullback beneath it | 7 | CHSN, November 3: $1.08 open, new highs from 1:10 pm with no pullback between, $3.37 close (+212%). PARA the same morning: closes of $5.73, $7.62 and $8.34 by 9:50 from a $3.75 open, then $2.71 at 4:00 |
| Trade | 3 | TNMG, OMH and AEHL, in the table above |
The no-pullback rule cost the biggest run of the eight sessions. On PARA it cost a winner too: the plain break took +1.64R before the stock gave back 67% from its 9:50 close.
Every stock-day, by session. † marks a break with no pullback beneath it; the other untraded stocks never closed back above their level after 9:35. November 5 has seven: the five in the example, plus CHSN and ELPW, which met the rules during the session and were off the list by the close.
| Session | In play | Trades |
|---|---|---|
| Oct 27 | IPST | — |
| Oct 28 | None among the stocks checked | — |
| Oct 29 | DAIC, NUWE | — |
| Oct 30 | FRGT, NCPL †, ONEG †, TNMG | — |
| Nov 2 | CLRO, TNMG | TNMG −1R |
| Nov 3 | CHSN †, CRIS †, DTST †, EHGO, FRGT †, PARA †, RDAC, WFF | — |
| Nov 4 | CHSN, CRIS, DKI, OMH, WORX | OMH +0.54R |
| Nov 5 | AEHL, CHSN, ELPW, FLYE, MASK, SMX, ZNB | AEHL −1R |
OMH, November 4: the one winner
Ohmyhome closed at $2.98 on November 3 and set a pre-market high of $2.92. Its float in Scanz is 425,700 shares, a figure its filings show was out of date (why runs fail); it traded 86.7 million shares in regular hours, about 204 times its float.
| Time (ET) | What OMH did | What the rules said |
|---|---|---|
| 9:30–10:30 | Opened at $2.82 and climbed to $8.80 | Past its pre-market high early, so the level is the day’s high: $8.80, set in the 10:30 bar. Breaks at 9:45, 9:50 and 10:00 had no pullback beneath them. |
| 10:35–11:40 | Fell to $5.42 by 10:55, then nine bars that all held above it, between $5.53 and $6.86 | The pullback, and the setup: no lower low. |
| 11:45 | Traded to $9.20 and closed at $8.92 on 2,725,777 shares | Trigger: a close above $8.80 on 2.96 times the pullback’s average bar (921,574 shares, 10:35–11:40). Entry $8.92, stop $6.44 under the bar’s low, risk $2.48, 1R at $11.40. Half size: the float is under 1 million, and the stop, 28% away, is wider than the 10% pause band. |
| 11:50 | Closed at $9.20; the chart has no 11:55 bar | The trace of a pause: the 12:00 bar opened at $10.48. |
| 12:00 | Hit $12.58 and closed at $9.41 | Half off at $11.40: +1R on that half. Trail the rest under the bar’s $9.15 low. |
| 12:05 | Fell to $8.56 | The rest out at $9.14: +0.09R. The trade: +0.54R. |
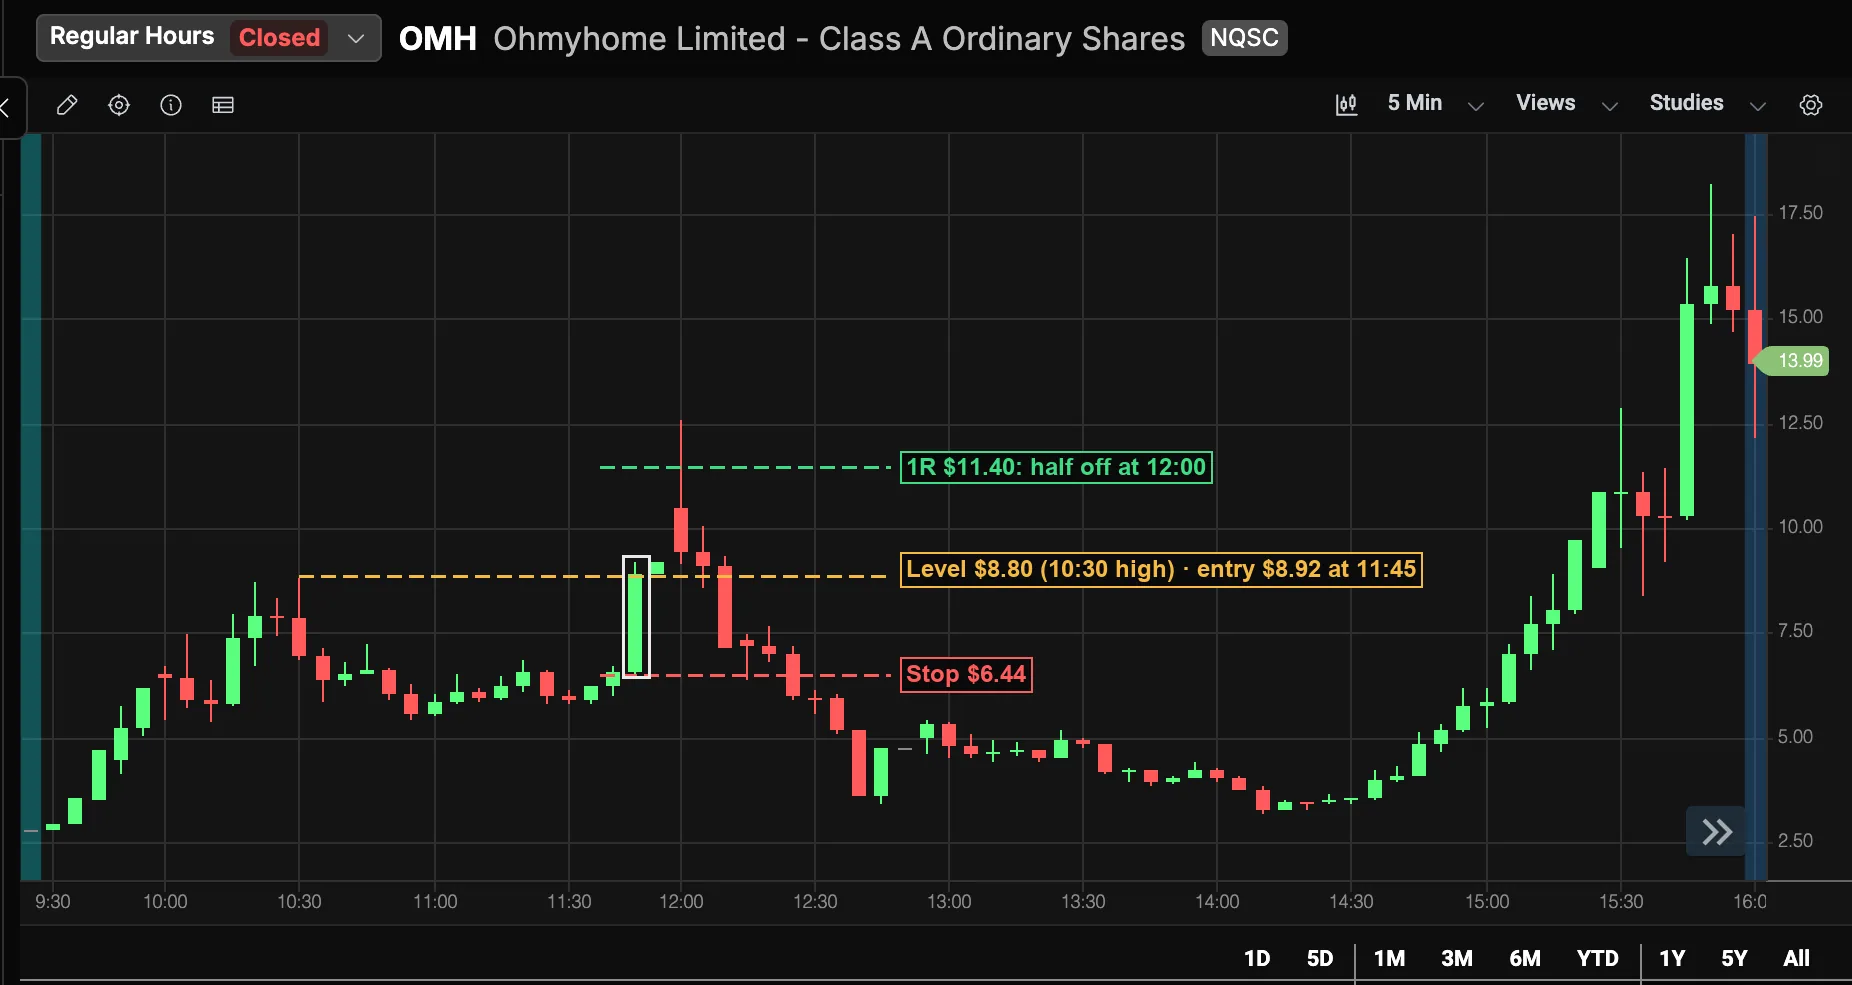
OMH closed the 12:10 bar at $7.13, under the entry, and by 2:10 it was at $3.20, 64% under. It then ran to $18.23 at 3:50 and closed at $15.20, but nothing closed above the $12.58 high before 3:30, the rules’ last entry time.
Three trades in eight sessions are too few to call the rules profitable or not, and the plain break lost money too. The test shows how rarely the rules fire, about once for every ten stocks that trade their float, and what each half of the exit is for: the 1R half banked OMH’s spike before it collapsed, and the stop held both losses to 1R.
How the test was run, and what it misses
The card above was written from the November 5 session and not changed after the other seven sessions were read, with one exception: the filing rule now names the forms a foreign company files (F-1, F-3, 424B), which changes no result here. November 5 is in the sample the rules were written on; the other seven are not.
The test ran the rules over every session from October 27 to November 5, 2026, on 259 stocks: ones on Scanz’s top gainers list between 9:28 and 10:00 am ET on those days, recorded at the time, plus the 16 on November 5’s Low Float Runners list. A stock-day counts when the stock met all four Low Float Runners rules and had traded its float in regular hours. Bars are the Scanz chart’s 5-minute bars.
- The stocks are the first half hour’s gainers, so a stock that only moved in the afternoon is missing.
- 18 of the 259 would not load in Scanz. The other 241 were checked on every session their 5-minute chart reached back to: 201 to 230 of them on each session from October 30, and 85 to 135 on October 27 to 29.
- Floats are the figures Scanz showed on November 6, so a float that changed during the period is off. Two were far off: AEHL’s and OMH’s filings count many times the shares their Scanz floats imply (why runs fail), so both met the in-play rule on figures that were out of date. OMH would have been half size anyway: its stop was wider than its pause band.
- The spread was not recorded, so the spread rule is untested. The filing rule was checked on EDGAR: none of the three traded stocks filed anything on its trade day. The count of programs in place covers registration filings only; convertible notes in 6-K and 8-K filings were not counted.
How does the setup change with time of day, float and price?
The card stays the same. What changes is what to watch for, and how much to risk.
| Condition | What changes | From the eight sessions |
|---|---|---|
| Pre-market and the open | Build the watchlist on a pre-market copy of the scan and mark each pre-market high; no entry before 9:35. Pre-market volume can be thin. | All five on November 5’s closing list set their pre-market high before the bell (ZNB at 4:10 am, SMX 6:15, MASK 7:55, AEHL 8:05, FLYE 9:00); only AEHL got back above its own. FLYE traded 15,714 shares in the five hours before 9:00. |
| 9:35 am to 3:30 pm | Volume thins through midday, so a midday break needs the volume test more, not less. | All three trades triggered between 10:40 and 11:45 am. AEHL’s best leg came between 12:55 and 1:55 pm. |
| Float under 1 million | Half size: expect pauses, and stops that fill past their price. | On Scanz’s figures AEHL (196,957) and ZNB (188,313) traded their floats 86 and 173 times on November 5, and all three trades were in floats under 1 million; filings put AEHL’s and OMH’s share counts far higher. |
| Float 1 to 10 million | Nothing: the template’s core. | FLYE (1.46 million) and STAK (6.88 million, up 25% on 3.6 million shares, rotation 0.52) were both on November 5’s list; only FLYE had traded its float. |
| Float 10 to 20 million | Raise the Float rule to 20,000,000. Rotation of 1 comes later in the day. | No example: no in-play stock in the eight sessions had a float over 7 million. |
| A quiet day | Nothing: fewer chances is not a reason to loosen the rules. Count the rows with Float Rotation of 1 or more. | The count ran from none among the stocks checked (October 28) to eight (November 3). |
| Under $5 | Check the spread against your risk. | Most of November 5’s list traded under $5, where a 5-cent spread is 1% to 5% of the price. |
| No news | Nothing: the card does not filter on news. The News Count 4h column shows whether a headline or filing came out; Scanz’s feed carries SEC filings and five press-release wires (News guide). | AEHL had no headline and was traded; FLYE had an 8-K the evening before and was not. |
Why do low float runs fail?
Most of November 5’s did: of the seven in play during the session, only AEHL closed above its pre-market high. Over the eight sessions, 19 of 29 never closed back above their level after 9:35. The rules choose which ones to take and keep the losses small; they do not avoid losses. The failures come from the same few places:
- The company sells stock into the run. An offering, an at-the-market program or warrants add shares, usually priced under the market, and the float stops being low. The card’s skip rule only catches a filing out today, so it trades through a program already in place, and those are common: 16 of the 29 stock-days in the test (13 of 24 companies) had filed a shelf registration (S-3, or F-3 for a foreign company) or a 424B5 prospectus supplement in the year before, AEHL’s $100 million program and OMH, the one winner, among them. The two-minute check on EDGAR: any 424B, S-3 or F-3 in the last 12 months, and any 6-K or 8-K describing a convertible note. What matters is the program’s size against the company’s market value, and how far under the market a note converts. The Dilution Watch template in the News Scanner lists S-1, S-3, S-4, Form D and Form 144 filings as they arrive.
- A pause against you. A stop does not protect you through a halt; AEHL’s chart shows two 5-minute bars with no trades in fifteen minutes.
- A ramp and dump. FINRA, Nasdaq and NYSE have described small-cap IPOs, mostly of foreign companies, that jumped after listing and then fell to or below the offer price: “These price increases did not appear to be driven by news or material events.” In some deals foreign broker-dealers received 90% or more of the shares, so the real float was smaller than it looked (FINRA Regulatory Notice 22-25). A recent small IPO spiking on no news is the pattern to distrust most.
- An out-of-date float. Float is worked out from the company’s last reported share counts, so it lags offerings, warrant exercises and reverse splits, and data sources disagree. Two of this page’s three trades were in stocks whose float in Scanz was out of date. AEHL showed 196,957 shares, 20.67% of about 950,000; its October 22 prospectus supplement counts 18,764,856 shares outstanding, 15 million of them sold on September 3 (amendment). OMH showed 425,700, 92.15% of about 460,000; its October 7 prospectus supplement counts 1,928,724 Class A and B shares after an August 31 1-for-50 consolidation (supplement), and on October 16 it sold 3 million more with 3 million warrants at $1.30 (6-K). A 52-week high far above today’s price is another clue the share count has changed: ZNB’s was $976.00 on a day it traded around $1. Check the latest filings before trusting the float of a stock that just raised money or split; the scan cannot.
Two of the programs can be sized against the company from its own filings. This is a pre-trade check, not in the card and not tested:
| Stock-day | On file | Shares outstanding, per the filings | Market value at the prior close | Program ÷ market value |
|---|---|---|---|---|
| AEHL, Nov 5 | $100 million at-the-market program (October 1, amended October 22) | 18,764,856 | About $118 million at $6.27 | About 0.85 |
| OMH, Nov 4 | $40 million standby equity purchase agreement (October 7), after a 3 million share sale on October 16 | About 4.9 million: 1,928,724 on October 7 plus the 3 million | About $14.7 million at $2.98 | About 2.7 |
OMH, the one winner, had the bigger program for its size, and two rows with one winner cannot set a cutoff.
What the scan cannot see: halts, borrow (Scanz has no borrow data), an offering being marketed before it is filed, the depth of a thin order book, and whether the float figure is current. It finds the stocks; the chart, the news and Level 2 decide whether one is worth trading.
The checklist before you take the trade
Before the trigger
- Is it on the Low Float Runners list, with Float Rotation of 1 or more?
- Is it between 9:35 am and 3:30 pm ET?
- Have you marked the level: the pre-market high, or the day's high once it is past it?
- Did the pullback stop making lower lows?
- Did a 5-minute bar close above the level on twice the pullback's average bar?
- Is the share count your dollar risk divided by the distance to a stop under the trigger bar?
- Under a 1 million share float, or with a stop wider than the pause band, are you at half risk?
- Is this your first or second attempt on this stock today?
- No S-1, S-3, F-1, F-3 or 424B offering filing out today?
- Is the spread under a tenth of the risk?
- Do you know where half comes off and what ends the trade?
To have it running before the next open:
- Start the 7-day Pro trial. A card is required.
- Open Discover, choose Data Scanner, open Low Float & Squeeze, pick Low Float Runners and click Use template. It lands in My Scans.
- In your copy, click + Add column and add Float Rotation (Regular Hours), or add it as a filter at 1 or more.
- In the Signal Scanner, copy Float Rotation Trigger with Use template and give it a sound.
- Before 9:30, mark each stock’s pre-market high. The card does the rest.
What a trial week holds at this page’s pace: about three or four low floats a day traded their float among the stocks checked, and the card triggered three times in eight sessions, so five sessions may bring one or two triggers, or none. October 27 to 30 brought none.
After day 7 the trial becomes Pro at $199/month unless you cancel. Starter, at $89/month, runs one scan at a time and has no alerts.
Questions traders ask
What is considered a low float stock?
There is no official definition. Most traders and scanners use under 10 million or under 20 million free shares; Scanz's Low Float Runners template uses 10 million or less. Under 1 million is its own category, and the hardest figure to trust: on November 5, 2026 Scanz showed AEHL's float as 196,957 shares, while its October 22 filing counted 18,764,856 shares outstanding.
How do I find low float stocks with high volume today?
Scan for a float ceiling, a gain and a volume floor, then add float rotation. On November 5, 2026, Scanz's Low Float Runners template listed 16 stocks, and a Float Rotation column showed the 5 that had traded their whole float.
Does the low float strategy on this page work?
Too few trades to say. In eight sessions, October 27 to November 5, 2026, the rules took three trades in 29 chances: one +0.54R winner (OMH) and two 1R losses, −1.46R. On the seven sessions the rules were not written from: two trades, −0.46R. A plain break of the same levels took 14 trades for −2.86R.
Should you hold a low float stock overnight or after hours?
These rules do not: anything still open comes off by 3:55 pm ET. After hours on November 5, 2026, AEHL ran from about $18 to $24.99 by 5:50 pm, then fell to $11.11 by 6:35 pm.
Is 1x float rotation bullish?
It means the stock has the market's attention, not that it will go up. On November 5, 2026 ZNB traded its float 173 times in regular hours and closed 41% under its pre-market high; FLYE traded its 1.46 million share float 9 times and closed 17% under its open.
Why do low float stocks get halted so often?
A thin float can reach its Limit Up-Limit Down band in seconds, and 15 seconds at the band brings a five-minute pause. Scanz has no halt data; on a 5-minute chart a pause shows as a bar with no trades.
Is low float the same as high short interest?
No. Float is how many shares can trade; short interest is how many have been sold short. A low float with heavy short interest can squeeze; the Short Squeeze Watch template looks for short interest of 15% of the float or more. Scanz's Percent Float is something else: float over shares outstanding.
Why do sites show different floats for the same stock?
Float is calculated from the company's filings, not reported: sources subtract different holders and update at different times, and offerings, warrant exercises and reverse splits change the real number between filings. ZNB's 52-week high in Scanz was $976.00 on November 5, 2026, a day it traded around $1: a sign of reverse splits a float figure can lag.
What happens to a low float stock after an offering?
New shares join the supply, usually priced below the market, and the float stops being low. The means to sell are often in place first: 16 of the 29 stock-days in this page's test, AEHL's 178% run on November 5, 2026 among them, had a shelf or prospectus supplement filed in the year before.
Can you short low float runners?
It is a different trade: borrow is scarce, and a squeeze or a pause can gap the price against you. Scanz has no borrow data, so ask your broker before the trade. AEHL's after-hours spike to $24.99 on November 5, 2026 is the kind of move that sinks a short.