What is a high of day momentum break, and why does it work?
A high of day break is a stock that is already one of the day’s big movers trading above the highest price it has printed this session. The version worth trading has three parts: a strong move that sets the high, a rest underneath it where sellers fail to push the price down, and a break of that high on a jump in volume.
The high matters because of who is standing there. Everyone who bought the top of the first move is underwater and waiting to get out even; when price comes back to the high they sell, and a stock that absorbs that supply without dropping has run out of sellers at that price. Shorts who faded the move keep their stops just above the high, and breakout traders park buy-stop orders there too. Research on currency order books found stop-loss orders “cluster strongly just beyond round numbers” and that trends speed up once those levels break (Osler, 2003). That study is about currencies, not small caps, but the mechanism is the same one traders describe: when the high goes, forced buyers and new buyers arrive in the same few seconds.
The rest under the high is what separates a break from a spike. A stock that grinds up for an hour and then trades sideways in a tightening range just below its high, with each dip bought a little higher, is showing you that demand is still there at prices the morning buyers paid. A stock that spikes through its high from a sell-off is just as likely to be the top.
How do you scan for high of day breaks?
You need two things from a scanner: a short list of stocks that are already in play today, and a ping the moment one of them prints a new high. Scanz has a ready-made signal for the second, HOD Break - Momentum, with filters built in for the first. These are its rules exactly as the template stores them.
The scan · Signal Scanner · Regular hours, 9:30 am–4:00 pm ET
HOD Break - Momentum
| Rule | Setting | Why it's there |
|---|---|---|
| New High | Session: Regular Hours, fires on every new high | Each trade that sets a new regular-session high adds a timestamped row to the feed, so you see the break as it prints instead of on the next refresh. |
| % Change vs previous close (Regular Hours) | ≥ 5% | Limits it to stocks already moving today. A new high on a stock up 1% is just drift. |
| Relative Volume (20-day average) | ≥ 2 | At least twice the usual volume means extra buyers are in the stock today, which is what carries a break through the sellers at the high. |
| Volume (Regular Hours) | ≥ 250,000 shares | Enough shares have traded that you can get in and out near the price you see. |
It counts the regular-session high only. A stock that traded higher in pre-market can fire here while still below its pre-market high, so check the chart before you treat the row as a break of the whole day's high. The New Highs template in Discover counts the full day, pre-market and after-hours included.
The trial is 7 days of Pro, card required. It becomes Pro at $199/month after day 7 unless you cancel in the app. Starter ($89/month) can save one signal, which is enough to keep this one.
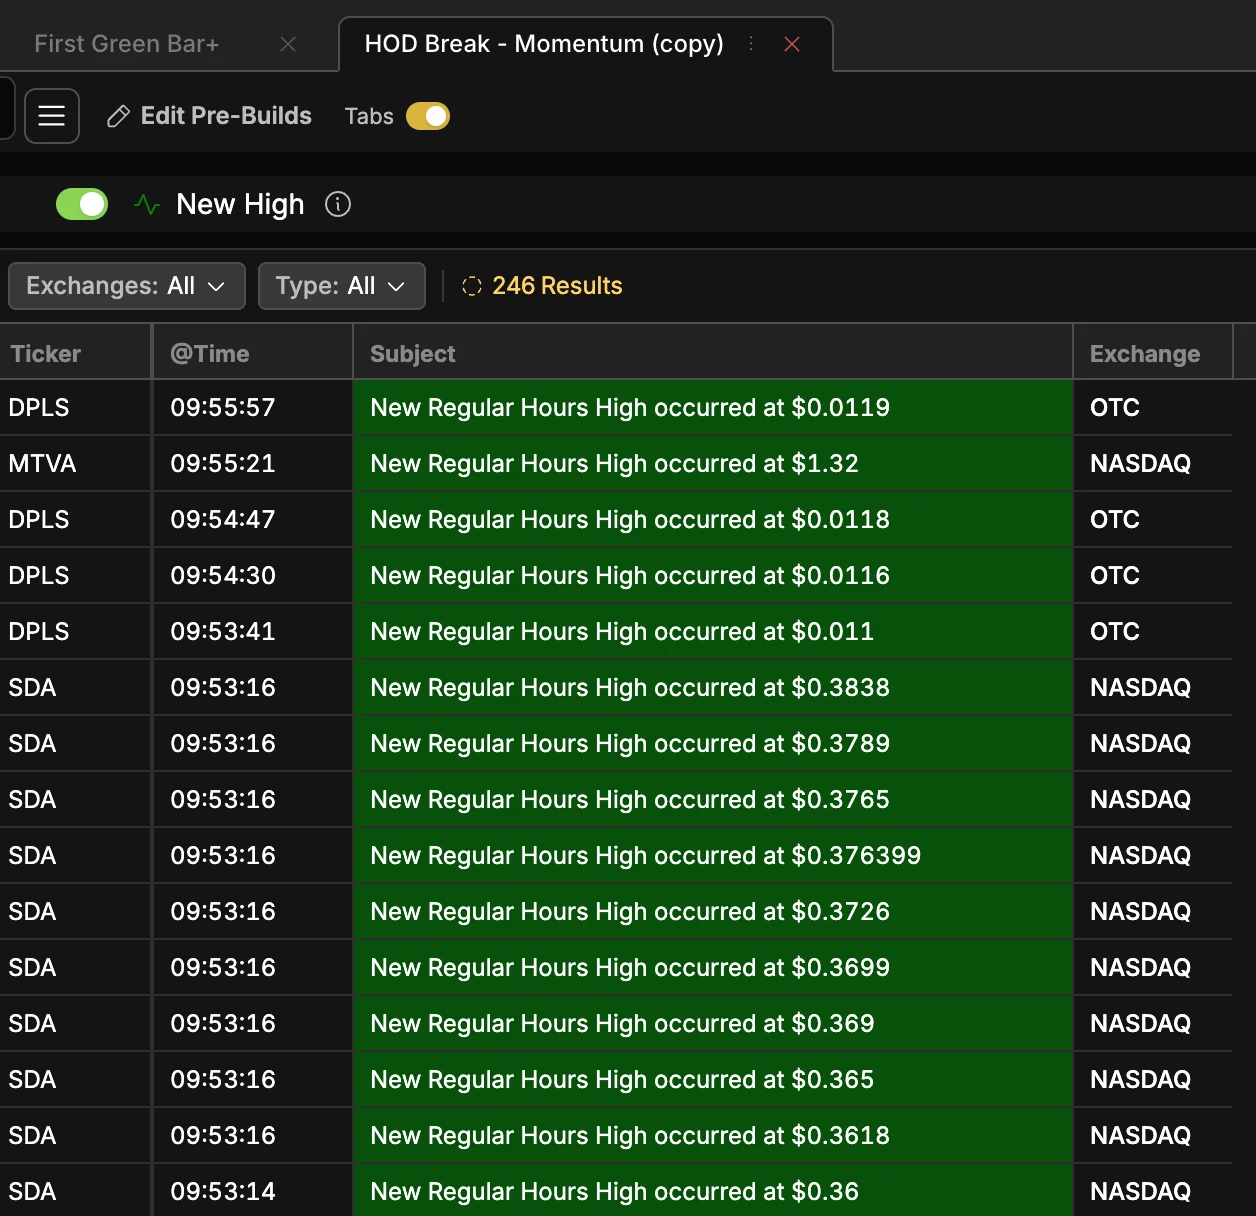
The feed is a list of fires, newest first: the time, the ticker and the price of the new high. A stock fires again on each new high, so a name that keeps appearing over a few minutes is one making higher highs. A fast runner floods it: on November 6, SDA fired at least 109 times between 9:49:46 and 9:53:16 am ET as it went from $0.23 to $0.38, and at 9:53 it filled every row on the screen. Clicking a row opens the chart beside the feed in QuickView in the web app, which is where you check for the rest under the high before you do anything else (Signals guide, QuickView guide). Once you copy the template into My Signals with Use template, you can give it a sound (one of ten) so a fire reaches you while you are looking at something else.
Tightening it. The template is deliberately wide: it has no price floor and no exchange limit. Opened at 9:45 am ET on November 6, it fired 246 times in eleven minutes. Four of the five stocks caught in minute-by-minute captures traded under $2.20, and two were under a dollar: SDA, at 23 to 38 cents, and DPLS, an OTC stock at about a cent. A small-cap version raises % Change to 10% and Relative Volume to 3 or more, and adds a price range of $1 to $20. A large-cap version goes the other way: % Change at 2 to 3%, Relative Volume at 1.5, a $20 price floor, and a volume floor in the millions. Relative volume can be measured against a different average and session in the filter’s settings (filter reference), so if the 20-day average is skewed by a news day last week, change it.
The watchlist behind it. The High % Gainers scan in Discover is the companion list: stocks up 10% or more in regular hours, Relative Volume of 2 or more, 300,000 shares and 100 trades or more, priced at $0.30 or more. By default it sorts by the last 15 minutes of % change rather than the day’s, which suits this setup: the stock coming back to life after its midday rest climbs to the top while the morning leaders that have gone quiet sink.
Other highs. The New High signal is not tied to the day. Its window can be set from 1 minute to 4 hours, to a session, to 1–30 days, to months, or to a year, so the same signal will find a stock breaking its 52-week high, which is often the same move seen on a longer chart.
What are the entry, stop and exit rules?
The setup on one card
- Time window
- Breaks from 10:00 am to 3:30 pm ET. The first 15 minutes build the opening range, and the rest under its high takes at least 15 more.
- Setup
- Up 5% or more on 2× relative volume; a rest of at least 15 minutes under the high, with lows that hold or rise
- Trigger
- A 5-minute bar that closes above the high of the rest and the day, on at least twice the volume of the rest's average 5-minute bar
- Entry
- At the close of the trigger bar, or on the first pullback that holds the old high
- Stop
- Below the low of the rest. If that is more than about a third of the day's range away, the setup is too loose to take.
- First target
- 1R: the distance from entry to stop, added above the entry. Take half the position off there.
- The rest
- Trail under each higher 5-minute low; exit on a 5-minute close back under the old high
- Skip it when
- Volume falls on the break; the stock is 15% or more above VWAP; the break comes in the last 30 minutes; the spread is more than a tenth of the risk (2 cents on a 20-cent stop)
Why wait for a rest. The first high of the day is almost always made by the opening rush, and nothing has been tested there yet. A rest of at least three 5-minute bars, with lows that hold or rise, shows you buyers taking every offer the morning’s sellers make. It also gives you a stop that means something: if price falls back under the low of the rest, the reason you bought is gone.
Why the card waits for the bar to close. HOD Break - Momentum fires on the first trade through the high, but the volume test is about the whole 5-minute bar, and no one knows a bar’s volume until it closes. Buying the first print takes the volume on faith. Waiting for the close shows it, and shows that the bar held above the old high instead of poking through and closing back under it. The cost is a few cents of price: DNUT’s first break bar closed 2.5 cents above the old high.
Or wait for a pullback. Waiting for the first pullback that holds the old high, so that the old ceiling acts as a floor, filters out more of the false breaks and costs you the stocks that never look back. It uses the same stop. On DNUT the pullback never came: the stock did not trade back at its old high until 2:30, when it was falling through it.
Sizing from the stop. Decide what you will lose if the stop is hit, then divide by the distance from entry to stop to get the share count. A $0.20 stop and $100 of risk is 500 shares; a $0.50 stop is 200. This is what makes the rules comparable from one stock to the next, and it is why results below are in R (multiples of the risk) rather than dollars.
Exits. Momentum breaks either work quickly or not at all, so the exits are about protecting the trade once it pays. Taking half off at 1R means a break that reverses later still ends as a scratch or better. The remaining shares follow the stock with a stop under each new higher 5-minute low. A 5-minute close back under the old high is the failed-break signal: the buyers who just paid up are now trapped, and you do not want to be one of them.
The second and third break. A stock that breaks, runs and rests again sets up the same trade one level higher: a new rest, a new stop under its low, a new 1R. Each one has less behind it. The traders who wanted the stock have mostly bought, the ones holding from the morning are sitting on bigger profits, and the volume that carried the first break is rarely there for the third. The rule this page uses: take a second break at the same or smaller size, only when its break bar carries at least twice the rest’s average volume, and leave a third alone unless something new, such as fresh news, has arrived. DNUT’s second break, below, passed the volume test by a hair and failed on the next bar.
A real example: DNUT on November 5, 2026
Krispy Kreme (DNUT) reported third-quarter results at 6:45 am ET on November 5 and raised its revenue guidance (8-K). The pre-market barely moved: the stock had closed at $3.52 on November 4, sat near $3.55 before the bell and opened at $3.575, up less than 2%, with no gap. The buying came in regular hours, and it kept coming. Every time, price and volume below is read from the Scanz 5-minute chart of the session; volume is shares per 5-minute bar.
| Time (ET) | What DNUT did | What the rules said |
|---|---|---|
| 9:30–10:55 | Ran from $3.56 to $4.71 on about 470,000 shares a bar | The move that sets the high. Nothing to do yet. |
| 11:00–12:15 | Rested between $4.52 and $4.705 for 75 minutes on about 208,000 shares a bar | The setup: a rest under the high, lows holding, volume drying up. The stop goes under it, at $4.51. |
| 12:20 | Traded through $4.71 to $4.75 on 716,661 shares and closed at $4.735 | The trigger: a close above the high on 3.4 times the rest’s average bar. Entry at the close, $4.735; risk $0.225 a share to the $4.51 stop, so 1R is $4.96. |
| 12:35 | Reached $4.98 | 1R reached: half the position comes off at $4.96. |
| 12:40 | Dipped to $4.86 | The trail, under the 12:35 low of $4.905, is hit near $4.90. The trade is over at about +0.9R. |
| 12:45 | Topped at $5.02 | The first push after the break ends. |
| 12:50–1:25 | Rested between $4.885 and $5.00 on about 226,000 shares a bar | A second setup, one level up, with its stop at $4.88. |
| 1:30 | Traded through $5.02 and closed at its high, $5.025, on 483,509 shares | The second trigger, a close above the high on 2.1 times the rest’s average bar: a pass by a hair. Entry at the close, $5.025; risk $0.145 to the $4.88 stop. |
| 1:35 | Printed $5.03, the high of the day, and closed at $4.985 | A 5-minute close back under the $5.02 old high: the card’s exit. The second trade is out near $4.985, about −0.3R. |
| 1:55 | Fell to $4.855 | Under the second rest’s low. Without the close-back-under exit, the stop at $4.88 would have cost the full 1R. |
| 2:30 | Fell to $4.705 on 783,586 shares, a cent under the breakout level | Shares bought at noon and held with no exit are back to break-even. |
| 3:15–3:40 | Broke through $4.71 and fell to $4.44 | The whole move is given back. DNUT closed at $4.60. |
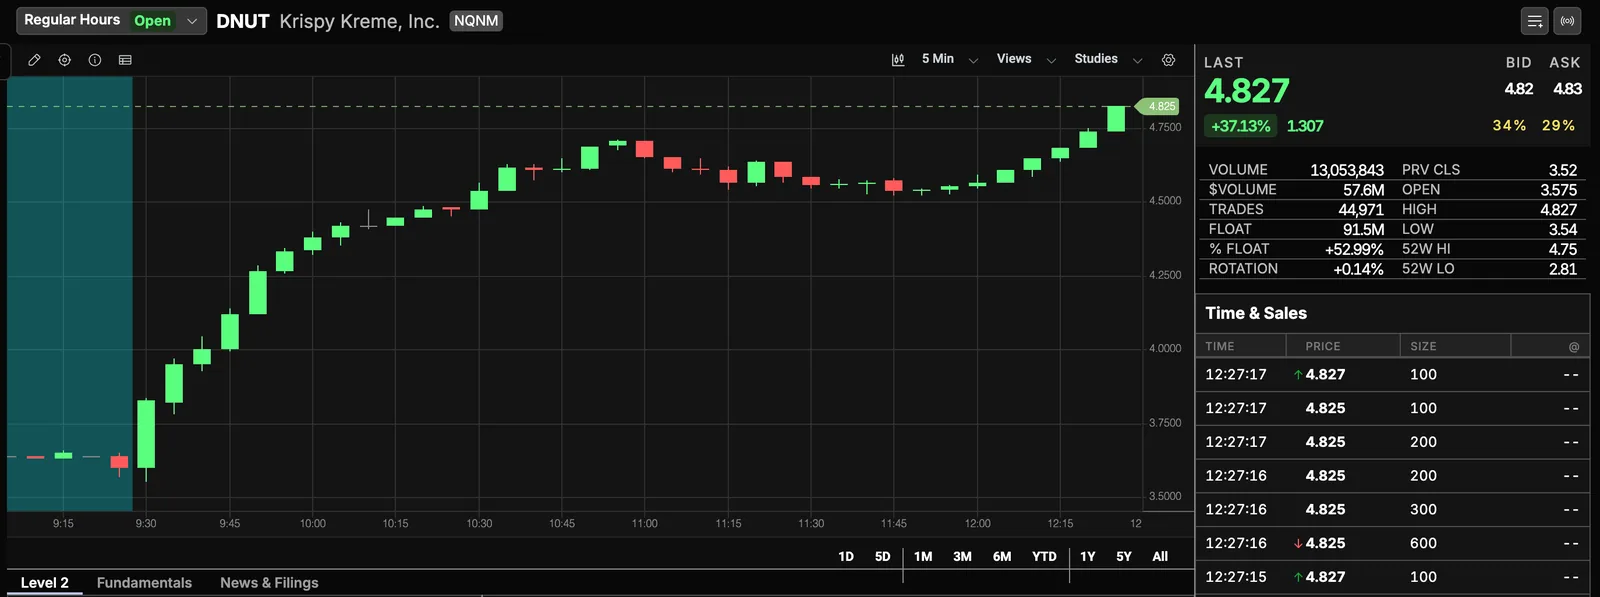
What the first break had. Everything on the card: a long rest with flat lows, volume that dried up from the run to the rest, and a break bar more than three times the rest’s average, followed by a bar that cleared the 52-week high of $4.75. At 12:20 it was about 8% above its VWAP (worked out from the same bars), well inside the card’s 15% limit. The stock went on to $5.03, about 1.3R above the entry. The trade kept about 0.9R of that, because a trail under each 5-minute low gets out on the first dip. That is what a tight trail costs: it stops a winner turning into a loser, and it leaves the rest of a run behind. Traders who want more room trail under 15-minute lows or under the low of the last rest, and give back more when the stock turns.
Why the second break failed. On the card it passed. What had changed was around it: the stock was already 43% above the prior close, the morning’s buyers were deep in profit, the break bar was 2.1 times the rest’s average bar against 3.4 times on the first break, and the new high was a cent above the old one. The close-back-under exit took it off on the next bar; without that rule it would have run to the stop twenty minutes later for a full −1R. Taken at full size, the two breaks netted about +0.6R; the close-back-under exit is what kept the second from taking most of the first.
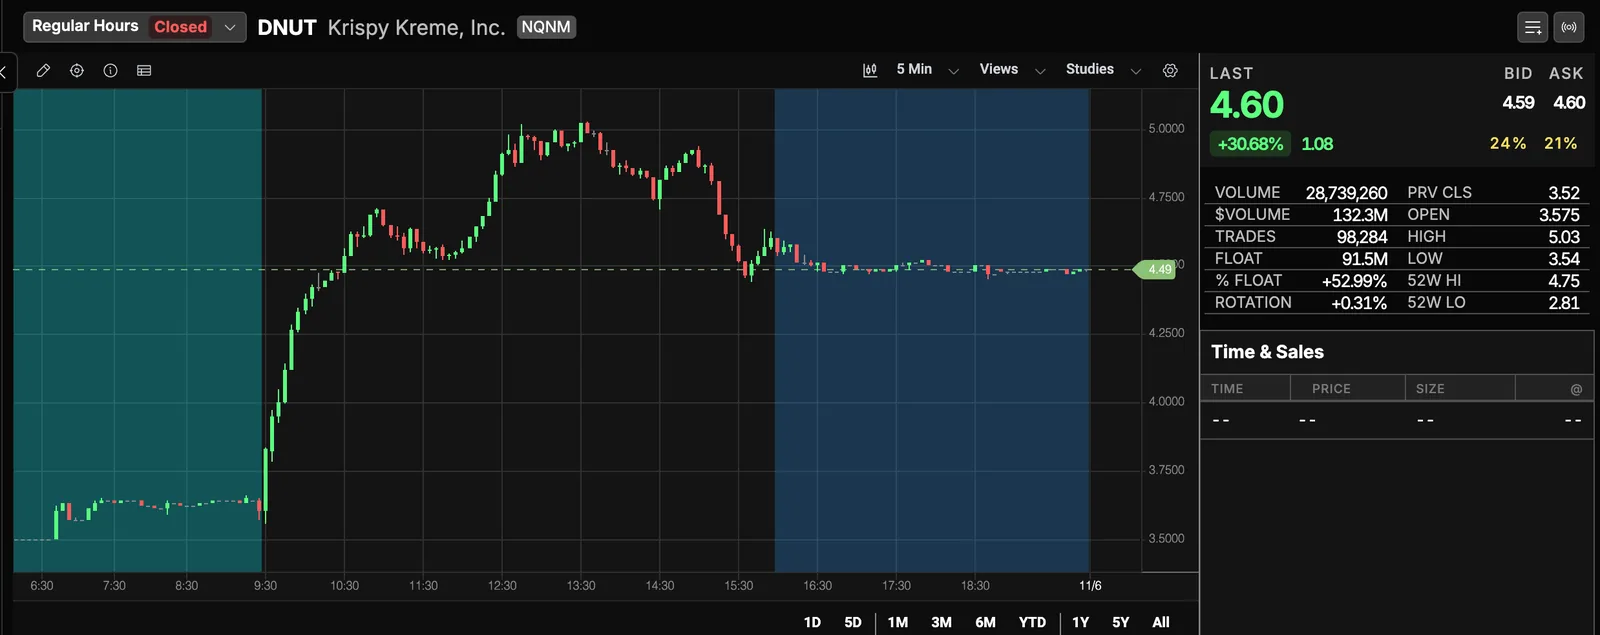
By 3:40 DNUT had given back everything from the noon break, so shares bought at 12:20 and held with no exit plan made nothing. The break was real and the stock still went round trip; the exits are what turned it into a result.
The one that never broke: XERS, the same morning. Xeris Biopharma (XERS) gapped 19.6% at the open on November 5 and set its high of the day, $13.74, within the first few minutes of trading. At 10:11 Scanz had it at $13.59, up 29.9% on 2.73 million shares: right under the high and at the top of a gainers list. It looked like the setup. It was not one, because it never traded above $13.74 again. With no new high there was nothing for the signal to fire on and no trigger under these rules. By 12:30 XERS was near $12.65, about 7% below where it sat at 10:11, and it closed at $13.08.
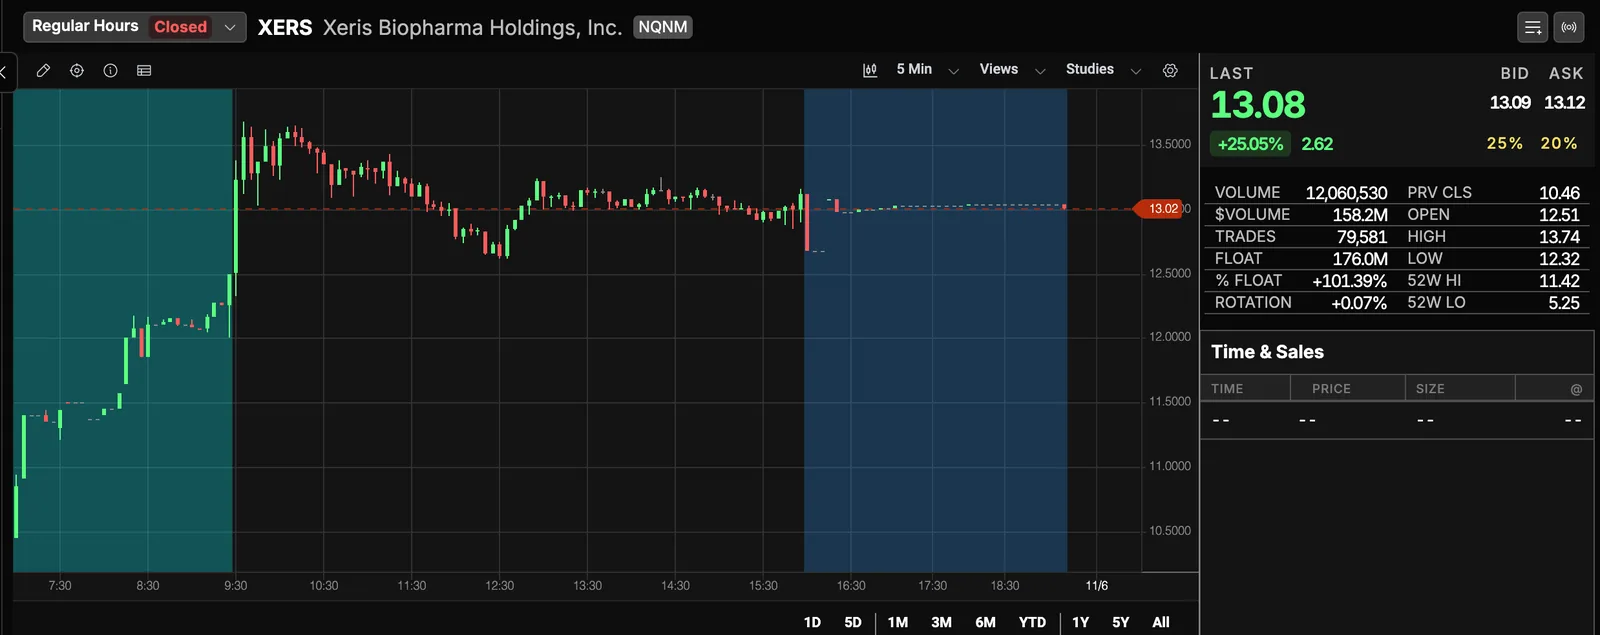
Both stocks are from one session, November 5, 2026. They show how the rules read a real tape, including the trade that lost; two stocks are not a win rate.
When in the day do HOD breaks work, and what changes with float and price?
The time of day changes the odds more than anything else. Thomas Bulkowski looked at when the daily high was set across 55 stocks on 1-minute data: 10% of daily highs came in the first minute, 40% in the first half hour and 49% in the first hour, against 19% in the last hour (ThePatternSite). His sample is 2003–2009 and is not small caps, so treat it as a base rate rather than a small-cap statistic. It still says something useful: most days, the high is in early, so a new high after 10:30 is a stock doing something unusual. That is exactly why it is worth watching, and exactly why it needs real volume behind it.
9:30 to 10:00. New highs come every few seconds in the opening rush, and most of them are the opening range being built. The card takes no break before 10:00: the first 15 minutes build the opening range, and a rest under its high needs at least 15 more. This window belongs to the opening range breakout and gap and go setups; the HOD signal fires constantly here and the rest-then-break structure has not formed yet.
10:00 to 11:30. The window with the most to work with: the opening range is set, the first pullback has happened, and volume is still high, so a break here has the morning’s buyers behind it. That is reasoning from how the day is built, not a measured result; the one break worked through on this page came at 12:20.
11:30 to 2:00. The midday lull. Volume across the market falls, so a stock needs its own reason to break: fresh news, a sector move, a 52-week high above it. DNUT broke at 12:20, but it had rested under the high for 75 minutes first and broke on 3.4 times the rest’s volume. A midday break without that has nothing pushing it.
2:00 to 3:30. Volume comes back into the close and afternoon breaks can run. Research on S&P 500 ETF data found the first half hour’s return predicts the last half hour’s, and more so on high-volume and news days (Gao, Han, Li and Zhou, 2018): a stock that was strong all day tends to stay bid into the close. After 3:30 there is no time left for a trail to work.
Float and price. Low-float stocks under $10 move furthest on a break and fail hardest. Their spreads are wide, a few thousand shares move the price, and they can be halted on the way up: under the Limit Up-Limit Down rules a stock that moves outside its price band and does not come back within 15 seconds gets a five-minute pause (SEC), and a halt at the high can reopen anywhere. Larger floats and higher prices give smaller moves with more orderly pullbacks, which suits the pullback entry. DNUT, with a 91.5 million share float, is in the middle: big enough to trade 28 million shares in a day without gaps in the tape, small enough to move 30%.
The market. A break on a stock moving with its sector and the index has help; one made while the index is falling is fighting the tape. A simple rule for those days: when SPY is under its own VWAP and making lower lows, take breaks at half size or not at all.
Why do high of day breaks fail?
Most do. The setup is a way of choosing which breaks to take and of keeping the losers small, not a way of avoiding them. The ones that fail tend to look the same:
- No rest. Price runs straight into the high and through it with no base. There is no tested level and no sensible stop, and the break is often the top of a spike.
- Falling volume. The break bar is smaller than the bars that made the high. Sellers have stepped away rather than been absorbed, and the first real seller pushes it back.
- Far above VWAP. As a rule of thumb rather than a measured line, a stock trading 15% or more above VWAP has most of the day’s buyers deep in profit and ready to sell into a new high.
- A bigger high just above. HOD Break tracks the regular-session high. If the stock traded higher in pre-market, or a round number or the 52-week high sits a few cents above, the break runs into the next wall of sellers. Osler’s same study found take-profit orders cluster at round numbers, which is the other side of the stops that cluster just beyond them.
- The high was a news spike. A high set in one bar on a headline is often a fill of every buy order at once, not a level built by buyers. That is why the card asks for a rest under the high before a break counts.
- A halt at the high. Small caps can stop trading on the way up and reopen lower. The stop you set does not protect you through a halt.
What the scan cannot see: whether the rest under the high is clean, how thin the offers are above it, whether the spread is tradeable, and whether there is a halt coming. It finds the break; the chart, Level 2 and time and sales decide whether it is one to take.
And the honest base rate for the whole activity. In a study of everyone who day traded Brazilian equity futures for at least 300 days in 2013–2015, “97% of them lost money” (Chague, De-Losso and Giovannetti, 2019). A published 5-minute opening range breakout on the 20 stocks with the highest relative volume was right only 48.4% of the time; its profits came from a minority of large winners (Zarattini, Barbon and Aziz, 2024). Expect to be wrong about half the time; the setup only works if the losses are small and the winners are allowed to run.
The checklist before you take the break
Before the break
- Is the stock up 5% or more today on at least twice its normal volume?
- Is it between 10:00 am and 3:30 pm ET?
- Has it rested under the high for at least 15 minutes, with lows that hold or rise?
- Is the high it is breaking the real high of the day, including pre-market?
- Is there room before the next level (a round number, the 52-week high)?
- Is the break bar's volume at least twice the rest's average bar?
- Is the stop under the rest close enough that the size makes sense?
- Is the stock less than 15% above VWAP?
- Is the spread under a tenth of the risk?
- Is the size right: half when SPY is under its VWAP and making lower lows, and no bigger than the first on a second break?
- Do you know where you take half off (1R) and what ends the trade?
Questions traders ask
What does HOD mean in trading?
HOD is the high of day: the highest price a stock has traded at in the current session. A HOD break is price trading above it. Most scanners and traders mean the regular-session high (9:30 am to 4:00 pm ET), so check whether the pre-market traded higher before calling it the high of the whole day.
What time of day do high of day breaks work best?
The rules here take breaks from 10:00 am to 3:30 pm ET, with mid-morning, once the opening range is set, carrying the most volume. A break after 11:30 is a stock doing something unusual, so it needs a long rest and a break bar at least twice the rest's volume, as DNUT's at 12:20 had.
Should I buy the break or wait for a pullback?
The card buys at the close of the 5-minute bar that clears the high, which gets the better price and more false starts. A pullback that holds the old high filters out more failures and misses the stocks that never come back; DNUT's never came on November 5, 2026.
Where does the stop go on a HOD break?
Under the low of the rest that formed beneath the high: if price gets back there, the reason for the trade is gone.
Does a high of day break need a catalyst?
No rule here requires one. DNUT had one: it reported third-quarter results and raised its revenue guidance at 6:45 am ET, and the buying came hours later, in regular hours. A midday break with no news, no sector move and no help from the index has fewer buyers behind it, which is why the rules ask for a long rest and twice the rest's volume before it counts.
What relative volume and float should a HOD scanner use?
Relative volume of 2 or more is the floor; a tighter small-cap version uses 3 or more. There is no correct float: lower floats move further and fail harder. Scanz's HOD Break - Momentum template starts at 2 times relative volume, 5% up and 250,000 shares, and each value can be changed.
Does the scan include the pre-market high?
The HOD Break - Momentum template uses the regular-session high only, so a stock can fire while it is still under its pre-market high. The New Highs template counts the full day, pre-market and after-hours included. The New High signal can also be set to a 1-minute to 4-hour window, multiple days or a year.
Can a stock give more than one high of day break in a session?
Yes: each new rest under a new high is a fresh setup with its own stop and 1R. Each has fewer new buyers behind it, so the rules here take a second at the same or smaller size and leave a third alone without fresh news.
What is the difference between near the high and a new high?
A stock near its high has not proven anything yet; a new high means buyers paid more than anyone did earlier in the day. XERS on November 5, 2026 sat about 1% under its high at 10:11 am, never broke it, and was about 7% lower by 12:30. The rules here act only on the break.
Is high of day momentum trading profitable?
Not reliably, and this page claims no win rate: these rules have not been tested on a large sample. What they control is the size of each loss, fixed at 1R before the trade; the published numbers on how most day traders do are in the section on why breaks fail.
Does the same setup work short, at the low of day?
The mirror image exists: a stock down big, resting above its low on drying volume, then breaking it on a volume bar. Discover's New Lows template is the bare signal, every new session low with no filters, so copy it and add the mirror of this page's rules: % Change of −5% or less, Relative Volume of 2 or more and 250,000 regular-hours shares. Scanz has no borrow data, so check with your broker that the shares can be shorted before the break, not during it.