What is a red to green move, and why does the prior close matter?
A red to green move is a stock that has traded below yesterday’s closing price today and then crosses back above it. The name comes from the quote screen: quote boards paint a stock red while its last price is under the prior close and green once it is over, so the cross is the moment the color flips.
The line is the prior regular-session close, the 4:00 pm ET closing price that Scanz shows as PRV CLS in the quote header. It is not today’s open and not the last pre-market print. A stock that opens down 5% and rallies 3% off the open is still red; it has not done anything yet.
Who is standing at that line explains why traders watch it:
- Yesterday’s holders. Everyone who bought late yesterday or held overnight is underwater below the prior close and back to even at it. Investors in a study of 10,000 brokerage accounts showed “a strong preference for realizing winners rather than losers” (Odean, 1998), which suggests some sell as soon as they are made whole: supply sitting at the line.
- Today’s shorts. Traders who sold the gap down have their stops above the prior close, the most obvious level on the chart. In currency markets, stop-loss orders were found to “cluster strongly just beyond round numbers”, and prices move faster once those levels trade (Osler, 2003). Nobody has measured the same at a stock’s prior close; it is the mechanism traders describe there, not a tested fact.
- Everyone else. Scanners and percent-change columns all flip sign at the prior close, so a stock crossing it lands on every “up today” list at once.
None of that makes the cross a sure thing. That is why the rules below wait for a 5-minute bar to close above it, not a trade through it.
How do you scan for red to green stocks?
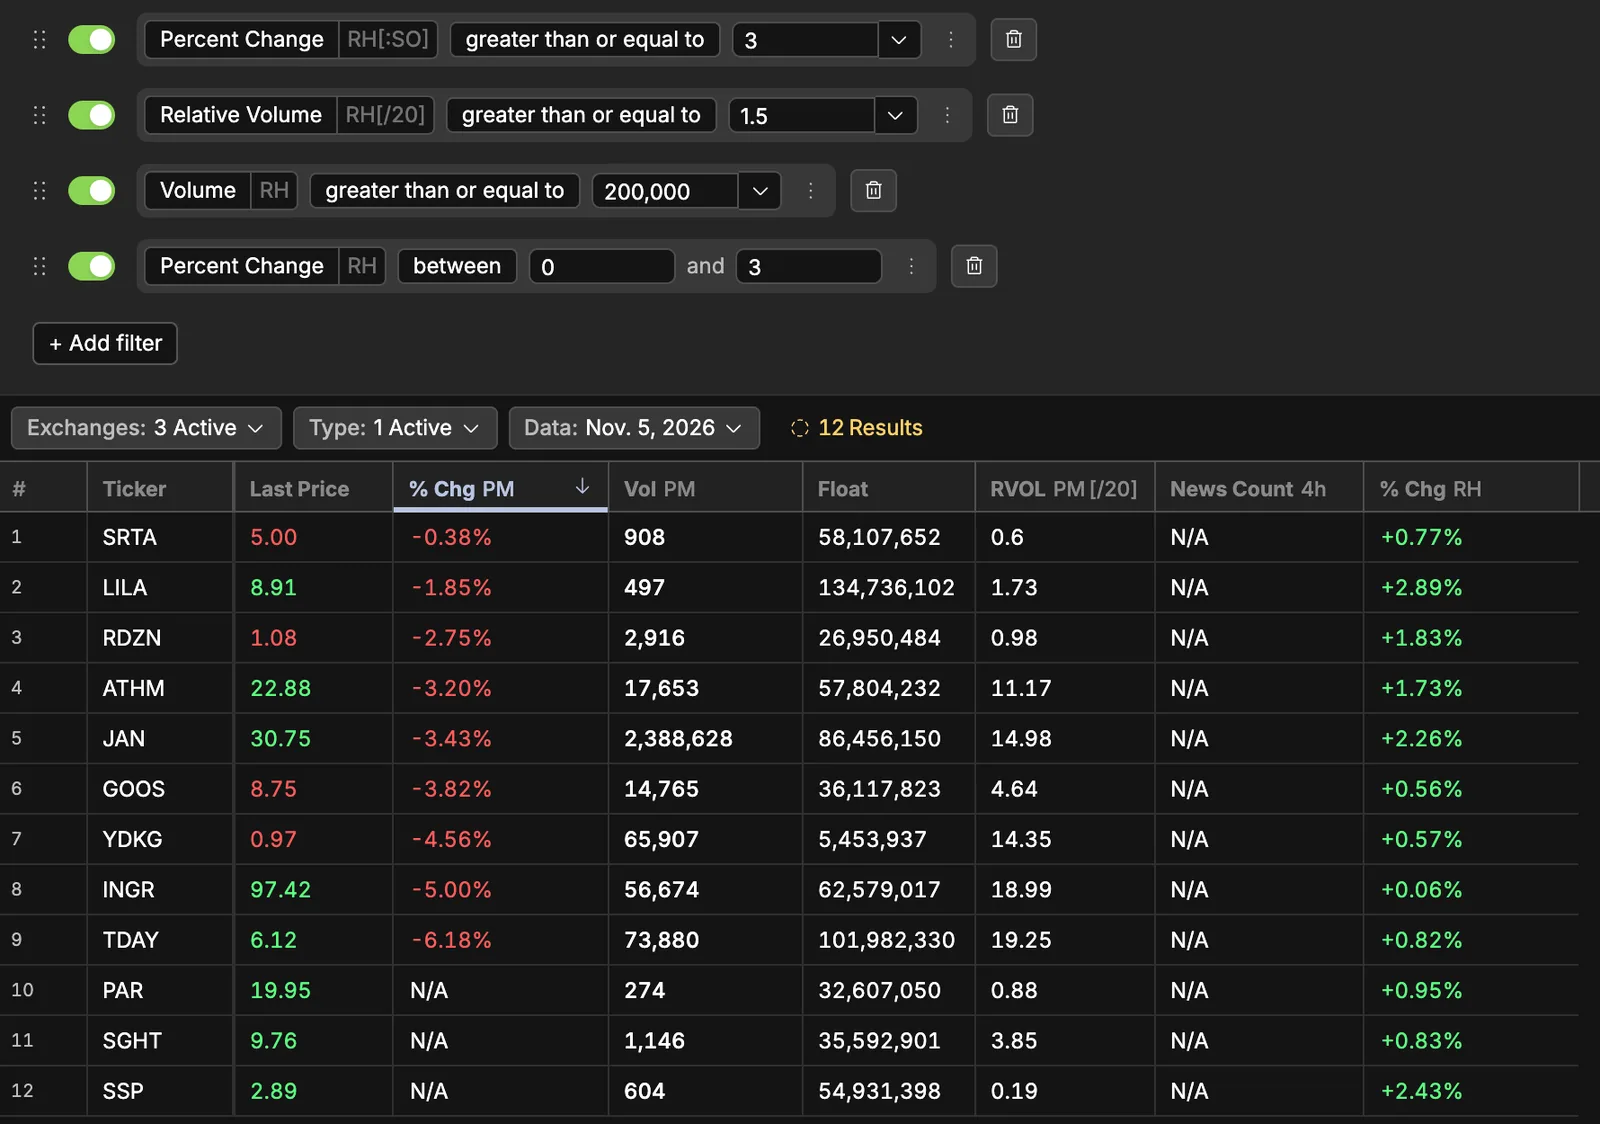
A scanner does two jobs here: find the few stocks that opened red and are climbing back toward the line, and tell you when one crosses. Scanz’s Red to Green template does the first, and two edits make it do the second. In Discover, choose Data Scanner, pick Red to Green and click Use template, then set your copy’s rules to the Your copy values below.
The scan · Data Scanner · Regular hours
Red to Green: the template as stored, and your copy
| Rule | Setting | Why it's there |
|---|---|---|
| Since open (Percent Change, Regular Hours, compared to Session Open) | Stored: ≥ +1%. Your copy: ≥ 2 | Up at least 2% from the open, which, with the next rule, only a stock that opened below the prior close can be. |
| Vs prev close (Percent Change, Regular Hours, compared to Prev Day Close) | Stored: ≤ 0%. Your copy: between 0 and 2 | Your copy holds the stocks that have just crossed, green by less than 2%; stored, it holds the ones still red, which drop off as they cross. |
| RVOL (Relative Volume, Daily, Regular Hours, average of 20 days) | Stored: ≥ 1.5×. Your copy: off before 11:00, ≥ 1.5 from 11:00 | Off in the morning because RVOL measures the session so far against a whole average day (see below). |
| Volume (Regular Hours) | Stored: ≥ 200,000 shares. Your copy: ≥ 100,000 before 11:00, ≥ 200,000 from 11:00 | Enough shares have changed hands to get in and out near the price on the screen; the morning floor is lower because the session is younger. |
| Last Price | Stored: none. Your copy: ≥ 5 | The rules below cannot trade a stock under $5, since the stop has to be at least 10 cents and within 2% of the price. |
7 days of Pro, card required.
What your copy does. The two percent edits together say: green on the day by less than 2%, and up at least 2% from the open, which only a stock that opened below the prior close can be. One that opened at least 2% red matches on its first trade over the line; one that opened less red matches once it is 2% off its open.
RVOL is off before 11:00 because it compares the session so far with an average full day, not adjusted for time of day: at 10:00 am a stock needs a day and a half of volume already, and the template’s card in Discover says it runs from 10:00 am on. INGR, the example below, crossed at 9:55 am with about a quarter of an average day traded (our count against its previous ten sessions, not the template’s 20).
The Activity Log records the match as ENTERED, with the time (Scanner guide). ENTERED fires on a trade, not on a 5-minute close: it is the cue to watch the bar, not the trigger. Give the Activity Log a sound so the cue reaches you, open the chart from the row (QuickView guide), and keep a % Chg RH column, each stock’s change from the prior close, in view.
An alert on one stock. If you already know the name, a Pro Alert does it with one rule: Percent Change compared to Prev Day Close, greater than 0. It runs on Scanz’s servers, notifies you by push or email and moves to Triggered Alerts when it fires (Alerts guide).
What are the entry, stop and exit rules?
The setup on one card
- The line
- Yesterday's regular-session close, the PRV CLS in the quote header. Not the open, not the pre-market.
- Time window
- Triggers from 9:40 am to 3:30 pm ET. The opening 5-minute bar never counts; the earliest trigger is the bar that closes at 9:40.
- Setup
- Opened at least 2% under the prior close and rallying off the low, with 100,000 shares or more traded in the session
- Trigger
- A cross: a 5-minute bar that closes above the prior close after the bar before it closed at or below it, on more volume than that bar
- After a skip
- A skipped cross stays skipped, and so does a stopped one. The next chance is the next cross, after a 5-minute close back under the line.
- Entry
- At the close of the trigger bar: a limit order at that close plus a tenth of the risk, sent as the next bar opens. If it has not filled by that bar's close, there is no trade.
- Stop
- A cent under the low of the trigger bar
- First target
- Half off at 2R, twice the entry-to-stop distance above the entry, or at the prior day's regular-session high if it sits between the entry and 2R. Until then the stop does not move.
- The rest
- Once half is off, trail a cent under each rising 5-minute low. Anything still open goes at 3:55 pm.
- Skip it when
- The price is under $5; the stop is under 10 cents, the spread rule's floor, or more than 2% of the price away; the trigger bar closes more than 1% above the line; the trigger bar's volume is no more than the bar before it; the spread is more than a tenth of the risk
Why each rule is there:
- A close, not a touch. A poke through the prior close that falls back shows the sellers at the line are still there; a bar that closes above it shows buyers held the line for five minutes. INGR’s trigger bar traded 41 cents over the line and closed 6 cents over it.
- Not the opening bar. The first five minutes hold the opening auction, the widest spreads of the day and every overnight order at once, so a cross inside that bar is the open, not a reclaim. GOOS on November 5, 2026 opened 5.2% red, closed its opening bar 2.4% over the line and stayed green until 11:45; the card had nothing to take until it closed back under and crossed again at 2:15 pm.
- The stop. A cent under the trigger bar, because that bar is the evidence: if price takes out its low, the reclaim has failed and you are holding a red stock again.
- The skips. A stop more than 2% away is half the gap on a stock that opened 4% red. A trigger bar that closes more than 1% above the line has usually run from below it in one bar, so its low, and your stop, sit well under the line: you would be buying the pop, not the reclaim. A quote is at least a cent wide, so the spread rule needs a stop of at least 10 cents; with the 2% cap that rules out every stock under $5, which is why the scan carries a Last Price rule, and a $6 stock only fits a stop of 10 to 12 cents.
- Sizing. Divide what you will lose if the stop is hit by the distance from entry to stop: $100 on INGR’s 99-cent stop is 101 shares; on a 12-cent stop in a $6 stock, 833 shares. Results below are in R, multiples of that risk.
- Exits. The stop sits next to the line, so it is small, and a reclaim that holds has yesterday’s range above it: the first target can ask for twice the risk. The prior day’s high is where yesterday’s sellers stood; if it is inside 2R, the half comes off there. The trail starts only once half is off, so the stop under the trigger bar stays the one test until the trade has paid; after that the trail keeps what the stock gives and gets out on the first lower low.
A real example: INGR on November 5, 2026
Ingredion (INGR) reported third-quarter results at 4:03 am ET on November 5, 2026 (the headline’s time in Scanz News & Filings). It had closed at $97.36, traded 5.00% lower in the pre-market and opened at $92.49. Prices and volumes below are read from the Scanz 5-minute chart; times are the start of each bar, volume is shares per bar.
| Time (ET) | What INGR did | What the rules said |
|---|---|---|
| 9:30 | The first bar printed only the open, $92.49, on 6,487 shares | 5.0% under the $97.36 prior close: the setup’s 2% minimum is met. The opening bar never triggers. |
| 9:35 | Dipped to $92.01, the low of the day, then ran to $95.50 on 69,019 shares | More than half the gap back in one bar. Still red. |
| 9:40–9:45 | Climbed to $96.05, then $96.67, on about 26,000 shares a bar | Closing in on the line, 69 cents under it at 9:50. |
| 9:50 | Traded through $97.36 to $97.77 and closed at $97.42 on 31,635 shares | The trigger: a close above the line on more volume than the bar before. Entry $97.42 at 9:55; stop $96.43, a cent under the bar’s low: risk 99 cents, 1.0% of the price, with the close 0.06% over the line. 2R is $99.40. |
| 10:05 | Reached $99.50 | 2R reached: half the position comes off at $99.40. |
| 10:10 | Closed at its high, $99.65 | The trail moves to $99.14, a cent under this bar’s low. |
| 10:15 | Dipped to $98.69 | The trail is hit at $99.14. The trade is over at about +1.9R. |
| 10:40 | Closed at $97.11, back under the line | Shares bought at the cross and never sold are down 0.3R. A second cross, at 10:55, came on less volume than the bar before: skipped. |
| 13:55–16:00 | Fell to $93.80, then recovered into the close | INGR closed at $97.33, down 0.03% on the day. |
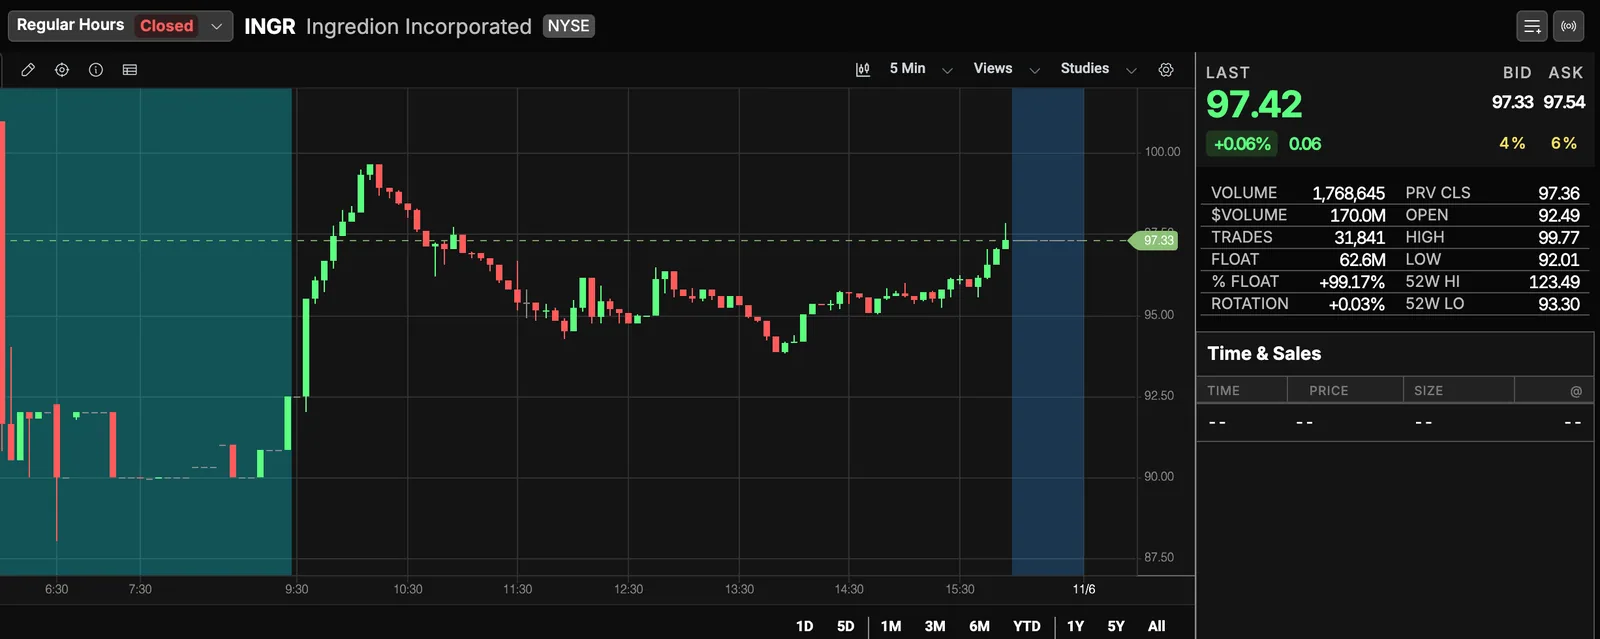
INGR’s cross had everything on the card: a 5% gap on earnings, more than half of it taken back in ten minutes, a trigger bar that closed just over the line on rising volume, and a stop 1% away. By our reading of the bars, the edited copy with the morning settings would have logged INGR as ENTERED during the 9:50 bar, on its first trade over $97.36; 5-minute bars cannot say which minute. The template as stored could not have listed INGR before its cross: 127,082 shares by 9:50, and RVOL against full days nowhere near 1.5.
From there INGR went to $99.65, about 2.25R above the entry, and the trade kept about 1.9R: 2R on the first half, about 1.7R on the rest. The prior day’s high, $100.32, was 2.9R away and never traded. By early afternoon INGR was 3.7% below the entry.
The crosses the rules skipped: TDAY, the same day
USA TODAY Co. (TDAY) reported third-quarter results, a $100 million cost-reduction program and plans to buy back shares at 6:00 am ET on November 5. It had closed at $6.07, opened at $5.73, 5.6% red, and reached the line faster than INGR.
| Time (ET) | What TDAY did | What the rules said |
|---|---|---|
| 9:30 | Opened at $5.73 and closed at $6.05 on 99,004 shares, 2 cents under the line | The opening bar never counts. |
| 9:35 | Closed at $6.255, its high, after a low of $5.96, on 49,861 shares | A cross, skipped: half the volume of the bar before, a 4.9% stop and a close 3.0% over the line. |
| 9:40 | Made the day’s high, $6.31, and closed at $6.12 on 64,341 shares | Still over the line, so no new cross. |
| 9:45 | Fell to $5.97 and closed at $5.98 on 107,128 shares | Back under the line. |
| 9:50 | Closed at $6.08, 0.16% over the line, after a low of $5.94, on 58,131 shares | A second cross, skipped: about half the volume of the bar before and a 2.5% stop. |
| 9:55 | Closed at $6.08 again, after a low of $6.07, on 89,354 shares | Not a cross, since 9:50 already closed over the line; a buyer with a 2-cent stop was out at $6.06 in the next bar, −1R. |
| 13:35 | Crossed again, closing at $6.125, 0.9% over the line, on 23,863 shares against 17,357 | Every rule met but the spread’s: a 7-cent stop is under its 10-cent floor; the 14:00 low of $6.035 would have stopped it, −1R. |
| 14:10 and 14:35 | Crossed twice more, closing at $6.12 and $6.085 after lows of $6.07, on 21,966 and 10,441 shares, each less than the bar before | Both skipped: less volume than the bar before, and stops of 6 and 2.5 cents. |
| Close | $6.12, up 0.82%, after a low of $5.645 at 11:40 |
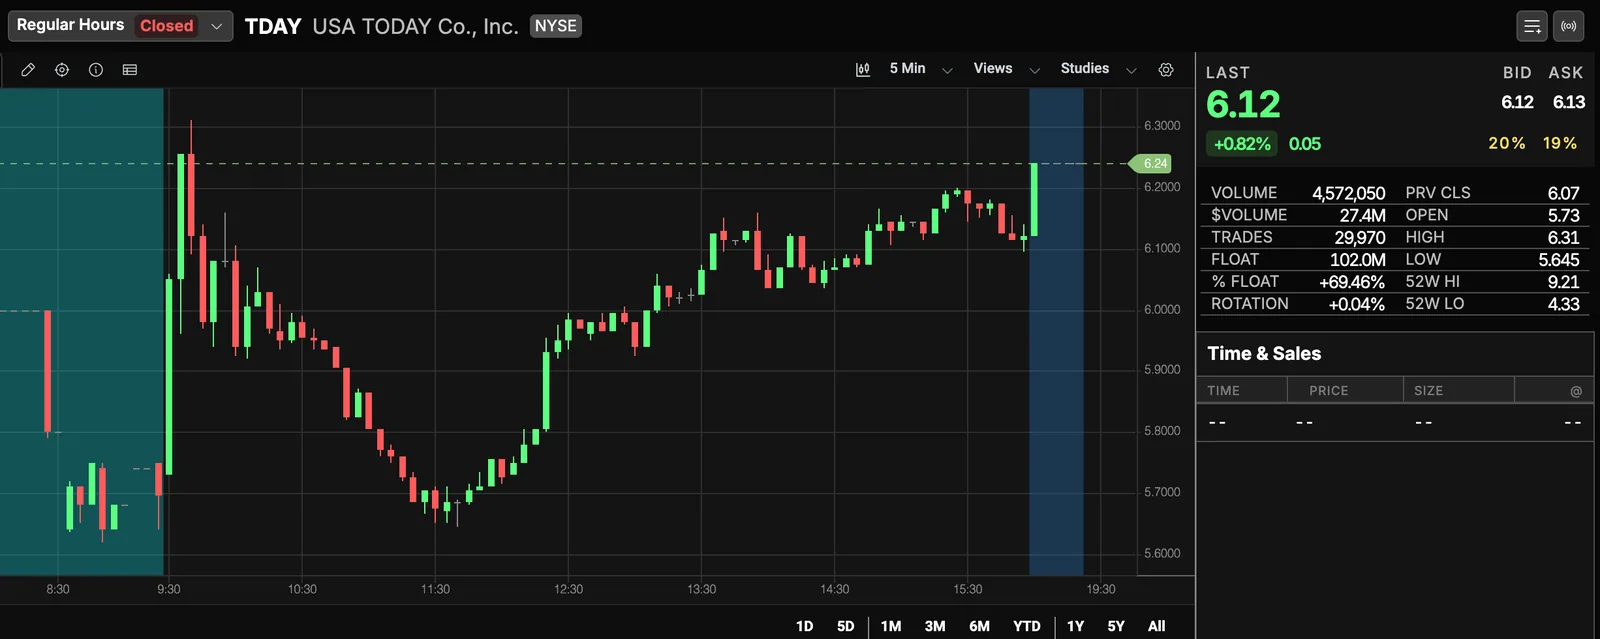
TDAY had the same kind of catalyst as INGR and a bigger gap, and the rules refused all five of its crosses. The best-looking of them, at 1:35 pm, would have lost a full R; so would a buyer of the 9:55 bar, which was not a cross at all, since 9:50 had already closed over the line.
Seven trades from the scan’s twelve stocks: five wins, two losses, +4.4R
Each of the two losses was 1R, the most the stop allows. The list leans one way: the scan was read after the close, so it shows stocks that finished the day green, and a scan watched live would also have listed crosses that failed and stayed red. One session is not a sample.
The capture above, run at 3% and without the $5 rule, listed twelve stocks; the 2% copy on this page would list a somewhat different set, which this ledger does not cover. These are the seven trades the rules took among them, in the scan’s order, from every bar after the opening one that closed back over the prior close; the other 21 crosses on the list’s stocks priced at $5 or more were refused, for the reasons under “What the rules refused”. The bars do not record quotes, so the spread rule is applied only at its 10-cent floor; whether a wider spread would have skipped any of the seven cannot be checked after the fact. Result fills each trade at the trigger bar’s close, with no slippage. The last column fills it instead at the next bar’s open, under the card’s limit order, with the same stop and R measured from that fill: six of the seven next bars opened at the trigger close and GOOS’s a cent under it, so all seven fill and the day comes to about +4.6R.
| Stock | Opened | Cross (ET) | SPY then | Entry | Stop | Exits | Result | Filled at the next open |
|---|---|---|---|---|---|---|---|---|
| LILA | $8.19, 5.4% red | 10:35 | −2.7% | $8.72 | $8.62 | Stopped in the 11:05 bar | −1R | $8.72: −1R |
| ATHM | $21.90, 2.6% red | 14:30 | −3.9% | $22.71 | $22.44 | Half at the prior day’s high, $22.95; the rest trailed out at $22.86 | +0.72R | $22.71: +0.72R |
| JAN | $29.20, 2.9% red | 13:05 | −3.9% | $30.21 | $29.975 | Half at the prior day’s high, $30.60; the rest trailed out at $30.55 | +1.55R | $30.21: +1.55R |
| GOOS | $8.45, 5.2% red | 14:15 | −3.9% | $8.96 | $8.86 | Half at the prior day’s high, $9.015; the rest trailed out at the same price | +0.55R | $8.95: +0.72R |
| INGR | $92.49, 5.0% red | 9:50 | −1.6%, new low | $97.42 | $96.43 | Half at 2R, $99.40; the rest trailed out at $99.14 | +1.87R | $97.42: +1.87R |
| PAR | $18.61, 2.1% red | 10:55 | −3.2% | $19.08 | $18.83 | Stopped in the 11:15 bar | −1R | $19.08: −1R |
| PAR | 14:55 | −3.5% | $19.01 | $18.85 | Half at 2R, $19.33; the rest sold at $19.24 at 3:55 pm | +1.72R | $19.01: +1.72R |
SPY then is SPY’s change from its November 4 close at the trigger bar’s close, from its 5-minute bars in Scanz; “new low” means SPY made a new session low during that bar. SPY closed November 5 down about 4.4%, so every trade here went against a falling index.
What the rules refused
The nine stocks on the list priced at $5 or more crossed their prior close 28 times after the opening bar. The rules took seven and refused 21. Counted by the first rule each cross failed, in the order you check them as the bar closes:
| First rule it failed | Crosses | Which |
|---|---|---|
| Already in a trade | 1 | PAR 15:10 |
| After 3:30 pm | 3 | SRTA 15:50, LILA 15:30, SGHT 15:55 |
| Under 100,000 shares in the session | 4 | LILA 10:15 (76,700), PAR 9:50 (49,639) and 10:05 (71,282), SGHT 9:35 (97,738) |
| No more volume than the bar before | 8 | TDAY 9:35, 9:50, 14:10 and 14:35 (its table above); JAN 12:45; INGR 10:55; PAR 13:10; SGHT 9:45 |
| A stop under 10 cents | 5 | SRTA 13:55 (4 cents), LILA 11:10 (6.5) and 15:20 (4.5), TDAY 13:35 (7), PAR 13:25 (6) |
The 1% and 2% rules were never the first to fail; four morning crosses on TDAY and SGHT failed them as well.
Six stocks gave no trade. RDZN, YDKG and SSP are under $5, and the under-$5 variation below would not have reached them either: RDZN and YDKG trade near $1, under its $2.50 floor, and SSP opened only 1.7% red. SRTA, TDAY and SGHT crossed ten times between them, and the rules refused all ten.
When do red to green moves work, and how do the settings change?
Time of day. Three of the seven trades came before 11:00, where the template needs its morning settings, and four after 1 pm. ATHM is the afternoon version: it opened 2.6% red at $21.90 and reached 1.5 times the average volume of its previous ten sessions around 12:30 (our count; the template averages 20 days) while still under its $22.49 prior close. Its 2:30 pm bar closed over the line on more than twice the previous bar’s volume, and the prior day’s high, $22.95, sat inside 2R, so half came off there. GOOS crossed at 2:15 pm, after two and a half hours back under its line. Same trigger, stop and skip rules; flat by 3:55 pm.
Gap size. The card asks for at least 2% red at the open because a stock 0.5% red can go green on one buy order. A stock that opens 15% red needs a 17.6% rally to reach the line, and by then it is a high of day trade, not a reclaim. The seven trades opened 2.1% to 5.4% red.
Price. Higher-priced, liquid stocks such as INGR cross with 1% stops and orderly bars; for stocks under $5, see the variation below. A share floor is easier for cheap stocks to clear: 200,000 shares is about $1.2 million of TDAY and $19.5 million of INGR. Dollar Volume in the Liquidity filters sets the floor in money instead.
The catalyst. INGR and TDAY both gapped down on quarterly results: the report sets the gap and the first hour decides whether the market believes it. Read the headline in News & Filings before the cross. A gap down on a going-concern warning or a dilutive offering is not the same trade as one on a mixed quarter.
Variations
The retest entry. Wait for the first pullback that holds above the line, buy the break of the pullback bar’s high and stop a cent under its low. Run on the same 28 crosses of November 5, with the card’s time, price and stop rules, it took no trades. Fifteen crosses closed back under the line before a pullback’s high broke, INGR’s and PAR’s 2:55 pm winner among them; on nine, the pullback bar was so narrow the stop came in under 10 cents, JAN’s, ATHM’s and GOOS’s among them; four came too late in the day. It avoided both of the card’s losers and missed all five winners: 0R against +4.4R.
Under $5. One change reaches cheaper stocks: a spread of no more than a cent and no more than a fifth of the risk. The stop then has to be at least 5 cents, and with the 2% cap the price at least $2.50; set the Last Price rule to match.
Green to red, the short. A stock that opened above the prior close falling through it. Research on stocks with heavy retail attention found “a strong tendency for positive returns during the overnight period followed by reversals” (Berkman, Koch, Tuttle and Zhang, 2012), which is the short side’s case. Copy Red to Green and flip it: Since open less than or equal to -2, Vs prev close between -2 and 0. The Gap Fade template, stocks that gapped up 5% or more and now trade 1% or more below their open, is its watchlist. Scanz has no borrow data, so check with your broker before the cross.
Why do red to green moves fail?
| How it fails | On November 5, 2026 | What catches it |
|---|---|---|
| The line is crowded: yesterday’s holders sell at even and today’s shorts defend their entry | LILA’s 9:35 bar traded 13 cents over its line and closed 5 cents under it | The trigger is a 5-minute close over the line, not a trade through it |
| The cross came too fast | TDAY’s 9:35 bar went from 2 cents under the line to 3.0% over it, on half the volume of the bar before, with a 4.9% stop | The close within 1% of the line, the stop within 2%, more volume than the bar before |
| There was no one there | LILA’s first close over the line, at 10:15, came on 2,052 shares, under a third of the bar before; a 1,000-share order would have been half the bar | More volume than the bar before, and 100,000 shares in the session |
| The gap was right: a guidance cut or an offering the market believes rallies into the line and stops | None on this list: it was read after the close, so every stock on it finished green | Read the headline before the cross, the checklist’s second question |
| Every rule passed and it failed anyway | LILA’s 10:35 bar closed 6 cents over the line on 2.6 times the bar before’s volume, with a 10-cent stop; it traded $8.62 within half an hour, −1R, and LILA closed the day up 2.7% | Nothing on the card: the stop holds the loss to 1R |
| The market went the other way | SPY fell about 4.4%; all seven trades went against a falling index | Nothing on the card; see below |
Some traders skip a cross if SPY makes a new session low during the trigger bar. The only test of that rule here is this page’s own, on its seven trades from one day: on November 5 it would have skipped one, INGR at 9:50, the day’s best at +1.87R, and kept both losers, leaving +2.54R instead of +4.41R. One day proves nothing either way, so the rule is not on the card or the checklist.
What the scan cannot see. Why the stock gapped (read the headline), how many shares are offered at the line (Level 2 in the Montage shows the book), and whether yesterday’s close was itself a spike.
The checklist before you take the cross
Before the cross
- Did it open at least 2% under yesterday's regular-session close?
- Do you know why it gapped, from the headline, and is the news something a market can change its mind about?
- Is it after 9:40 am and before 3:30 pm ET, and is this not the opening bar?
- Has the session traded 100,000 shares or more?
- Has a 5-minute bar closed above the prior close after the bar before it closed at or below it, not just traded through it?
- Did that bar trade more volume than the bar before it?
- Is the close less than 1% above the line?
- Is the stop, a cent under the trigger bar's low, within 2% of the price?
- Is the spread under a tenth of the risk, so the stop is at least 10 cents?
- Is your limit at the close plus a tenth of the risk, and will you cancel it if the next bar does not fill it?
- Where is 2R, and is the prior day's high inside it?
Questions traders ask
What is green to red, and can you short it?
The mirror: a stock that opened above the prior close falling through it. Scanz has no borrow data, so confirm with your broker that shares are available before the cross.
How is red to green different from gap and go?
Gap and go trades a gap up continuing through the pre-market high. Red to green trades a gap down reversing back through the prior close: one bets the gap was right, the other that the market has changed its mind.
Is there a red to green scanner or alert?
Yes: Scanz's Red to Green template lists the stocks closing in on the line, and the two edits above log the cross itself.
What is the win rate of the red to green move?
There is no reliable published one. On the 12 stocks the scan listed on November 5, 2026, the rules took seven trades, five wins and two losses, for +4.4R, and each loss was 1R. That list was read after the close, so it holds only stocks that finished green, and it is one day's count. SPY fell about 4.4% that day.
How many of the crosses on November 5 did the rules take?
Seven of 28. The nine stocks on the November 5, 2026 list priced at $5 or more crossed their prior close 28 times after the opening bar. The rules took seven and refused 21: eight for no more volume than the bar before, five for a stop under 10 cents, four with under 100,000 shares in the session, three after 3:30 pm and one while a trade was still open.