Data Scanner
Real-time stock scanner with 65+ filters. Find stocks matching your exact criteria across price, volume, change, technicals, fundamentals, and more.
The Scanner is why traders choose Scanz. While most platforms make you hunt for opportunities, the Scanner brings them to you - updating every 500ms (twice per second) with stocks matching your exact criteria. Define what matters (price range, volume, momentum, float size, technical levels) and the Scanner surfaces every matching stock, instantly.
This guide walks you through mastering the Scanner, from understanding the interface to building sophisticated multi-filter scans that find exactly the setups you trade.
Understanding the Scanner Interface
When you open the Scanner, you’ll see three main areas working together:
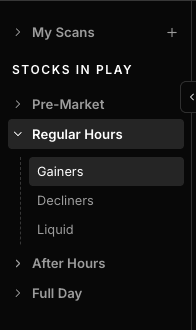
The Scan List holds your saved scans under “My Scans.” Open it from the menu button at the top left of the scan panel (or scan window on desktop). Ready-made scans aren’t listed here - browse them in Discover and click Use template to copy one into My Scans.
The Filter Bar runs horizontally across the top. This is where you build your scan logic - each filter appears as a chip showing the metric, session, operator, and value. Filters combine with AND logic: a stock must pass every filter to appear in results. There is no OR logic between filters - if you need OR conditions (e.g., stocks up 10% OR down 10%), create separate scans for each variation. You can show or hide the full filter bar using the “Show Filters” / “Hide Filters” toggle.

The Results Table displays every stock matching your criteria, updating in real-time. Click any column header to sort. Click any row to open that stock in QuickView for deeper analysis - chart, news, Level 2, and Time & Sales appear in a slide-out panel without losing your scan results.
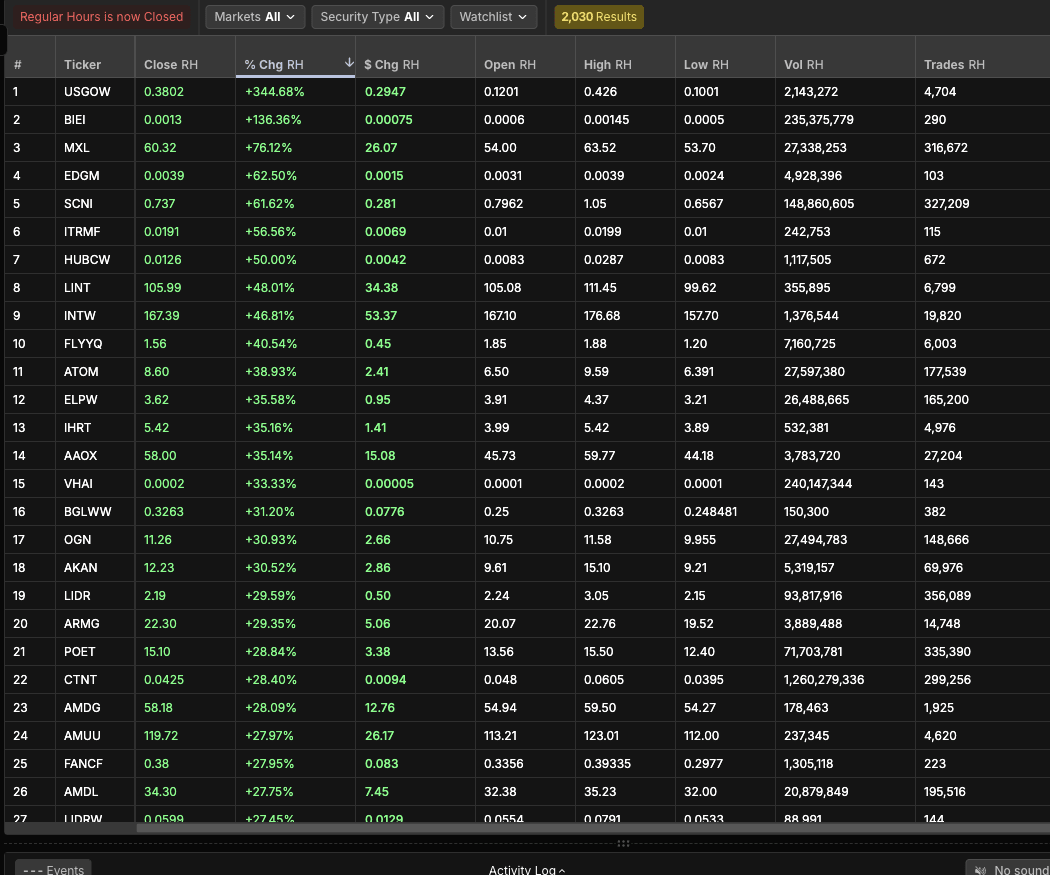
Above the results, you’ll find additional controls: Markets (filter by US exchange — NYSE, Nasdaq, AMEX, OTC; Scanz is US-equities only), Security Type (stocks vs ETFs), Watchlist (limit results to a specific watchlist), and the results count showing how many stocks currently match your criteria. At the far right end of that row, a small download icon sits just before Columns - that’s Export CSV, which saves the whole results table to a spreadsheet file (see Exporting to CSV below).
Trading Sessions
Every session-based filter requires you to specify which trading period to measure. This is fundamental to how the Scanner works - a stock’s “Volume” during pre-market is completely different from its regular hours volume.
Pre-Market (PM) covers 4:00 AM to 9:30 AM Eastern. This is where gapper scans shine. Use PM filters to find stocks moving significantly before most traders are watching. Volume thresholds should be lower here - 50,000-100,000 shares pre-market represents serious interest.
Regular Hours (RH) is the standard session from 9:30 AM to 4:00 PM Eastern. Most of your scanning will use RH filters. Volume expectations are higher, and price action is most reliable during this window.
After Hours (AH) runs from 4:00 PM to 8:00 PM Eastern. Use AH filters to catch earnings reactions and overnight developments. Liquidity drops significantly, so tighten your price requirements to avoid stocks with wide spreads.
Full Day (FD) combines all sessions into cumulative totals. Useful for seeing the complete picture of a stock’s daily activity, regardless of when it occurred.
When you add a session-based filter, you’ll see the session code (PM, RH, AH, or FD) displayed alongside the filter name - something like “Volume RH” or “Percent Change PM”.
Building Your First Scan
Creating a scan is straightforward: add filters one by one until you’re finding exactly the stocks you want to trade.
Starting from Scratch
- Click the ”+ Filter” button
- Select a filter category, then the specific filter
- Choose your operator (greater than, less than, between, etc.)
- Enter your value
- The results update immediately - watch the count change as you tune
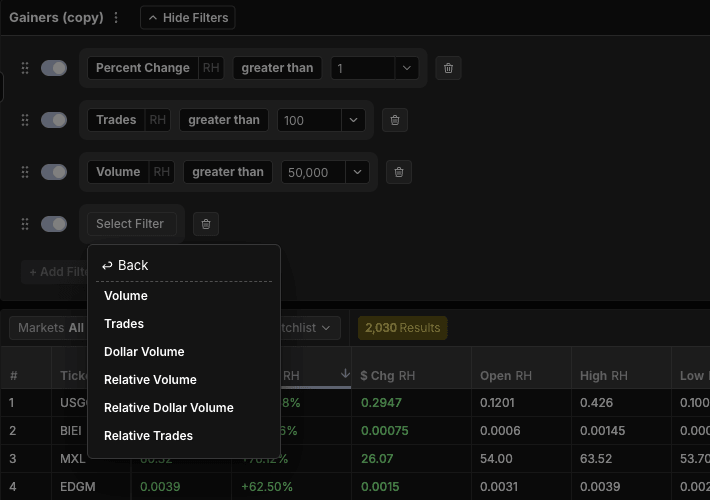
Each filter you add narrows your results. Start broad and add filters until the result count is manageable (10-50 stocks is usually ideal). If you see zero results, you’ve over-filtered - remove or loosen constraints.
Starting from a Template
Discover has ready-made data scans for gappers, momentum, squeezes, breakouts, and more. Open Discover (left sidebar on web, launcher on desktop), find a template close to what you need, and click Use template. Scanz copies it into My Scans and opens the copy with its filters showing. From there, add, remove, or modify any filter to match your strategy.
Templates themselves are read-only, so you always edit your copy, never the original. This is often the fastest path to a working scan - find a template close to what you need, then adapt it.
Saving Your Work
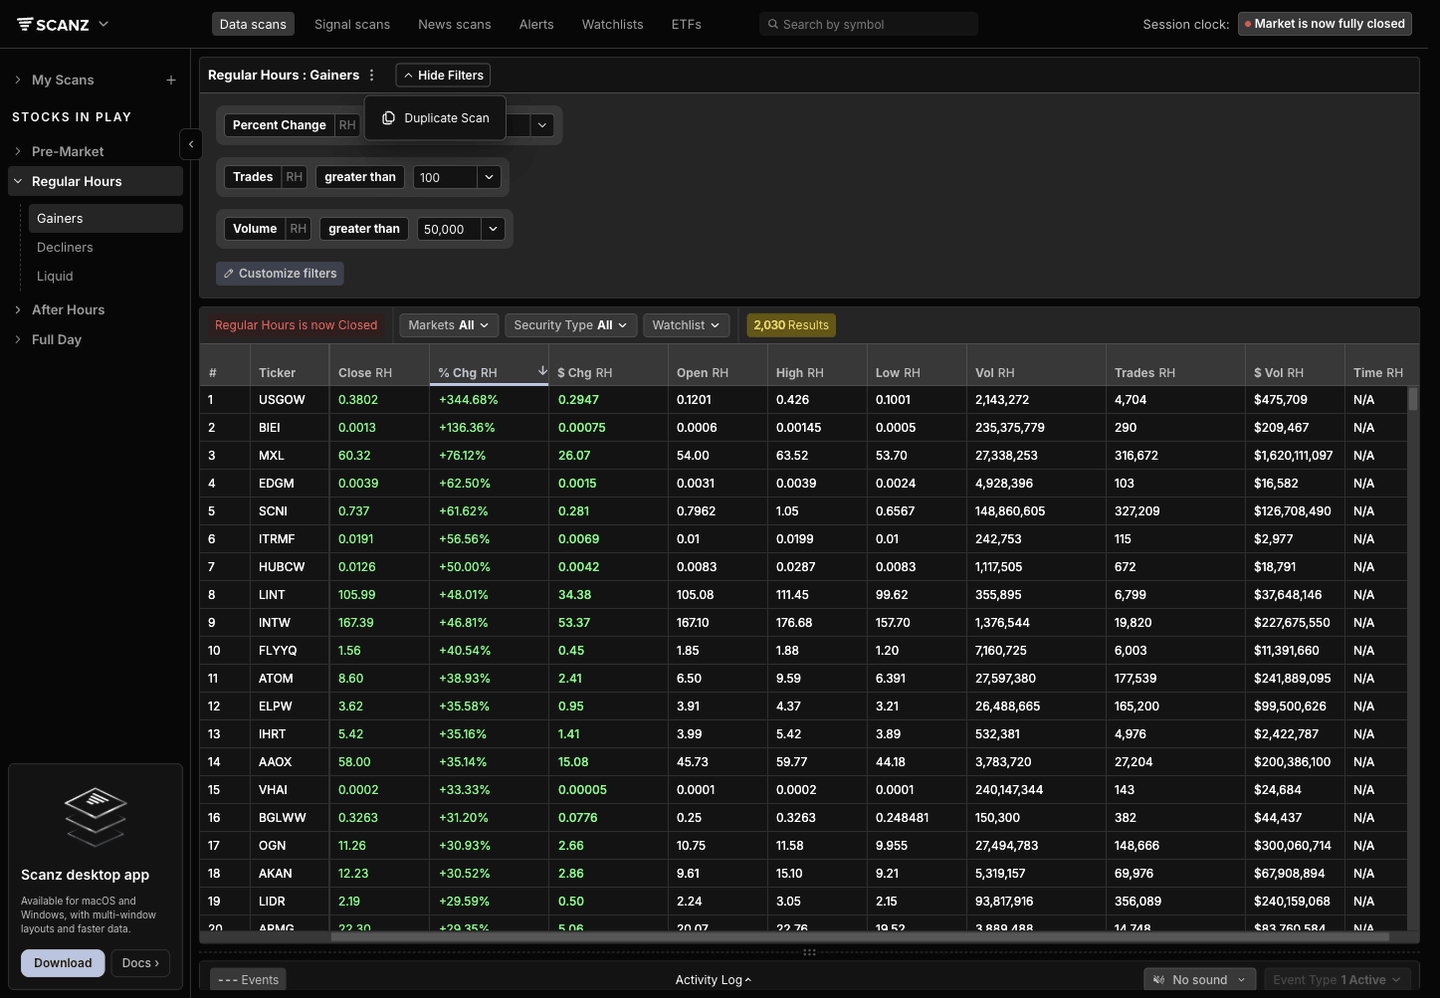
Scan settings auto-save as you work — there’s no Save button. Every filter you add, remove, or adjust persists immediately, and your custom scans stay under “My Scans” across sessions. To keep a variation of a scan alongside the original, use Actions > Duplicate.
Filter Operators
Every filter supports comparison operators that control how values are evaluated:
Greater than (>) and Greater than or equal (>=) find stocks above your threshold. “Volume >= 500000” returns stocks with at least 500K shares traded.
Less than (<) and Less than or equal (<=) find stocks below your threshold. “Price <= 20” returns stocks at $20 or cheaper.
Between specifies a range. “Price between 5 and 50” returns stocks in that window.
Equal (=) matches exact values, primarily used for categorical filters like Exchange.
Comparing to Other Fields
Some filters let you compare against other metrics rather than fixed numbers - this is where the Scanner becomes truly powerful:
- Last Price >= VWAP finds stocks trading above their volume-weighted average price (a sign of strength)
- Close > Open finds bullish candles where the stock closed higher than it opened
- High >= SMA 20 finds stocks whose high touched or exceeded their 20-day moving average
These dynamic comparisons adapt to each stock’s specific values rather than applying a one-size-fits-all threshold.
The Filters: What They Measure and Why They Matter
The Scanner offers 65+ filters across multiple categories. Rather than memorize them all, understand what each category measures and when you’d reach for it.
Price Filters
Price filters establish the basic universe of stocks you’re willing to trade.
Last Price is the current trading price - your starting point for almost every scan. Day traders often set bounds like $1-$20 (volatile enough to move, cheap enough to size into). Swing traders might prefer $5-$200 for better liquidity and tighter spreads.
Open, High, Low, Close capture session price points. Comparing Last to these values reveals where price sits in its daily range. A stock trading near its High suggests strength; near its Low suggests weakness or potential bounce.
Bid and Ask show current quote prices. The spread between them (available as both dollar Spread and percentage % Spread) indicates liquidity - tight spreads under 0.5% mean you can enter and exit without excessive slippage.
% On Bid and % On Ask reveal order flow. High % On Bid means most trades are executing at the bid (selling pressure). High % On Ask means buyers are lifting offers (buying pressure). These filters help gauge the conviction behind price movement.
Range and % Range measure the High minus Low for the session - a volatility indicator. Higher range stocks offer more trading opportunity but also more risk.
Change Filters
Change filters find stocks that are moving - the heart of momentum scanning. There are exactly two: Percent Change and Net Change.
Percent Change measures the move against a baseline you pick with Compared to - Prev Day Close (the default), Session Open, Session High or Session Low. This is your primary momentum filter. Gapper scans typically look for 5-10%+ pre-market change. Intraday momentum scans might use 2-5%+ regular hours change.
Net Change shows the same move in dollars rather than percent - useful when you care about absolute moves regardless of stock price.
There is no separate Gap filter. A gap reading is Percent Change with Compared to: Prev Day Close - the default baseline - so a plain Percent Change already reads the move against the prior close, and it keeps updating all day rather than locking at the open.
There are no separate “Change from Open”, “Change from High” or “Change from Low” filters either - set Compared to instead. Session Open measures intraday progress since the session started: a stock might be up 3% from yesterday’s close but down 2% from today’s open. Session High and Session Low reveal pullback depth or bounce strength - a stock up 10% but currently 5% off its high reads -5 against Session High. These help time entries during trends.
Volume Filters
Volume is the fuel behind price movement. Without volume, moves lack conviction and are more likely to reverse.
Volume counts shares traded during the selected session. Day traders typically require 500K+ for adequate liquidity. Swing traders can work with less but should still ensure enough volume to enter and exit positions cleanly.
Dollar Volume (Volume times Price) provides a truer liquidity measure. A $1 stock trading 1M shares represents $1M of liquidity. A $100 stock trading 100K shares represents $10M. Dollar volume normalizes this.
Trades counts the number of transactions - distinct from volume, which counts shares. High trade count indicates sustained interest from multiple participants rather than a few large block trades.
Relative Volume (RVOL) measures how a stock’s current volume compares to its own typical volume - arguably the Scanner’s most important filter for finding unusual activity. RVOL of 2 means the stock is trading at roughly twice its normal pace; 5+ signals extreme interest.
RVOL is configurable, and the configuration determines what “normal” means:
- Data Interval sets the candle being measured. On Daily, each candle is a full session, so you compare today’s volume against past days. On an intraday interval (1m-1h), each candle is that many minutes.
- Offset sets the baseline. For a true relative-volume reading, set Offset to “Avg. of N candles” - this compares the current candle to the average of the last N candles (e.g. Daily + “Avg. of 10 candles” = today’s volume vs. the average of the last 10 trading days). The other options compare to a single candle: “Previous candle” uses only the one prior candle, and “N candles ago” uses one specific past candle - handy for spotting a jump, but not a measure of typical volume.
- Session (Daily) and Include Extended Hours (intraday) control which trading hours are counted, on both sides of the comparison.
RVOL compares against an average over the period - not the same time of day on previous days. It won’t tell you whether 9:30 AM volume today beats 9:30 AM volume yesterday.
Float Rotation shows what percentage of the tradeable float has changed hands. Above 50% indicates high interest. Above 100% means the entire float has traded at least once today - extreme situations where supply/demand dynamics are most pronounced.
Capital Structure Filters
These filters help you understand what you’re trading.
Float is the number of shares available for public trading - total shares minus insider and institutional holdings that rarely trade. Float is critical for understanding volatility potential. A $10 stock with 5M float can move 50% in a day on modest volume. The same $10 stock with 500M float rarely moves more than 5%.
Low float stocks (under 10-20M shares) are volatile. They move fast when volume arrives because there’s limited supply to absorb buying pressure. This cuts both ways - they can squeeze higher quickly but also dump just as fast.
Shares Outstanding is the total shares issued. Useful for context but less actionable than float for trading purposes.
Market Cap shows the total market value (price times shares outstanding). Useful for filtering by company size: micro-cap under $300M, small-cap under $2B, mid-cap under $10B.
Short Interest Filters
Short interest data reveals potential squeeze setups.
Short Float % shows what percentage of the float is currently sold short. Above 20% is considered heavily shorted. When heavily shorted stocks spike on volume, short sellers rushing to cover can accelerate the move - the famous “short squeeze.”
Short Ratio (also called “days to cover”) divides short interest by average daily volume. A ratio above 5 means it would take shorts 5+ days to cover at normal volume - they’re trapped if the stock runs.
Short Interest provides the absolute number of shares sold short, useful for context alongside the percentage metrics.
Technical Filters
Technical filters let you scan for specific chart conditions across thousands of stocks.
VWAP (Volume Weighted Average Price) is the benchmark price institutions use. Day traders commonly filter for stocks trading above VWAP (bullish) or watch for VWAP reclaims after pullbacks.
RSI (Relative Strength Index, 14-period) measures momentum on a 0-100 scale. Below 30 suggests oversold conditions; above 70 suggests overbought. Contrarian traders scan for extremes.
Moving Averages (SMA and EMA for 9, 20, 50, 200 periods) identify trend direction. Comparing Last Price to these averages reveals whether a stock is above or below key support/resistance levels. Scanning for price crossing above the 20 SMA, for example, catches potential trend changes.
MACD and MACD Signal measure momentum divergence. Positive MACD suggests upward momentum; crossovers generate entry signals.
Bollinger Bands (Upper and Lower) define volatility-based channels. Stocks trading outside the bands are statistically extended and may revert.
ATR (Average True Range) quantifies typical daily movement. Useful for position sizing and setting stop losses appropriate to each stock’s volatility.
Fundamental Filters
While the Scanner excels at technical and momentum scanning, the Financials filters let you overlay basic business criteria: Revenue, Gross Profit, EBITDA, Cash and Debt. Some traders want established businesses only; others specifically seek beaten-down stocks for potential turnaround plays.
There are no per-share or valuation-ratio filters - no EPS, P/E, P/S or P/B - so screening on valuation isn’t possible in Scanz today.
News Filters
News Count is the Data Scanner’s one news filter. It counts the headlines a stock has had inside a look-back window you choose, from 1 minute up to a maximum of 4 hours - there is no daily or 24-hour option. Filtering for stocks with recent news (News Count of at least 1) helps focus on names with catalysts driving their moves. For news older than 4 hours, use the News Scanner, whose feed covers the whole day.
Example Scans
These complete configurations demonstrate how filters work together. Each is ready to use - load it and start finding opportunities.
Pre-Market Gappers
What it finds: Stocks gapping up significantly before market open - potential momentum plays for the first hour.
Percent Change | PM greater than or equal to 10
Volume | PM greater than or equal to 100000
Last Price greater than or equal to 1
Last Price less than or equal to 20
When to use: The pre-market session, 4:00 AM to 9:30 AM Eastern. Watch how gappers behave as the open approaches - those holding their levels often continue; those fading may reverse.
Variations: Add Float <= 20M for more volatile low-float gappers. Lower the percent change threshold to 5% on quiet market days.
Intraday Momentum
What it finds: Stocks with strong momentum during regular hours, confirmed by unusual volume.
Percent Change | RH greater than or equal to 5
Volume | RH greater than or equal to 500000
Relative Volume greater than or equal to 2
Last Price greater than or equal to 2
When to use: 9:45 AM to 3:30 PM Eastern. The Relative Volume filter is critical - it separates stocks moving on conviction from those drifting on light volume.
Variations: Increase RVOL to 3x or 5x for more extreme activity. Add VWAP comparison to find stocks holding above their institutional reference price.
Low Float Runners
What it finds: Small float stocks with volume and momentum - the explosive movers.
Float less than or equal to 15000000
Percent Change | FD greater than or equal to 10
Relative Volume greater than or equal to 3
Last Price greater than or equal to 1
Last Price less than or equal to 20
When to use: Any session. Low float stocks move fast when volume arrives - the limited supply means buying pressure moves price quickly. Higher risk, higher reward.
Warning: Low floats are volatile in both directions. The same dynamics that create 50% squeezes create 30% dumps. Size accordingly.
VWAP Reclaim
What it finds: Stocks pulling back to VWAP then bouncing - a classic institutional entry pattern.
Last Price greater than or equal to VWAP
Percent Change | RH less than or equal to -3 (Compared to: Session High)
Percent Change | RH greater than or equal to 2 (Compared to: Prev Day Close, the default)
Volume | RH greater than or equal to 300000
When to use: Mid-morning through afternoon. VWAP acts as a magnet throughout the day - strong stocks often pull back to touch it before continuing higher. This scan catches that reclaim.
Want a strict crossover? This version uses session-based pullback filters. To require that price was actually below VWAP on the prior candle (a true crossover), use the offset-based VWAP Reclaim recipe in the Filter Reference.
Unusual Volume Alert
What it finds: Stocks experiencing exceptional trading activity - something is happening.
Relative Volume greater than or equal to 5
Volume | FD greater than or equal to 500000
Last Price greater than or equal to 2
When to use: Continuous monitoring. When a stock trades at 5x+ its average volume, there’s usually a reason - news, institutional accumulation, or anticipation of an event. This scan catches unusual activity early, before the move is obvious.
Tips for Better Scanning
Start Specific, Then Broaden
Begin with restrictive filters. If you get zero results, systematically loosen one filter at a time until you find the right balance. It’s easier to relax constraints than to figure out which of 10 loose filters is returning junk.
Match Session to Strategy
Your filters should match when you’re trading:
- Pre-market: Use PM filters, lower volume thresholds
- First hour: Use RH filters, focus on gap and momentum continuation
- Midday: Add stricter volume filters to ensure activity
- Power hour: Same as midday but watch for end-of-day positioning
- After-hours: Use AH filters, expect thin liquidity
Watch the Results Count
A scan returning 500+ stocks is too broad - you can’t possibly evaluate that many opportunities. Aim for 10-50 results by adding filters or tightening values. Quality over quantity.
Create Variations
Build multiple versions of your core scans for different market conditions:
- “Gappers - Hot Market” (10%+ gap)
- “Gappers - Quiet Market” (5%+ gap)
- “Gappers - Low Float” (add float filter)
This lets you quickly adapt without rebuilding from scratch.
Combine Technical and Structural
The best scans blend technical filters (price, volume, momentum) with structural filters (float, market cap). A stock up 20% means different things depending on whether it has 5M float or 500M float.
Multiple Scans at Once
Scanz Web displays one scan per tab. If you want to view multiple scans simultaneously - say, a gapper scan and a momentum scan side by side - use Scanz Desktop. The desktop application supports custom layouts with multiple scanner panels, and you can save these layouts for multi-monitor setups.
The Activity Log
Below the results table, the Scanner has a collapsible panel called the Activity Log. While the results table shows you which stocks currently match your scan, the Activity Log shows you what changed - which stocks just entered your scan and which just dropped out. Think of the results table as a snapshot of “right now” and the Activity Log as a running record of “what just happened.”
Opening the Activity Log
The Activity Log lives in the bottom bar of the Scanner, between the results table and the footer. You’ll see a thin strip with “Activity Log” in the center - click it or drag the resize handle upward to expand the panel. A small grip icon (six dots in a grid) sits on the divider between the results table and the Activity Log, and you can drag it to adjust how much vertical space each panel gets. When the Activity Log is open, the caret next to “Activity Log” points down; click it again to collapse the panel and reclaim screen space for your results.
What the Activity Log Shows
Each row in the Activity Log represents a stock that entered or left your scan. The columns are:
# is the row number, ordered chronologically with the most recent event at the top.
@Time shows the exact timestamp when the event occurred - when the stock entered or exited your scan criteria. During fast-moving markets, you’ll see entries appearing every few seconds.
Ticker is the stock symbol.
Close FD shows the stock’s Full Day closing price at the time of the event, giving you immediate context on price level.
Count tracks how many times this particular stock has entered the scan during the current session. A stock that keeps bouncing in and out of your scan criteria is worth noting - it’s sitting right at the edge of your filter thresholds, which can itself be a meaningful signal.
COND CHG (Condition Change) indicates what type of event occurred - whether the stock entered your scan (ENTERED) or left it (LEFT). So when COND CHG reads ENTERED in the Activity Log, that stock just started matching all your filters at the time shown in @Time.
Event Type Filter
On the right side of the Activity Log toolbar, the Event Type dropdown lets you control which events appear. You can toggle two options independently:
Enter shows events when a stock newly matches all your scan criteria and appears in the results table. This is enabled by default and is usually the most useful - it tells you the moment a stock starts meeting your conditions.
Left shows events when a stock stops matching your criteria and drops out of the results. This can be equally valuable - if you’re watching a momentum scan and a stock drops out, that’s an early signal that the move may be fading.
The toolbar shows “Event Type X Active” to indicate how many of the two event types are currently enabled.
Sound Alerts
The No sound dropdown in the toolbar controls audio notifications. When a new event appears in the Activity Log, Scanz can play a sound alert so you don’t have to watch the screen constantly. Choose from:
- No sound - Silent (the default)
- Sound 1 through Sound 7 - Different alert tones
Each sound option (Sound 2 through Sound 7) has a gear icon for customization. This lets you assign different sounds to different scans so you can distinguish them by ear - a high-pitched chime for your gapper scan and a low tone for your momentum scan, for instance.
The Events Counter
On the far left of the bottom bar, you’ll see a counter (like ”--- Events” when empty, or a number when events are accumulating). This gives you a quick glance at activity without needing to expand the full Activity Log panel.
Practical Tips
Use Enter events to catch moves early. If you have a momentum scan running, an Enter event means a stock just crossed your thresholds - it’s the earliest possible signal within your scan’s criteria. The @Time column tells you exactly when, so you can gauge whether you’re seeing it in real time or catching up on missed events.
Enable Left events for exit signals. When a stock drops out of your momentum scan, it means the conditions that made it interesting are fading. This doesn’t necessarily mean sell immediately, but it’s a data point worth having - especially if the stock leaves quickly after entering.
Watch the Count column for threshold-huggers. A stock that enters and leaves your scan repeatedly (Count of 3, 4, 5+) is hovering right at your filter boundaries. This can mean the stock is consolidating near a level - potentially setting up for a definitive move in one direction.
Use sound alerts during pre-market. When you’re scanning for gappers before the market opens, sound alerts let you focus on research or news while getting notified the moment a new stock meets your criteria. You don’t need to stare at the screen.
Collapse the panel when you don’t need it. The Activity Log takes vertical space away from your results table. During periods of heavy scanning where you’re visually evaluating many stocks, collapse the Activity Log to maximize your results view. Expand it when you want the running feed of changes.
Exporting to CSV
Export CSV saves every row of your scan’s results to a spreadsheet file you can open in Excel, Google Sheets or Numbers. Once your results are in a spreadsheet, you can sort and filter them your own way, add your own notes or calculations, share them with other traders, or keep a dated record to look back on and see which setups actually worked.
Where the Button Lives
Look at the far right end of the row above the results table. Just before the Columns button there’s an icon-only download button - hover it and the tooltip reads Export CSV. The same button appears in the same spot on every table that supports export:
- Data Scanner - your saved scans
- Market Sessions - the Gainers, Decliners, and Most Liquid boards
- News Scanner - headlines, with the columns you’ve set up
- Watchlists - any list you have open
- ETFs - any of the pre-built ETF lists
The Signal Scanner doesn’t have an export button. The Activity Log below the results table isn’t included in the export either - the file is the results table only.
The button only shows on a full-width window. On the phone-width layout of the web app the export isn’t offered, so export from a desktop browser.
What You Get
The file holds the full table of the current scan - every row, not just the rows scrolled into view. If your scan matches 600 stocks and you can see 40 of them, you get 600 rows. Rows come out in the same order the table is sorted.
The columns match what’s on screen: the same columns, in the same left-to-right order, with the same header names. A header that reads Volume (5m) in the table reads Volume (5m) in the file. If you’ve pinned Ticker to the left edge, Ticker is the first column in the export too. That makes Columns the place to shape an export - add the fields you want in the file before you click, and remove the ones you don’t.
Values are written the way the grid formats them - same decimal places, same percent signs, same abbreviated units where the grid uses them. That keeps the file readable at a glance, but it also means a spreadsheet may treat some cells as text rather than numbers. If you plan to do math on a column, check how it came through before building formulas on it.
Symbols you’ve hidden stay out of the file. If a ticker is hidden from the table, it’s hidden from the export as well - unless you’ve switched on Show hidden rows, in which case the file matches what you see.
The file is named after the scan plus a timestamp in your local time: <scan name>-YYYY-MM-DD-HH-MM-SS.csv. A scan called “Pre-Market Gappers” exported at 9:14:05 AM on September 24 saves as Pre-Market_Gappers-2026-09-24-09-14-05.csv (spaces and punctuation in the name become underscores). The timestamp to the second is useful once you start exporting the same scan every morning - the files sort chronologically and you always know when each snapshot was taken.
The file is saved as UTF-8 so it opens cleanly in Excel with no garbled characters. As a safety measure, any text cell that starts with =, +, -, or @ gets a leading apostrophe (') so your spreadsheet shows it as text instead of trying to run it as a formula. Ordinary signed numbers like -2.35% are left alone.
How to Export
- Open the scan you want to export and let the results load.
- Set up the columns you want in the file with Columns (optional - the export uses whatever’s on screen).
- Click the download icon at the right end of the filter row (tooltip: Export CSV).
- Your browser saves the CSV to its usual download location.
Gathering a large scan can take a few seconds while Scanz collects every row. During that time the download icon turns into an X labeled Cancel export. Click it and the export stops - nothing downloads, not even later if the data was already on its way. Leaving the page while an export is running cancels it the same way.
If the Export Fails
When an export can’t finish, you get an Export failed message with a Try again button. It stays up for about 12 seconds, long enough to read it and retry. The message tells you what happened:
- “The scan took too long to gather. It may be a large one — try again, or narrow it first.” Very broad scans (hundreds or thousands of matches) take longest. Try again, or add a filter to shrink the result set.
- “There is no scan running to export.” There’s no active scan in the table. Open a scan first.
- “The scan is still loading. Give it a moment and try again.” You clicked before the results finished loading. Wait for the table to fill in, then retry.
- “The scan could not be exported right now. Try again in a moment.” A temporary problem. Retrying usually works.
Ways Traders Use It
Keep a scan journal. Export your pre-market gapper scan at the same time every morning. After a few weeks you have a dataset of what gapped, how much, and on what volume - and you can check which setups actually followed through, instead of relying on memory.
Do the analysis the scanner can’t. The Scanner filters with AND logic and sorts by one column at a time. In a spreadsheet you can sort by several keys, add your own calculated columns, or color-code rows by your own rules.
Share results, not just scans. There’s no built-in scan sharing, but a CSV is easy to send. Send a trading partner the file along with your filter list and they can see exactly what you were looking at.
Snapshot the close. Export your momentum scan right after the 4:00 PM bell to capture the day’s leaders with their regular-hours numbers, then review them that evening for next-day setups.
What You Can’t Do with Scans
Scans cannot be paused or stopped. There is no pause button. A scan is either saved (and shows live results when you open it) or deleted. If you don’t want to see a scan’s results, simply switch to a different scan or close the tab. Your saved scans remain available in the sidebar whenever you want to return to them.
There is no scheduling. Scans run in real-time whenever you have them open. You cannot schedule a scan to run at specific times.
You can’t scan for halted stocks. There is no halt scanner, halt filter, or halt signal — the scanner doesn’t screen for trading halts or resumptions.
There’s no exclude filter, but you can hide symbols. To keep specific stocks out of a scan’s results, hide them: right-click a row and choose Hide for today or Always hide symbol. The Hidden control in the filter row (it reads Hidden · N) shows what you’ve hidden, and Unhide symbol brings a stock back.
A scan can’t build a watchlist for you. To keep a stock you found, right-click its row and choose Send to Watchlist, then pick one of your watchlists. (See the full list of scanner limits for optionable and borrow-status filters, which also aren’t available.)
Troubleshooting
No results showing Your filters are too restrictive. Loosen values or remove filters one by one. Check that your session filters match the current market period - PM filters won’t show results at 2 PM.
Too many results Add more filters or tighten existing values. Every additional filter narrows results. Consider adding volume, price, or float constraints.
Results not updating Check the session clock in the top right - if markets are closed, data won’t change. Try refreshing the page if you suspect a connection issue.
Saved scan missing Scan settings auto-save, so changes persist on their own — no Save button to click. Check “My Scans” in the sidebar and verify you’re logged into the correct account.
Wrong session data Verify your filter session codes (PM/RH/AH/FD) match your intent. A scan built for regular hours won’t show meaningful data during pre-market.
Can’t find the Export CSV button It’s the icon-only download button at the right end of the row above the results, just before Columns - hover it to see the “Export CSV” tooltip. On a phone-width window the button isn’t shown; widen the window or use a desktop browser. The Signal Scanner has no export.
Export CSV button is greyed out The table hasn’t finished loading its columns yet. Wait for the results to appear, then click again.
“Export failed” message Read the message - it tells you what went wrong. Large scans can take too long to gather (narrow the scan or try again), a scan that’s still loading needs a moment, and a temporary error usually clears on retry. Click Try again right in the message. See If the Export Fails for each message.
The exported file doesn’t exactly match the table The file is a snapshot of the scan at the moment it was gathered, and the scan keeps updating twice a second - a stock that entered or left in between shows up in one and not the other, and prices will have moved. Hidden symbols follow the table: if they’re hidden on screen, they’re left out of the file too.
Related Features
The Scanner connects to everything else in Scanz:
- Signals - Get alerted when stocks enter your scan criteria
- News - View news filtered by stocks in your scan
- Alerts - Set price alerts on stocks you’re watching
- Watchlists - Save interesting stocks for continued monitoring
- QuickView - Analyze any result with chart, L2, and news