Level 2
Real-time order book depth showing every market maker's bid and ask. Available in QuickView and the full Montage view.
Level 2 shows you the order book - every active bid and ask from every market maker and ECN, sorted by price. Where the basic Level 1 quote tells you the best bid and best offer, Level 2 tells you who’s quoting them, how big their size is, and what the next layer of price looks like above and below.
For active traders, especially in fast-moving low-float names, Level 2 is where you read intent. A wall of size on the bid that doesn’t move when price tests it is a buyer holding ground. A bid that flickers in and disappears as price approaches is a fake. The same logic on the ask side tells you where the resistance is real and where it’s window-dressing. Reading the book takes practice; getting access to a clean book takes Scanz.
Level 2 in Scanz lives in two views, with progressively more detail:
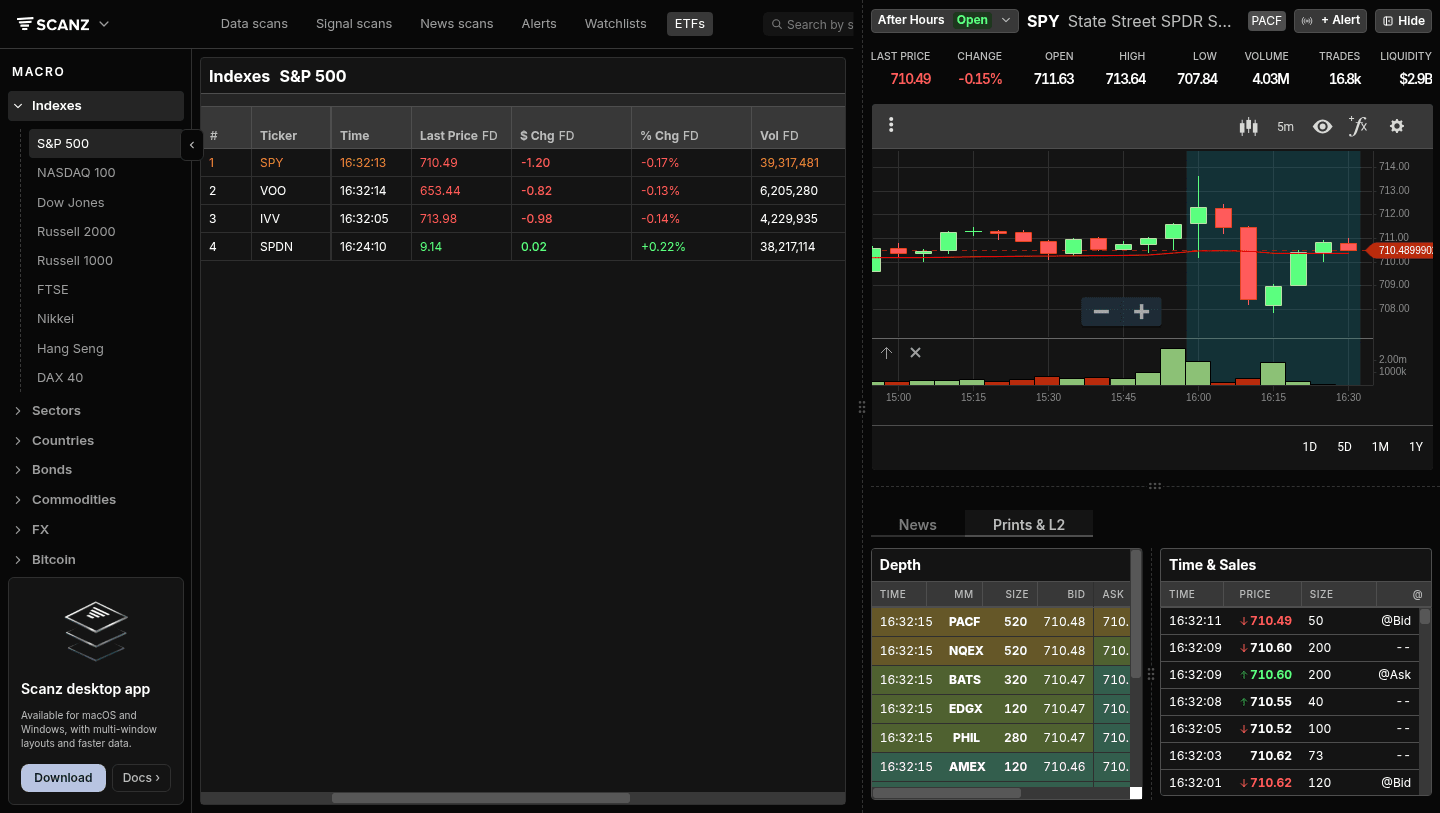
- QuickView → Prints & L2 tab. A compact Depth panel paired with Time & Sales. Good for scanning; one click into any ticker.
- Montage → Level 2 tab. Full-page view with three side-by-side panels: Book Summary (aggregated by price level), Depth (per-MM full bid + ask), and Log (event stream of every quote raise, lower, open, close).
QuickView Level 2
Click any ticker, then click the Prints & L2 tab below the chart in the QuickView panel. The Depth panel sits on the left, Time & Sales on the right.
The Depth view shows the bid side with five columns: TIME (when this MM last quoted), MM (the market maker / ECN identifier), SIZE (their displayed size, in shares ÷ 100 for round-lot quotes), BID, ASK. The columns repeat for the ask side as you scroll right.
You’ll see familiar identifiers: BATS, EDGX, EDGE, NQEX (NASDAQ), MEMX, AMEX, IEX, NYSE, ARCA, plus market makers like PACF, CHIC, R_77, BATY. Each row is one quote at one price from one venue. As price moves, rows slide up the table (improving bids) or get knocked off the top (faded bids).
The Depth list refreshes in real time during market hours. Sort by clicking column headers - sorting by SIZE finds the largest displayed quotes; sorting by BID descending puts the best bid at the top.
Montage Level 2
Right-click a ticker in any list and choose Open in New Tab to land on the full Montage view. The bottom-left tab labeled Level 2 opens three panels side-by-side:
Book Summary (left). Aggregated by price level. Each row is one price, with # MM'S showing how many market makers are quoting that bid level, and the same for asks. This is the cleanest read of “where is the size, by price.” A price level with 5 MMs quoting at 117.20 is meaningfully thicker than one with 1 MM at 117.13 - the summary shows that immediately.
Depth (center). Same per-MM view as in QuickView but bigger. Bid columns on the left (TIME, MM, SIZE, BID), ask columns on the right (ASK, SIZE, MM, TIME) - showing both sides of the book in one continuous read.
Log (right). The event stream. Every quote action gets a row: Raised, Lowered, Opened, Closed, with the MM and SIDE (Bid or Ask). Scroll the Log to see “MEMX raised the bid to 117.20” and “EDGX lowered the ask to 117.30” as they happen. Useful for confirming whether the book is thickening or thinning around current price.
The Time & Sales panel sits separately on the right side of the Montage layout (above the bottom tabs) - that’s where individual prints land. Pair the Log (quote changes) with Time & Sales (executions) and you can see whether posted size is real (gets hit) or fake (vanishes as price approaches).

Reading the Book
A few patterns active traders watch for:
Stacked bids holding price. Multiple market makers at the same bid level, and that level holds across multiple prints, means real demand. If price tests the level and bounces, that’s a tradable read.
Refresh / flicker on the offer. A sell wall of 50,000 shares at 117.50 looks intimidating. Watch what happens as price approaches. If it stays, it’s real - take profit before. If it flickers, gets pulled, then re-posts at 117.55, it was a head-fake. The pull-and-replace pattern is common around round numbers.
Tight spread, deep book. Lots of size on both sides at narrow spreads = liquid; you can trade size without slippage. Wide spread, thin book = you’ll get a worse fill than the chart suggests. Always check Level 2 before sizing up on illiquid names.
One-sided book. Only bids, no offers (or vice versa) at the best price = imbalance. Often precedes a quick move in the direction of the imbalance.
Hidden / iceberg orders. When prints keep hitting at one level but the displayed size barely shrinks, there’s a hidden order absorbing flow. Iceberg orders aren’t shown on Level 2 directly - you infer them from print activity at a level the book doesn’t show.
Level 2 vs Level 1
| Level 1 | Level 2 | |
|---|---|---|
| What you see | Best bid, best offer | Every bid and offer at every price |
| Shows market makers? | No | Yes |
| Shows size at each level? | Top of book only | Full depth |
| Best for | Casual reading, daily charts | Active intraday trading, reading intent |
If you’re trading off daily charts and holding for days or weeks, Level 1 (the standard quote) is enough. Level 2 matters when entries and exits are timed in seconds and a few cents matter on the fill.
Tips for Reading Level 2
Don’t trust the size you see. Displayed size is only what market makers chose to show. Real size often hides behind iceberg orders. Watch what gets filled, not just what’s posted.
Pair Level 2 with Time & Sales. The book shows intent; the tape shows action. Together they tell a story; alone, either one can mislead.
Round numbers attract fakes. Sell walls at $100, $50, $10 are often real, but sell walls at $100.25 are usually held by traders gaming the round-number reaction. The off-round levels with size are more credible.
Pre-market Level 2 is sparse. Many MMs don’t quote in PM/AH. The book you see at 7am is not the book you’ll see at 9:30. Don’t size positions based on a thin pre-market book.
Liquidity dries up at the close. The Log will show MMs closing one by one in the final 5-10 minutes. Don’t be the last one trying to fill a 10,000-share order at 3:58 PM.
Troubleshooting
Depth panel is empty Check the time. Outside RH session, many MMs aren’t quoting. The book repopulates at 9:30 ET. If RH is open and the book is still empty, refresh the page - you may have a stale connection.
Level 2 disappears when I scroll the chart The Depth panel is in the bottom panel of QuickView. If you’ve scrolled away from the Prints & L2 tab back to News, click Prints & L2 to bring it back. The chart and the bottom panel scroll independently.
MM names look unfamiliar The four-letter codes are exchange / ECN / market maker identifiers. Common ones: BATS, EDGX, EDGE (CBOE / Bats family), NQEX (NASDAQ), MEMX (Members Exchange), IEX, NYSE, ARCA. Less-common ones (PACF, CHIC, R_43, BATY, NSDQ) are MMs and dark-pool prints.
Book Summary and Depth show different numbers
Book Summary aggregates - 5 MMs each quoting 100 shares at 117.20 will show as # MM'S = 5, SIZE = 500 in Summary, and as 5 separate rows in Depth. Both views are correct; Summary is the rolled-up view.
Related Features
- Charts - The chart panel that sits above Level 2 in QuickView
- Prints - Time & Sales, the execution feed that pairs with the order book
- QuickView - The slide-out panel that holds Charts, Level 2, and Prints together
Ready to try it? Start your 7-day free trial. No commitment, cancel anytime.