ETFs
Pre-built lists of ETFs covering broad indexes, sectors, countries, bonds, commodities, FX, and Bitcoin. The fastest way to read the market and rotate between themes.
The ETFs view is your shortcut to the macro picture. Instead of building a watchlist of every sector and broad-market ETF you might want to track, Scanz pre-organizes them into named lists you can flip through in seconds: indexes (S&P 500, NASDAQ 100, Russell 2000, FTSE, Nikkei…), sectors (Technology, Financials, Energy, Healthcare…), countries, bonds, commodities, FX, and Bitcoin.
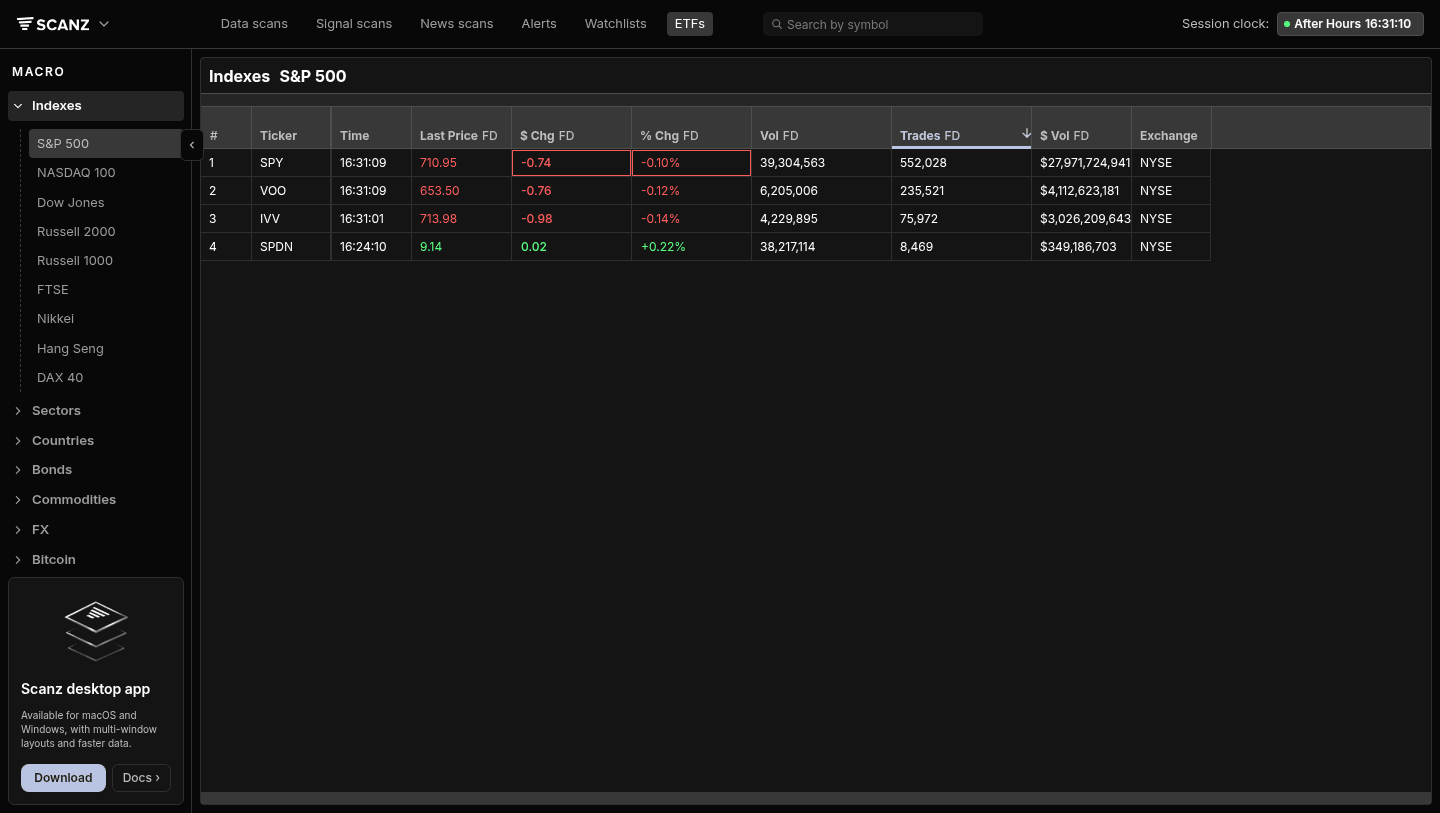
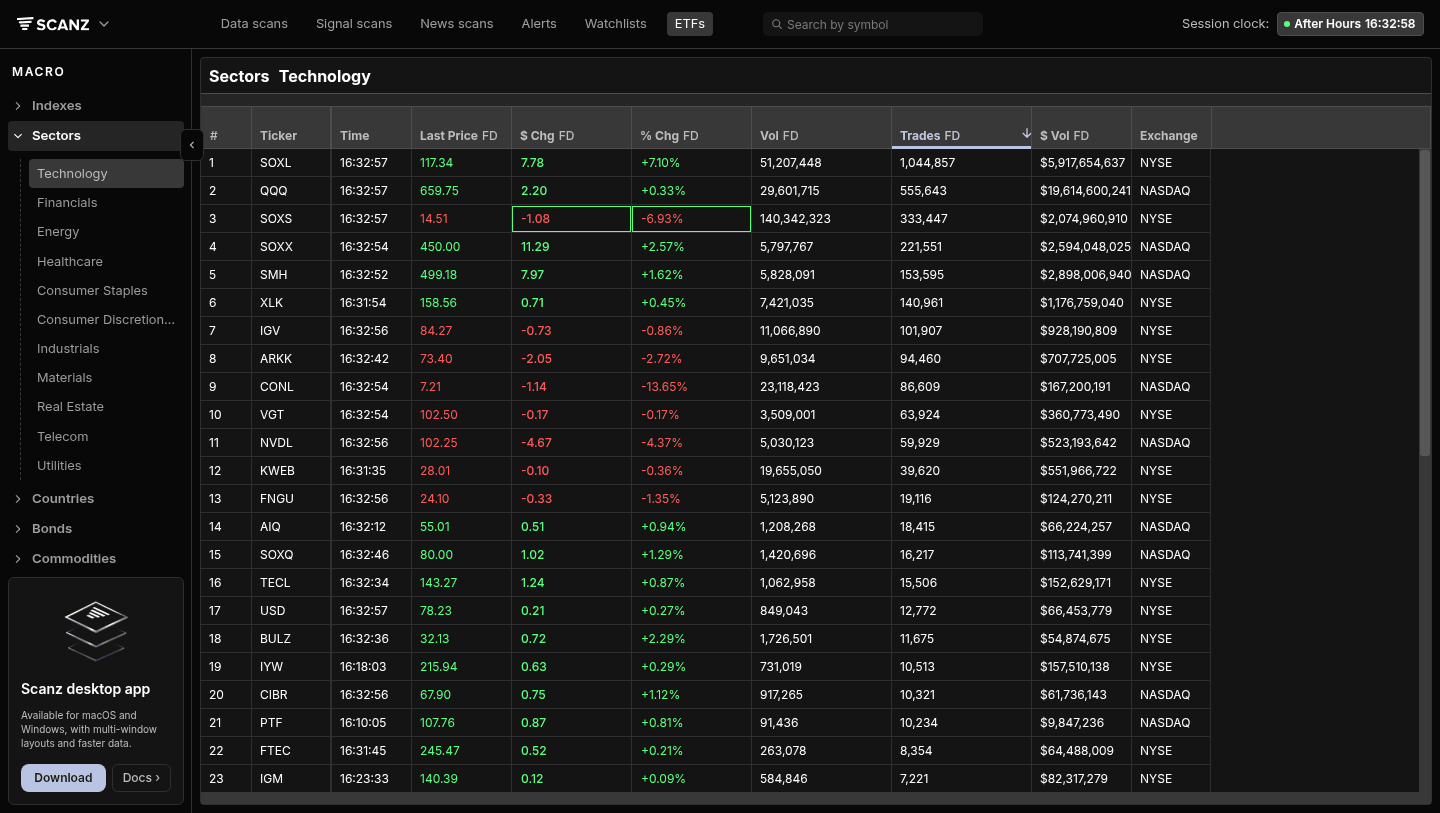
Open it from the top nav and you’re looking at SPY, VOO, IVV, and SPDN within two clicks. Switch to Sectors → Technology and you’re watching SOXL, QQQ, SOXX, SMH, XLK, IGV, ARKK ranked by trade count. Click any ticker and the standard QuickView panel slides open with chart, news, prints, and Level 2 - same as anywhere else in Scanz.
This is most useful at two specific moments: the open, when you want to know which sectors are leading or lagging before you commit to individual names, and during sector rotation, when capital is visibly leaving one theme and entering another. Watching XLK red while XLE is green tells you something the SPY chart alone won’t.
Understanding the ETFs Interface
Click ETFs in the top navigation and the URL changes to /lists/macro - internally this feature is called Macro because it’s about reading the broader market. The left sidebar holds the list categories. The main panel shows whichever list you’ve selected, displayed as a sortable table with real-time data.
The sidebar groups lists into seven categories:
- Indexes - The headline benchmarks: S&P 500, NASDAQ 100, Dow Jones, Russell 2000, Russell 1000, FTSE, Nikkei, Hang Seng, DAX 40
- Sectors - The 11 GICS sectors: Technology, Financials, Energy, Healthcare, Consumer Staples, Consumer Discretionary, Industrials, Materials, Real Estate, Telecom, Utilities
- Countries - International equity ETFs grouped by country
- Bonds - Treasury, corporate, high-yield, and international bond ETFs
- Commodities - Gold, silver, oil, agricultural, broad commodity baskets
- FX - Currency ETFs and dollar-strength trackers
- Bitcoin - Crypto-related ETFs
Click any sub-item to load that list. The header above the table shows where you are - “Indexes S&P 500”, “Sectors Technology” - so you always know which slice of the market you’re reading.
Reading a List
The default columns are tuned for ranking and comparing ETFs:
- Ticker - The ETF symbol
- Time - When the row last updated (real-time during market hours)
- Last Price FD - Most recent print, full day
- $ Chg FD - Dollar change for the day
- % Chg FD - Percent change for the day, color-coded (green up, red down)
- Vol FD - Full day volume
- Trades FD - Number of trades (the default sort - heavy interest floats to the top)
- $ Vol FD - Total dollar volume
- Exchange - Where it lists (NYSE, NASDAQ)
Click any column header to sort. Click again to reverse. Sorting Sectors → Technology by % Chg FD descending tells you which tech-themed ETF is up the most today; sorting by Trades FD tells you where the activity actually is.
The session-suffixed columns (FD, RH, PM, AH) work the same way they do in Scanner - FD is full day, but you’ll see other sessions surface depending on the time of day.
Common Use Cases
Pre-market sector check. Before the bell, click through Indexes → S&P 500, NASDAQ 100, Russell 2000 to see which broad gauge is leading. Then jump to Sectors and rank by % Chg to see which sectors are gapping. By 9:30 you have a thesis instead of a question.
Sector rotation. Sort Sectors by % Chg in opposite directions over a week and you can see capital moving. Energy strong, Tech weak, two days running? That’s a rotation, not noise. The same view on a one-day timeframe catches intraday rotations - useful when you’re trading sector ETFs (XLE, XLK, XLF) directly.
Leveraged ETF scans. The Sectors → Technology list includes the leveraged plays (SOXL, SOXS, TECL, FNGU, NVDL, CONL) alongside the plain-vanilla ETFs. When you want to see which leveraged tickers are moving and where there’s volume to actually trade them, this list is faster than searching one ticker at a time.
Country exposure check. Countries lists let you see where international flows are going - useful when a US-listed ADR moves and you want to confirm it’s the country, not just the company.
Risk-on / risk-off read. Bonds (TLT, IEF, HYG) and FX (UUP for dollar strength) tell you about risk appetite. When TLT is bid and dollar is strong, momentum trades in equities tend to fade faster.
ETFs in QuickView
Click any ticker in any list and QuickView opens on the right with the full single-ticker view: chart, news headlines, filings, Prints & L2. Right-click a row for a context menu with Open (QuickView), Open in New Tab (full Montage view), and Copy Cell (copies the value).
ETFs work the same as individual stocks in QuickView - the chart toolbar, indicators, drawing tools, Time & Sales, and Depth panels all behave identically. The only thing you’ll notice is that filings tend to be sparse (ETFs file annual reports, not quarterly earnings) so the News tab is usually more useful than Filings.
For a deeper dive, see the QuickView guide.
ETFs vs Watchlists
These two features overlap, so it helps to be clear about when to use which:
Use ETFs when:
- You want curated, pre-built coverage of the macro picture
- You don’t want to maintain a list yourself
- You’re checking sector rotation or broad market breadth
- You want to compare leveraged ETFs in one view
Use Watchlists when:
- You have your own custom basket (your favorite sector ETFs, your own thematic plays)
- You want to mix ETFs with individual stocks
- You want to use the list as a filter elsewhere in Scanz (Scanner, News)
Many traders use both: ETFs for the daily macro check, a personal Watchlist of the 10-15 ETFs they actually trade.
Tips for Reading ETF Lists
Sort by Trades FD, not by % Chg. A 5% move on an ETF that traded 200 times means almost nothing. The Trades column floats actually liquid, actually moving names to the top. Once you’ve narrowed to the active ones, then sort by % Chg.
Watch the leveraged ETFs against the unleveraged. If SOXL is up 8% but SOXX is up 1.2%, the math works (SOXL is roughly 3x SOXX). If SOXL is up 8% and SOXX is up 4%, something is off - usually overnight gap math, sometimes a rebalancing day. Knowing the relationship makes mispricings obvious.
Use bonds as a sentiment cross-check. When equity sectors are mixed but TLT is screaming up, the move you’re seeing in stocks is probably a flight-to-safety bid, not a directional thesis. Save the trade for tomorrow.
Don’t trade ETFs by name alone. “Real Estate ETF” sounds homogeneous but XLRE, VNQ, IYR, and SCHH have different concentrations. Open QuickView and check the chart before assuming they all look the same.
Troubleshooting
The list looks empty or stale ETF data updates during market hours. Outside RH/PM/AH sessions some rows will show old prices. Check the Time column - if every row shows the same stale time, the market is closed for that asset (FX trades around the clock; US ETFs don’t).
A specific ETF I want isn’t here The ETFs view is curated, not exhaustive. If your ETF isn’t in any list, add it to a Watchlist and you’ll get the same real-time view there.
The chart on a leveraged ETF looks wrong long-term Leveraged ETFs decay over time due to daily rebalancing. The 1Y or 5Y chart on SOXL won’t track 3x the SOXX 1Y chart - that’s expected behavior, not a data issue. Use leveraged ETFs for short-term moves only.
Related Features
- QuickView - The slide-out panel that opens when you click any ETF ticker
- Watchlists - Build your own ETF lists alongside individual stocks
- Scanner - Scan for ETFs by adding a Security Type filter
Ready to try it? Start your 7-day free trial. No commitment, cancel anytime.