What is an episodic pivot?
An episodic pivot is a stock that gaps up on unexpected good news, on very heavy volume, after a long stretch of doing little. Kristjan Kullamägi, who trades as Qullamaggie, defines it as “a gap up of 10% or more” and names earnings and earnings guidance as the catalysts he focuses on (how to master a setup: episodic pivots; his three setups). He says he learned the setup from Pradeep Bonde, who writes as Stockbee and has published on episodic pivots since at least 2007 (Stockbee, 2007).
Why it works. A stock that has gone sideways for months is one nobody is watching: the price reflects low expectations and few holders care. A report that beats those expectations, or a contract or approval the market did not see coming, changes what the company is worth in one night. Funds that need to own the new story cannot buy their full position in a day, so they keep buying for days and weeks. Bonde ties the setup to post-earnings-announcement drift, the documented tendency of stocks to keep moving in the direction of an earnings surprise after the report (Stockbee, 2010). The gap is the first day of that repricing. The volume is the evidence that big money is doing it.
What makes it different from a gap and go. A gap and go is a day trade: in at the open, out by the close. Kullamägi holds an EP for as long as it trends. His example on his setups page is NVDA’s 2016 earnings gap, which he describes as a move that lasted about six months; he says big moves usually take “weeks and months” (FAQ). The scanner’s job is day one: getting the gap, the volume and the news in front of you while the opening range is forming. Everything after day one happens on the daily chart.
This page describes the method as Kullamägi publishes it, with each point linked to where he says it. Scanz has no affiliation with him, and he has not reviewed or endorsed this page.
How do you find an episodic pivot with a scanner?
Day one is decided in the first 15 to 20 minutes, so the list has to exist at 9:30 ET. Kullamägi’s own routine during earnings season is to start checking for earnings winners gapping up before the open, then look at the big gappers and what is moving them (FAQ). In Scanz the starting point is a Data Scanner template in Discover, True Gap 5%+. These are its rules exactly as Discover stores them.
The scan · Data Scanner · From 9:30 ET
True Gap 5%+
| Rule | Setting | Why it's there |
|---|---|---|
| Open RH greater than Close RH[-1] | by more than 5% | A true gap: today's regular-session open is at least 5% above yesterday's close. A stock that only drifted up during the day does not qualify; one that opened higher does. |
| Volume (RH) | ≥ 100,000 | Enough regular-hours shares that the gap is being traded, not just quoted. |
| Trades (RH) | ≥ 100 | At least 100 separate prints, so a few block trades cannot put a stock on the list. |
All three rules count regular hours, so the list fills from the 9:30 open. Before the open, the Pre-Market Gappers template (up 3% or more pre-market on 100,000 pre-market shares and 200 trades) is the watchlist; see the pre-market scanning guide.
The template is wider than the setup on purpose: it finds every real gap of 5% or more. An EP needs a bigger gap, the volume and a story.
The EP copy. Click Use template, which copies the scan to My Scans for you to edit, then change one rule, add two, and add one column.
The scan · Data Scanner · 9:30 to about 10:00 ET
True Gap 5%+, episodic pivot copy
| Rule | Setting | Why it's there |
|---|---|---|
| Open RH greater than Close RH[-1] | by more than 10% | Changed from 5 to 10 in the Percent box: Kullamägi's minimum gap for an EP. |
| Volume (RH) | ≥ 100,000 | Unchanged. |
| Trades (RH) | ≥ 100 | Unchanged. |
| Relative Volume RH[/20] | ≥ 1 | Added. Today's regular-hours volume against the average day of the last 20, set the way the RVOL Leaders template sets it. Because the reading is not time-of-day matched, it reaches 1.0 the moment the stock has traded a full average day. By 9:50 ET that is his volume test. |
| Last Price | ≥ 5 | Added. Not one of Kullamägi's written rules: the examples on his setups page (NVDA, FSLR, BB) are established companies repricing on news, and sub-dollar runners gap on other things. On November 20, 2026, below, every stock that survived the other rules without it was priced under $1.05. |
| News Count (4h), as a column | shown, not filtered | Added with the Add column button, so the headline count sits beside each gap without removing anything. As a rule it would drop every gap on a report released after yesterday's close, below. |
Relative Volume and Last Price are in the filter library under Liquidity and Price; News Count is under News. Set Relative Volume's Data Interval to Daily, its baseline to the average of 20, and Session to Regular Hours; the rule then reads RH[/20], as it does in the RVOL Leaders template.
The trial is 7 days of Pro, free, card required. It renews on the plan chosen at sign-up, Starter at $89/month or Pro at $199/month, unless you cancel in the app. Starter includes the Data Scanner and the News Scanner but runs one scan at a time; running this scan beside a news scan needs Pro.
Why Relative Volume at 1. Kullamägi calls volume “the #1 thing to focus on” for an EP, and says the stock should ideally trade its average daily volume in the first 15 to 20 minutes, preferably with the heavy volume already showing pre-market (how to master a setup). He gives no multiple like 3x. Scanz’s Relative Volume is today’s volume so far divided by the 20-day average, with no adjustment for time of day (filter reference). So at 9:50 a reading of 1.0 means exactly his test: an average day’s shares in 20 minutes. A stock that only reaches 1.0 at noon is on the list at noon, but it failed the test. To see only the heaviest, raise the rule to 2 or 3; the RVOL Leaders template uses 3.
Why News Count is a column, not a rule. News Count looks back 1 minute to 4 hours, and no further (filter reference). At 9:30 a 4-hour window reaches back to 5:30 am. That catches a report released before the open, but not one released after yesterday’s close, and that is when many companies report: both examples below did. As a column, the count tells you which gaps have a fresh headline without hiding the ones whose news came out last evening; for those, search the ticker in the News Scanner, which shows the stock’s headlines going back weeks (news guide). On a morning when every report you care about came out before 5:30 am, turning the column into a rule (News Count ≥ 1) shortens the list. Either way it counts headlines and cannot tell a beat-and-raise from a law-firm notice; reading the news is your job, and the news trading guide covers how.
What no filter checks. Two of Kullamägi’s conditions have no filter in Scanz. The neglect test, whether the stock went sideways for three to six months, is a look at the daily chart; the chart’s 6M button shows it, and the Montage shows the 52-week high and low beside the previous close. The quality of the report, earnings and sales growth against expectations, is in the release itself: Scanz has Revenue as a filter but no earnings estimates or surprise data.
What are Kullamägi’s episodic pivot rules?
The episodic pivot as Kullamägi teaches it
- Catalyst
- Unexpected good news. Earnings and guidance are the ones he focuses on; he also lists regulation, FDA and biotech results, contracts and partnerships, and sector moves. For earnings, ideally triple-digit year-over-year growth in earnings and sales.
- Gap
- 10% or more from yesterday's close.
- Volume
- Massive near the open. Ideally the stock trades its average daily volume in the first 15 to 20 minutes, or faster.
- Before the news
- Neglected: sideways for three to six months or more, not already up big. He usually avoids a stock that had a recent EP.
- Entry
- The break of the opening range high after the first 1-minute candle. He may add on 5-minute highs. Missed it? Buy the 5-minute or 60-minute high instead.
- Stop
- The low of the day, and no wider than 1 to 1.5 times the stock's average daily range. If the low of the day is further away, the trade is too wide.
- Risk
- Usually 0.3% to 0.5% of the account per trade, rarely more than 1%.
- Exit
- Trail the stop with the 10- or 20-day moving average once the trade is up past the initial stop.
- Holding
- As long as the trend holds: days to weeks, sometimes months.
- Skip it when
- The gap is under 10%; the volume is not there by the first 15 to 20 minutes; the stock sells off after the gap; it already ran in the months before; the stop at the day's low is more than 1.5 average daily ranges away.
Sources for the card: catalyst, gap, volume, neglect, entry and stop are from how to master a setup: episodic pivots and the EP section of his three setups; the trailing stop is from the EP section of the setups page; risk per trade is from his FAQ.
Why the opening range high. The first minute of an EP is a fight between holders taking the gap and buyers arriving on the news. Its high is where the first wave of sellers won. A break above it says buyers absorbed that supply. In his words, there is “no need to be first in”: the 5-minute and 60-minute highs are later entries on the same logic, with a stop that is often further away (how to master a setup).
Why the low of the day. If the stock trades below the low it made on the day of the news, the market has rejected the news. There is nothing left to wait for. The 1 to 1.5 times average daily range cap keeps a wide first day from turning a normal-size position into an outsized loss: size the position from the distance to that stop, not the other way round.
Why a moving-average trail, and what about selling into strength. The 10- and 20-day averages give a trend room to breathe for weeks. On the setups page, the rule of selling a third to a half of the position after three to five days and moving the stop to break even is written in the breakouts section, not the EP section. Many traders apply it to EPs too; he does not state it as an EP rule, and the EP section asks readers to develop their own sell rules.
Where the scanner stops. Scanz does day one: the gap, the volume pace, the headline, the opening range on a 1-minute chart, Time & Sales. Days two onward are daily-chart decisions against a moving average, which any charting package handles; Scanz charts have a Studies menu too, but this is not a setup that needs a real-time scanner after the first morning.
Real examples: the True Gap list on November 20, 2026, and FOSL on November 11
What True Gap 5%+ listed at 11:59 am ET on November 20
This is the template as Discover stores it, run on November 20, 2026, with three columns added beside the results: the stock’s pre-market high, Relative Volume RH[/20] and News Count over 4 hours. It listed 32 stocks.
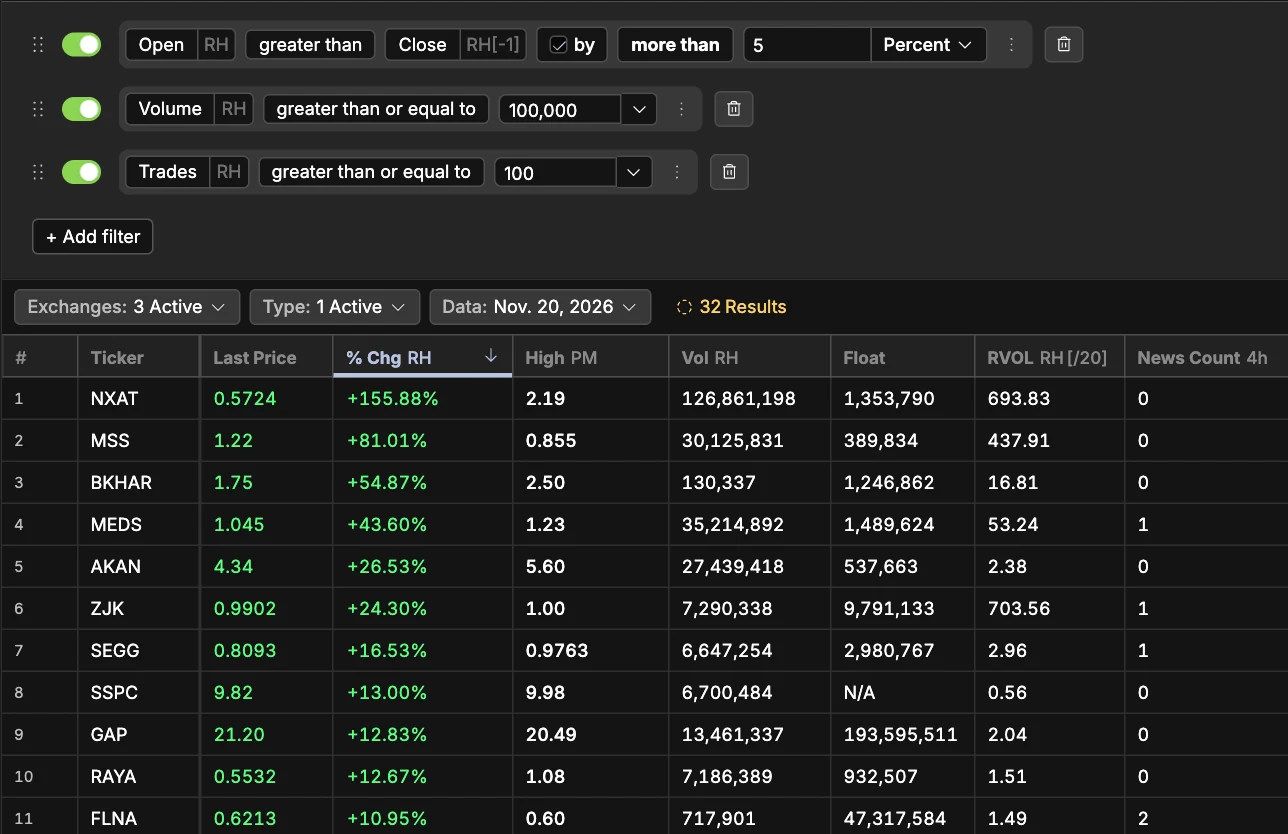
Run the EP copy’s rules over those 32 rows and the list shrinks to one. The capture shows the change since yesterday’s close, not the open, so the first step below uses “still 10% or more above yesterday’s close at noon” in place of the gap rule.
| Test, applied to the 32 rows | Stocks left | Who |
|---|---|---|
| Still up 10% or more at 11:59 | 12 | NXAT, MSS, BKHAR, MEDS, AKAN, ZJK, SEGG, SSPC, GAP, RAYA, FLNA, LABT |
| and Relative Volume RH[/20] at 1 or more | 10 | SSPC (0.56) and LABT (0.70) drop out |
| and Last Price at $5 or more | 1 | GAP. The other nine were priced between $0.55 and $4.34 |
Eight of the 32 were trading below yesterday’s close by noon, VWAV the furthest at −71.30%: they opened 5% or more higher and were sold. That is the first failure in the section below, on the list in real time.
GAP is the one to look at. Two stocks over $5 were still up 10% at noon. SSPC was up 13.00% on a Relative Volume of 0.56, a gap without the volume. Gap Inc. was the other: $21.20, up 12.83%, on 13,461,337 shares, a Relative Volume of 2.04, so already twice its average day by noon. Its third-quarter results were filed with the SEC with a release dated November 19, ahead of a 5:00 pm ET call (Gap Inc. release, SEC). Its News Count column reads 0: the release is far outside a 4-hour window at noon, and at 9:30 too. Had News Count been a rule, the copy would have dropped GAP and kept four stocks priced from $0.62 to $1.05 (MEDS, ZJK, SEGG and FLNA, the only gaps up 10% with volume and a headline in the window). That is why it is a column.
GAP is also a lesson in reading the report. The release shows diluted EPS of $0.86 against $0.62 a year earlier, flat comparable sales, and a lower adjusted full-year outlook. Kullamägi’s ideal is triple-digit growth in earnings and sales; this is not that. Two numbers from the capture matter too. Its pre-market high was $20.49, about 9% above the previous close of about $18.79 that its 12.83% change implies, so whether it opened 10% higher, the EP copy’s gap rule, is not visible in this capture. And the neglect test is a daily-chart check this capture does not show. The scan put GAP in front of a trader at the open; whether it is an EP is the trader’s call under the rules above.
A gap that fails the neglect test: FOSL, November 11, 2026
Fossil Group released its third-quarter results at 4:05 pm ET on November 10, 2026, over GlobeNewswire, and raised its 2026 guidance, with worldwide net sales now expected at $980 million to $990 million (the release, on Finviz). By 9:15 am ET the next morning the stock was trading 26% above the previous close.
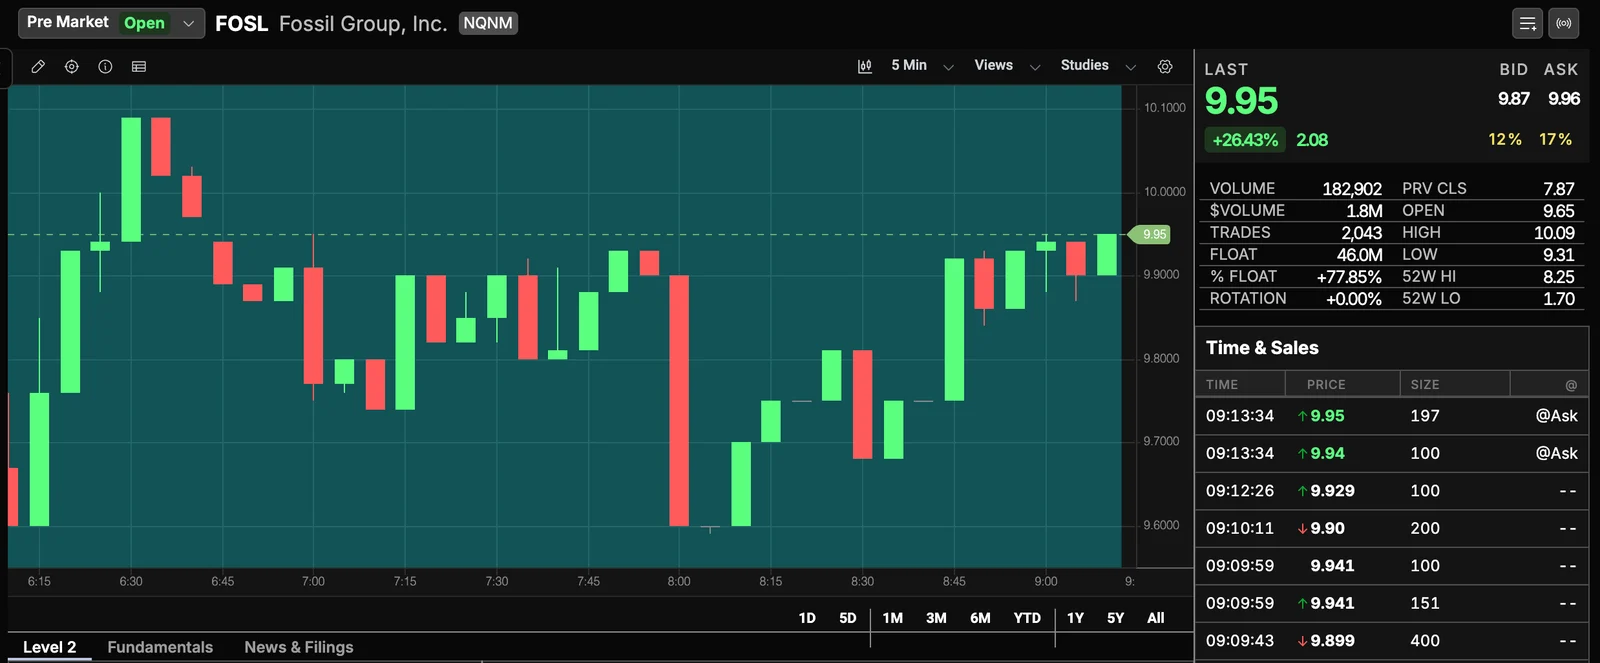
On the first three tests FOSL qualifies: a catalyst (results and raised guidance), a gap well above 10%, and real pre-market volume. On the fourth it does not. The stats panel shows a previous close of $7.87 against a 52-week low of $1.70: before the report the stock had already risen more than fourfold within the year and closed within 5% of its 52-week high. Kullamägi’s point about this is direct: a stock that ran in the three to six months before the news was not neglected, and the run suggests the good news was not a surprise (his three setups). Under his rules this is a big gap on good news, not an EP, and a trader following them passes.
The scan cannot do this test. At $7.87 and up 26%, FOSL passes the EP copy’s gap and price rules, and would be listed after 9:30 once the volume came. Only the chart, or the 52-week numbers in the Montage, rules it out.
How does the episodic pivot change: Bonde’s version, missed entries and delayed reactions?
Pradeep Bonde’s version. Bonde, the source Kullamägi credits, frames EPs around neglected small caps: in his 2010 explainer he prefers floats under 25 million shares, best under 10 million, and calls earnings EPs the easiest to understand and act on (Stockbee, 2010). Kullamägi notes his own 10% definition “may differ from Pradeeps”. For Bonde’s small-cap version, add a Float filter (for example, less than or equal to 25,000,000) to the EP copy.
Missed the 1-minute opening range. Kullamägi’s answer is the next level up: the 5-minute high, or the 60-minute high. The stop is still the low of the day, so a later entry carries a wider stop and a smaller position for the same risk.
Small caps and the open. He notes that on smaller stocks the heavy volume can come a few minutes after the open rather than pre-market (how to master a setup). On the EP copy that shows as Relative Volume climbing through 1.0 between 9:35 and 9:50 rather than at the bell.
Delayed reaction. A “delayed reaction” EP, a stock that holds its gap and breaks out days or weeks later, is part of Bonde’s taxonomy, not something Kullamägi teaches under that name. It is a breakout from the post-gap range, and a gap scan will not find it; a stock that gapped last week is no longer gapping.
Earnings season. EPs cluster. Kullamägi says they mostly occur in a concentrated three to four weeks each quarter (how to master a setup). Outside those weeks the EP copy is often empty, and an empty list is the correct answer.
Why do episodic pivots fail, and what can’t the scan see?
- The gap gets sold. Strong numbers are not enough if holders use the gap to sell; Kullamägi’s setups page makes this point directly. A stock that breaks below its day-one low has failed. The low-of-day stop is how the rules handle it.
- The stock was not neglected. A gap after a long run is often the last leg, not the first. FOSL above is the example.
- The news is not news. A reprint, a recap or an “investigation” notice counts as a headline. News Count cannot tell them apart.
- The volume never arrives. A 15% gap on an ordinary day’s pace is a gap, not an EP. Relative Volume under 1.0 at 9:50 says so.
- The stop is too wide. A first day with a range of three or four normal days leaves no sensible stop at the low; his cap of 1.5 average daily ranges means skipping it.
- What the scan cannot see: whether a report beat estimates (Scanz has no estimates data), whether the stock was neglected (no filter for “sideways”), trading halts (no halt data in Scanz), and anything that happens after day one.
Kullamägi says it takes several earnings seasons of study to trade EPs well; his two posts give 3 to 4 seasons and 4 to 8 seasons. Neither post publishes a win rate, and neither does this page.
The checklist before an episodic pivot
Before you take the opening range break
- Is there a real, new catalyst, ideally earnings or guidance that beat what the market expected?
- Did it open 10% or more above yesterday's close?
- Has it traded its average day's volume in the first 15 to 20 minutes (Relative Volume RH[/20] at 1.0 or more by about 9:50 ET)?
- Did the stock go sideways for three months or more before the news, without a recent EP?
- Is the low of the day no more than 1 to 1.5 average daily ranges below your entry?
- Is the position sized so a stop at the low of the day loses 0.3% to 1% of the account?
- Is the plan after day one written down: trail with the 10- or 20-day moving average?
Questions traders ask
What is an episodic pivot in trading?
A stock that gaps up on unexpected news, usually earnings, on very heavy volume, after months of going nowhere. Kristjan Kullamägi uses a minimum gap of 10%. The idea is that the surprise starts a repricing that lasts weeks or months, so the gap is day one of a swing trade.
Who came up with the episodic pivot?
Pradeep Bonde (Stockbee) has written about episodic pivots since at least 2007. Kristjan Kullamägi says he learned the setup from Bonde and made it one of his three core setups, with his own 10% gap definition.
Where does the stop go on an episodic pivot?
Kullamägi puts it at the low of the day of the gap, and keeps it no wider than 1 to 1.5 times the stock's average daily range. If the low of the day is further away than that, he passes or waits for a tighter entry.
How long do you hold an episodic pivot?
As long as the trend holds. Kullamägi trails the stop with the 10- or 20-day moving average, and his best-known example ran for about six months. It is a swing trade, not a day trade.
Is an episodic pivot the same as a gap and go?
No. A gap and go is a day trade on a pre-market gapper, closed the same day. An episodic pivot uses a similar first-morning entry but holds for days to weeks, and it asks for a bigger gap, a real catalyst and a stock that was neglected before the news.
Does every earnings gap count as an episodic pivot?
No. The gap has to be 10% or more, the volume has to be heavy from the open, and the stock should not have run up in the three to six months before. An earnings gap on a stock already near its highs fails the last test.
How do you scan for episodic pivots?
Start with a gap scan at the open, then check volume pace and news. In Scanz that is the True Gap 5%+ template with the gap raised to 10%, Relative Volume (20-day average) at 1 or more, Last Price at $5 or more, and News Count as a column. The neglect test and the quality of the news are read by hand.
What is a delayed episodic pivot?
A term from Pradeep Bonde's work for a stock that gaps on news, holds, and breaks out days or weeks later. It is a breakout from the range after the gap, so a day-one gap scan will not list it.