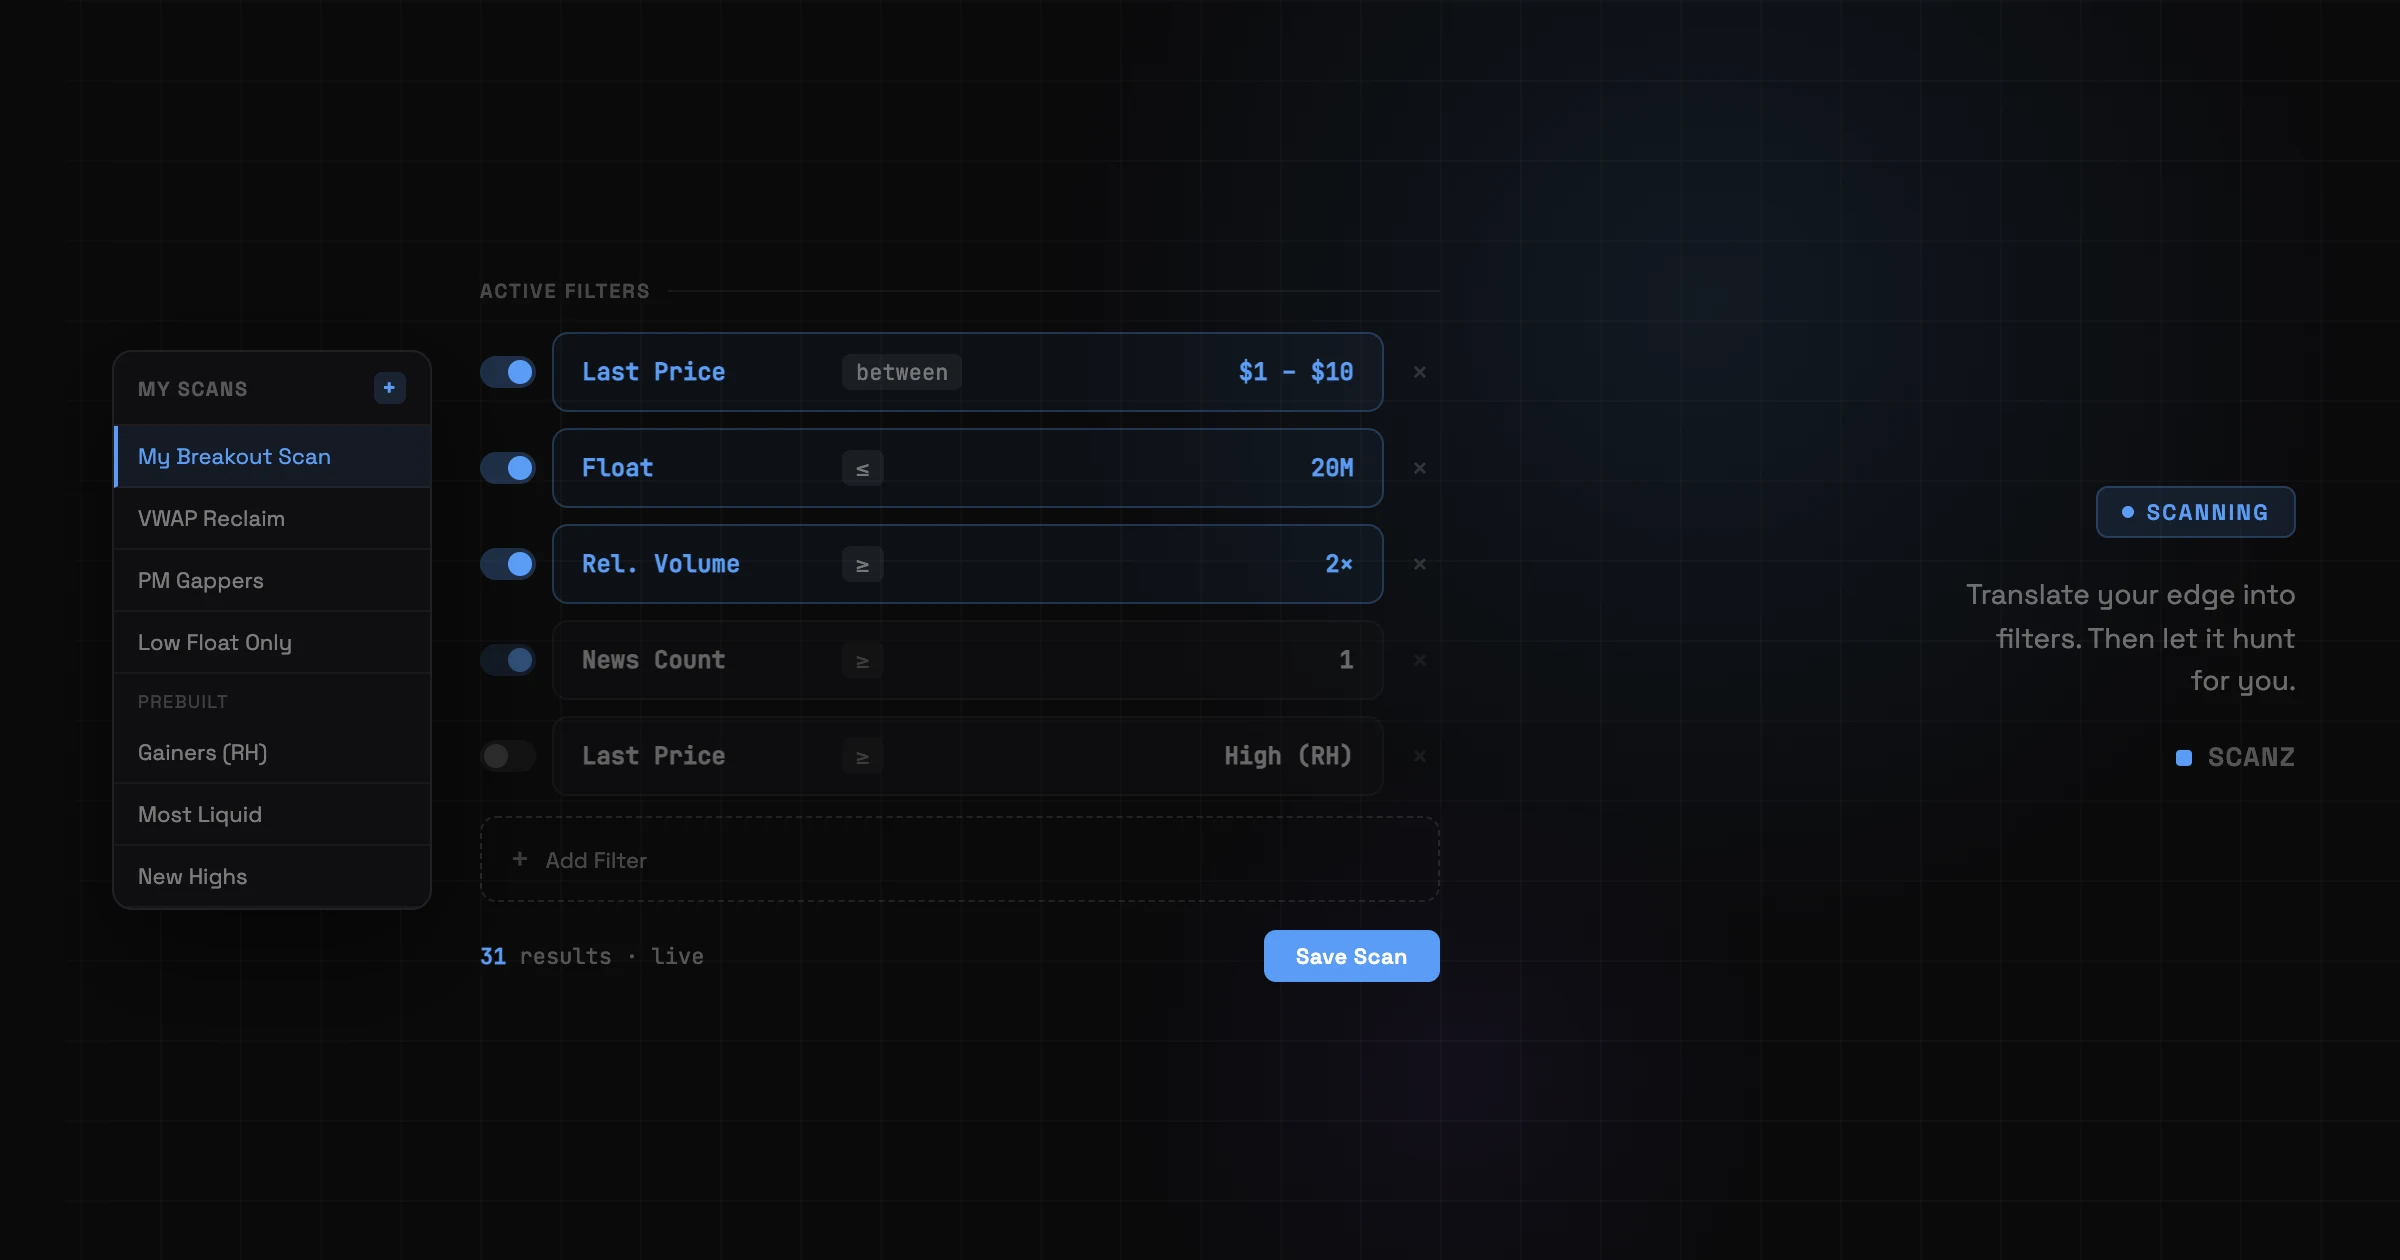
The short answer: A custom stock screener setup that’s built around your specific strategy will outperform a generic scan every time. Here’s exactly how to build one in Scanz that translates your trade setups into filter conditions and hunts for you while you stay focused.
The Problem with “Generic Scans”
Have you ever loaded up a scanner that promises “hot stocks now” or “top movers” and just get a random mess of tickers you’d never touch?
Yeah, you and everyone else.
Generic scans are like generic workouts: maybe they hit the right muscle… or maybe you just pull something.
What changed the game for me wasn’t having a scanner — it was when I built one that mirrored my desired trade setups.
Not someone else’s. Not some guru’s. Mine.
Today I’m going to walk you through exactly how to do that using Scanz, and how you can finally automate your edge so it finds you — before the crowd catches on.
Step 1: Know Your Setup Like You Know Your Morning Coffee
Before you touch a single filter, you need to be able to describe your setup in one sentence.
Here’s mine:
“Low-float breakout stock, under $10, high relative volume, preferably with news, breaking out of consolidation.”
If you can’t do that, back up and define your setup first. A stock screener setup is only as smart as the criteria you feed it. You’re not looking for someone to hand you ideas — you’re building a machine that hunts for your specific A+ setup while you stay focused.
Once your setup is clear, everything clicks into place. Your scanner becomes the automated version of your brain, constantly watching the market so you don’t have to.
Step 2: Translate Your Strategy Into Filter Conditions
Let’s break down that breakout setup into actual scan conditions inside Scanz.
Using the Data Scanner (65+ filters across Price, Change, Liquidity, Technical, Capital Structure, and more), here’s how each piece of the setup maps to a real filter:
- Price $1–$10 → Last Price (Price filters category, set “between” $1 and $10)
- Float under 20M shares → Float (Capital Structure filters, set “less than or equal to” 20,000,000)
- Volume surge → Relative Volume ≥ 2 (Liquidity filters — compares current activity against the stock’s historical daily average. RVOL of 2x means it’s trading at twice its normal pace. Something is happening.)
- Breaking out 1 → Last Price ≥ High (previous session) (Price filters, compare Last Price to prior High using the dynamic field comparison)
- Breaking out 2 → Last Price = High (Full Day session) (Price filters, compare Last Price to the day’s High using the dynamic field comparison)
- News catalyst → News Count ≥ 1 (News filters category) — so only stocks with at least one recent headline make the cut. Open the News Scanner alongside your scan to see the actual headline driving the move
Each filter you add narrows your results. The goal is 10–50 stocks, not 500. Start broad, add filters one at a time, watch the count drop until you’re looking at a focused, tradeable list.
Now you’re not watching a screen. You’re watching for your criteria to trigger. Big difference.
Step 3: Make It Proactive — Turn On the Activity Log
Once your scan is saved under My Data Scans (left sidebar, persists across sessions), the next level is making it proactive — so you’re not babysitting the results table waiting for a setup to appear.
That’s what the Activity Log is for (the panel at the bottom of the Data Scanner). It tracks your scan live and fires the instant a stock enters your criteria — a fresh low-float, high-RVOL name the moment it qualifies. Click the Sound button, pick one of the 10 alert tones, and it pings you out loud the moment a new match drops — even if you’ve stepped away from the screen. Not after you happen to glance at the right row. At the moment it happens.
That covers discovery. For the handful of names you’ve already committed to, use Alerts (ticker-specific). Add your top candidates to a Watchlist (Watchlists feature — create a list called “Today’s Setups”, add tickers with instant autocomplete), then set an Alert on each specific ticker — price target, VWAP reclaim, volume spike. Scanz watches that one stock and emails or pushes you the moment it hits, so you don’t have to babysit it.
The result: instead of monitoring 15 charts, I get a notification when:
- Float is low
- Volume just spiked
- A headline just dropped (News Scanner, filtered to the same float and volume criteria — surfaces the actual catalyst in real time)
- Price is surging past a key level
I don’t need to look for these things individually. I combine all of them into one scan and let the Activity Log surface the moment a stock matches. Even better.
No more guessing. No more reaction lag. The scanner becomes my early-warning system — pinging me before chatrooms catch on.
Step 4: Refine It Like a Craft Tool
The first version of your stock screener setup won’t be perfect. That’s fine. That’s expected.
Use it for a few days. Then come back to it with honest eyes:
- Which alerts fired but didn’t work? Was your RVOL threshold too low? Did you need a tighter price range?
- Which winners did you miss and why? Maybe your Float ceiling cut out stocks that would have qualified
- Were you getting too many results? Add a News Count ≥ 1 filter (News filters) to narrow to catalyst-driven moves only
- Were the moves already extended by the time you saw them? Try a Signal Scanner configuration instead of the Data Scanner alone — it catches the transition moment, not the current state
Every tweak gets you closer to a scanner that feels like a superpower — because it’s tuned to your exact trading personality, refined against real market conditions.
Scanz saves every custom Data Scanner scan under My Data Scans. Every refinement persists. You’re building something that compounds over time.
Step 5: Build Variations for Different Market Conditions
One scan isn’t enough. The market doesn’t behave the same every day.
Build at least three versions of your core setup:
- “Breakouts — Hot Market” — tighter criteria, RVOL ≥ 3, price momentum already confirmed
- “Breakouts — Quiet Market” — looser volume thresholds, wider price range, catch earlier setups
- “Breakouts — Low Float Only” — float under 10M, high squeeze potential, higher risk/reward
Save them all. When you sit down in the morning, you pick the one that matches the market character that day. No rebuilding from scratch, no friction. Just load and go.
You Don’t Need More Setups — You Need More Precision
At the end of the day, the traders who win aren’t chasing more strategies.
They’re scaling the ones that already work — with speed, automation, and precision.
Your scanner isn’t just a tool. It’s your tactical extension. And when it becomes the foundation for your trading? That’s when everything clicks.
Next time you open Scanz, don’t just pick a scan — although we have some great prebuilt ones to start from.
Build your scan.
Frequently Asked Questions
What is a custom stock screener setup? A custom stock screener setup is a saved combination of filters built around your specific trading strategy — price range, float, volume, technical levels, news catalysts — that runs in real time and surfaces only the stocks matching your exact criteria. Unlike generic scans, it’s tuned to your trade setups, not someone else’s.
How do I start building a custom scan in Scanz? Open the Data Scanner, click + Filter (filter bar, top of the Data Scanner interface), and add your conditions one at a time. Start with 3–5 filters — price range using Last Price (Price filters), volume confirmation using Relative Volume (Liquidity filters), and float using Float (Capital Structure filters). Watch the results count as you add each filter. Aim for 10–50 results. Save it under My Data Scans when it’s working.
What’s the difference between the Data Scanner and Signal Scanner in Scanz? The Data Scanner shows you every stock currently matching your criteria right now — and its Activity Log pings you (with sound) the moment a new one enters. The Signal Scanner is separate: it fires on specific events across the market — the instant any stock breaks to a new high or crosses above VWAP.
How do I add a news filter to my scan? Add News Count ≥ 1 (News filters category in the Data Scanner) to require at least one recent headline. Then run the News Scanner alongside your scan with the same stock filters applied — it surfaces the actual headlines for stocks matching your criteria, so you see the catalyst behind the move.
How often should I refine my scan? Review it after every trading session for the first two weeks. Check which alerts fired but didn’t work and which winners you missed. Adjust one filter at a time. After a month of daily refinement you’ll have a scan that’s been tuned against real market conditions — most traders never do this and wonder why their scanner feels random.
Can I run multiple scans at once? On Scanz Web, one scan at a time. To run multiple scans simultaneously — a pre-market gapper scan and a breakout scan side by side — use Scanz Desktop, which supports custom layouts with multiple scanner panels you can save for multi-monitor setups.
Start your 7-day free trial. Scanz Starter and Pro both include the real-time Data Scanner, Signal Scanner, Alerts, News Scanner, Watchlists, and 65+ filters — everything you need to build and run a custom stock screener setup tuned to your trading strategy. Try Starter or Pro today. No commitment, cancel anytime.