The market moves fast when you’re day trading. If you don’t spot a setup before it happens, it will be gone before you can open a position. That’s why having scans that you can use throughout the day to find potential day trades is so important.
With Scanz, you can use both the Breakouts module and the Pro Scanner to quickly find stocks that are ripe for day trades. In this article, we’ll cover four different intraday scans that day traders can use to identify promising stocks.
1. Finding Volume Breakouts
Volume is critical to any intraday stock scan. Stocks that are trading with higher than average volume are likely experiencing more price volatility, which opens up opportunities to turn a quick profit. Importantly, more volume also means more liquidity. So, you can go into a day trade on a tight timeframe knowing that your orders are going to be fulfilled.
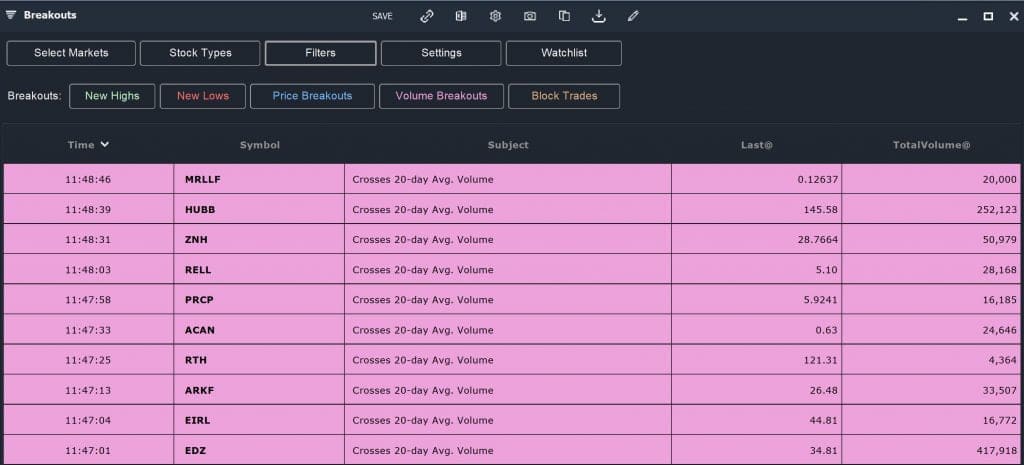
There are two ways to spot volume breakouts in Scanz. The first is to use the Breakouts module. There, you can quickly filter for stocks that are trading above their 10- or 20-day average daily volume.
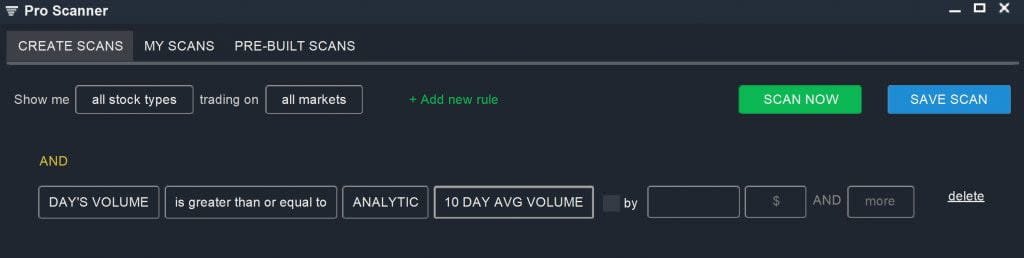
You can also use the Pro Scanner to find volume breakouts. The following parameter will yield the same results as the Breakouts module:
DAY’S VOLUME is greater than or equal to ANALYTIC 10 DAY AVG VOLUME
Better yet, you can use the Pro Scanner to combine a volume filter with another intraday scan. This is perhaps the best approach to scanning for volume breakouts, since you can search for stocks that have both high liquidity and another intraday entry signal.
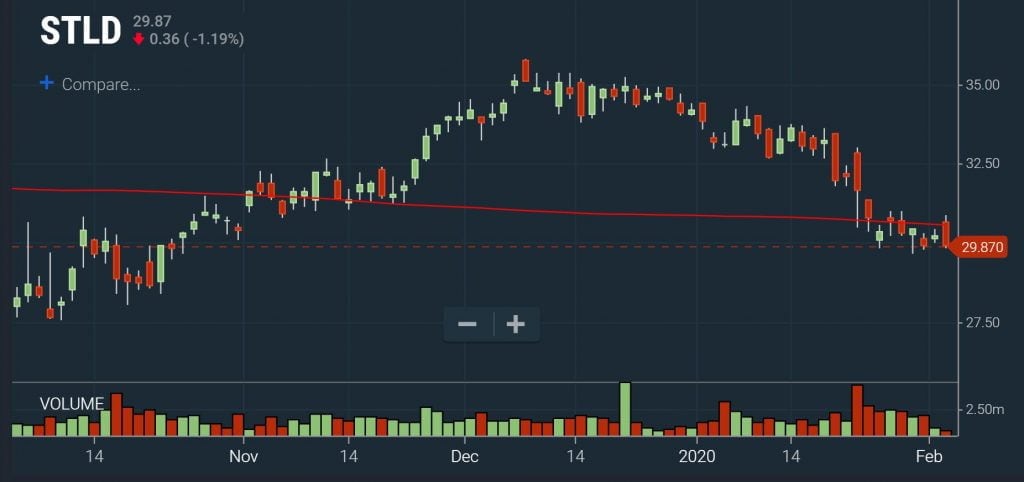
2. Spotting Intraday Price Breakouts
Scanning for price breakouts is also an effective way to find stocks for intraday trading. Price breakouts – whether above a 52-week high or below a long-term moving average – can signal the start of a broader trend or portend a reversal. Either way, this type of breakout creates some opportunities for fast-moving day trades.
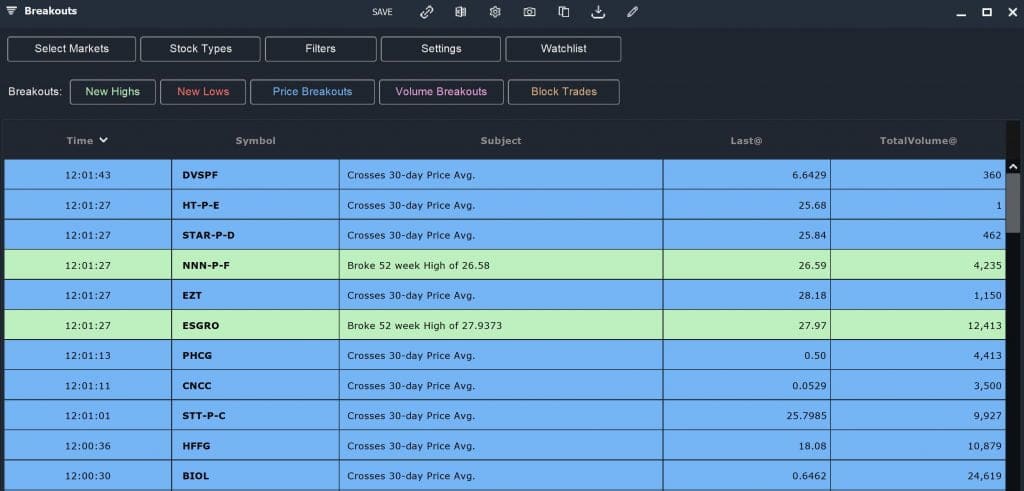
As for volume breakouts, you can scan for price breakouts using either the Breakouts module or the Pro Scanner. The Breakouts module allows you to quickly spot stocks that are crossing above or below a simple moving average or setting new 52-week highs or lows. In that sense, it’s a very useful tool for finding the widest possible selection of stocks to follow up on.
However, the Pro Scanner gives you more nuanced control over looking for specific setups. For example, you can look for an intraday bullish breakout above the 10-day simple moving average among stocks that have been trending upwards for a long time:
DAY OPEN is less than ANALYTIC Simple Moving Average (Daily, 10)
AND
LAST is greater than or equal to ANALYTIC Simple Moving Average (Daily, 10)
AND
Simple Moving Average (Daily, 10) is greater than or equal to ANALYTIC Simple Moving Average (Daily, 50)
AND
Simple Moving Average (Daily, 50) is greater than or equal to ANALYTIC Simple Moving Average (Daily, 200)
You can also combine price breakout filters with volume filters. For example, you could look for a bearish breakout below a 200-day moving average. To find stocks that are potentially poised for a reversal, you could pair that scan with a scan for lower-than-average trading volume:
DAY OPEN is greater than ANALYTIC Simple Moving Average (Daily, 200)
AND
LAST is less than or equal to ANALYTIC Simple Moving Average (Daily, 200)
AND
DAY’S VOLUME is less than ANALYTIC 10 DAY AVG VOLUME
In this way, the Pro Scanner can be extremely useful for spotting intraday price breakouts in the context of your custom trading strategy.
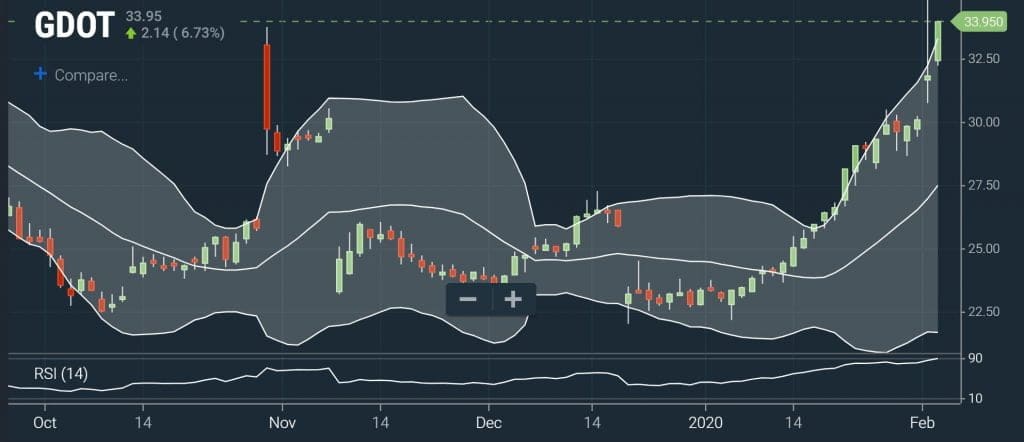
3. Scanning for Extreme Conditions
Another good intraday scan focuses more on extreme conditions, which can lead to sudden and large swings in a stock’s price. There are numerous technical indicators that could be used to identify abnormal trading conditions. In this case, we’ll use RSI, Bollinger Bands, and volatility.
Relative Strength Index (Daily, 14) is greater than or equal to VALUE 90
AND
LAST is greater than or equal to ANALYTIC Bollinger Bands Upper (Daily, 5)
AND
DAY HIGH is greater than or equal to DAY LOW by 5% AND More
You could also use 5-minute charts for calculating the RSI and Bollinger Bands in order to find stocks that are highly unstable at the exact moment of your search. However, since these are extreme conditions, they are often fleeting – in most cases, these conditions won’t last for longer than a few candlesticks on a 5-minute chart
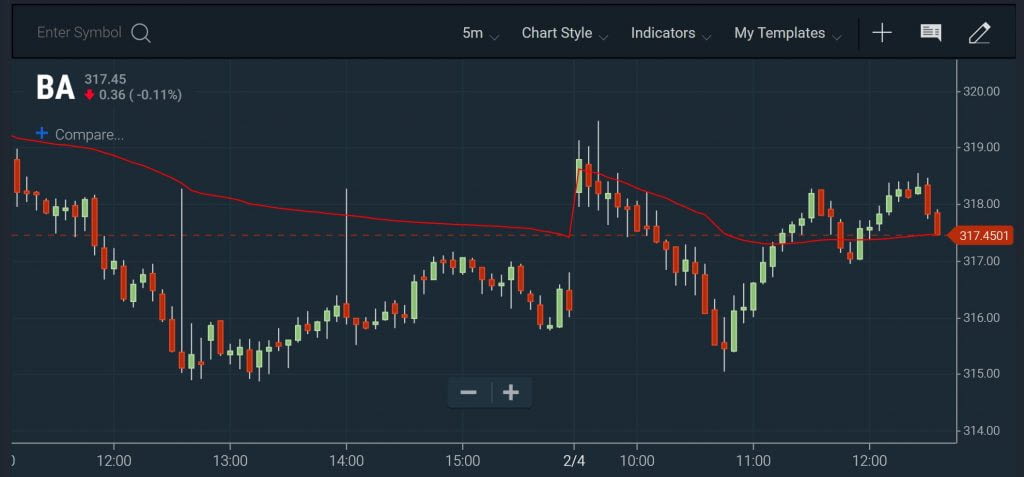
4. Looking for VWAP Tests
The volume-weighted average price is an indicator commonly used by day traders. The very fact that it’s commonly watched is an advantage, since there will typically be a broad market reaction among traders in response to a VWAP cross or pullback.
There are a number of strategies you can use to trade around the VWAP, but the first step in any of these is to find stocks that are trading close to their VWAP at the moment. You can do that with the Pro Scanner by searching for stocks whose prices are testing the VWAP:
LAST is greater than or equal to ANALYTIC VWAP by 0.1% AND Less
Since the VWAP is constantly changing, especially in stocks trading with a lot of volatility, this is a scan you’ll want to run continuously throughout the trading day. It’s also a good idea to pair your VWAP scan with a volume filter, so you can home in on stocks that plenty of other day traders are watching as well.
Conclusion
Success as a day trader depends in large part on being able to identify profitable setups in real time. Breakouts, extreme conditions, and tests of key indicators like the VWAP are strong signals of volatility that day traders can act on. By searching for these setups with the Scanz Breakouts module and Pro Scanner, you can make sure that you’re one step ahead of the market throughout each trading day.
Related Reading:
- How to Find Stocks to Day Trade
- VWAP Scanner: Finding Intraday Opportunities
- Relative Volume Scanner: Spot High-Activity Stocks
Ready to start scanning? Try for free and choose the plan that fits your workflow.