Reversals are exciting trading events. If you can spot them before they happen, a reversal offers a chance to make a major profit as a new bullish or bearish trend takes over. Alternatively, spotting reversals can help you lock in profits on your existing positions before a new price regime develops.
Finding reversals can be tricky, as it requires some detective work. That research starts with scanning for stocks that could potentially be signaling a reversal, but also requires searching for specific technical signals that could anticipate a trend shift. In this article, we’ll explore four different scans you can create with the Scanz Pro Scanner module to identify stocks that are poised for a reversal.
Scanning for an Established Trend
Before looking at technical indicators that could point to a reversal, it’s essential to limit your scans to only stocks that have an established price trend. That’s because only stocks that have been trending can experience a true reversal. If a stock has been trading in a channel or without a clear pattern, the technical indicators that we use to find reversal candidates may not be reliable.
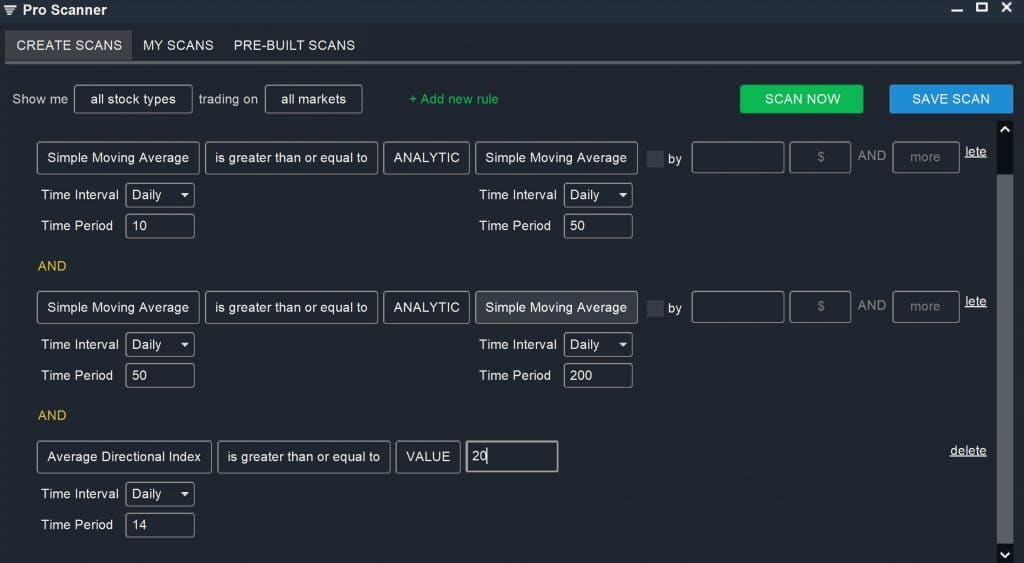
You can use a combination of moving averages and average directional index (ADX) to scan for trending stocks:
Simple Moving Average (Daily, 10) is greater than or equal to ANALYTIC Simple Moving Average (Daily, 50)
AND
Simple Moving Average (Daily, 50) is greater than or equal to ANALYTIC Simple Moving Average (Daily, 200)
AND
Average Directional Index (Daily, 14) is greater than or equal to VALUE 20
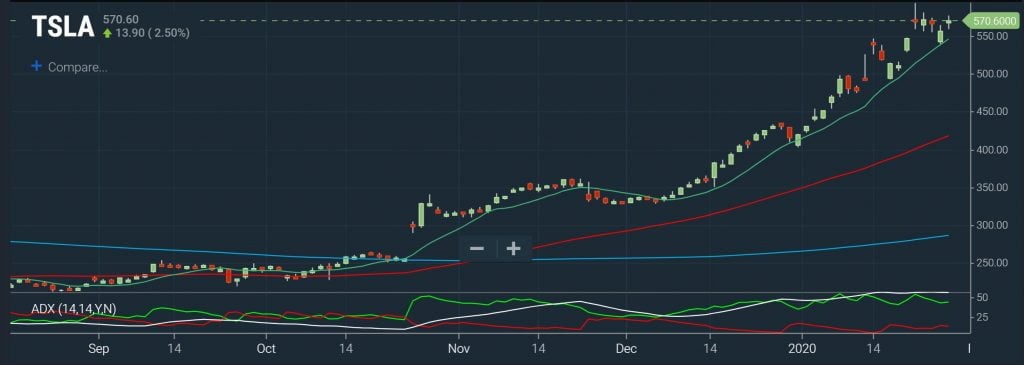
When shorter-term moving averages are stacked above longer-term moving averages, it’s typically because a stock’s price has been moving consistently up over time. In a bearish trend, longer-term moving averages would be stacked on top of shorter-term moving averages. The average directional index is a more direct way to scan for trending stocks – an ADX greater than 20 indicates that a stock’s price has established a trend, regardless of whether the trend is bullish or bearish.
1. Abnormal Volume on Price Reversal
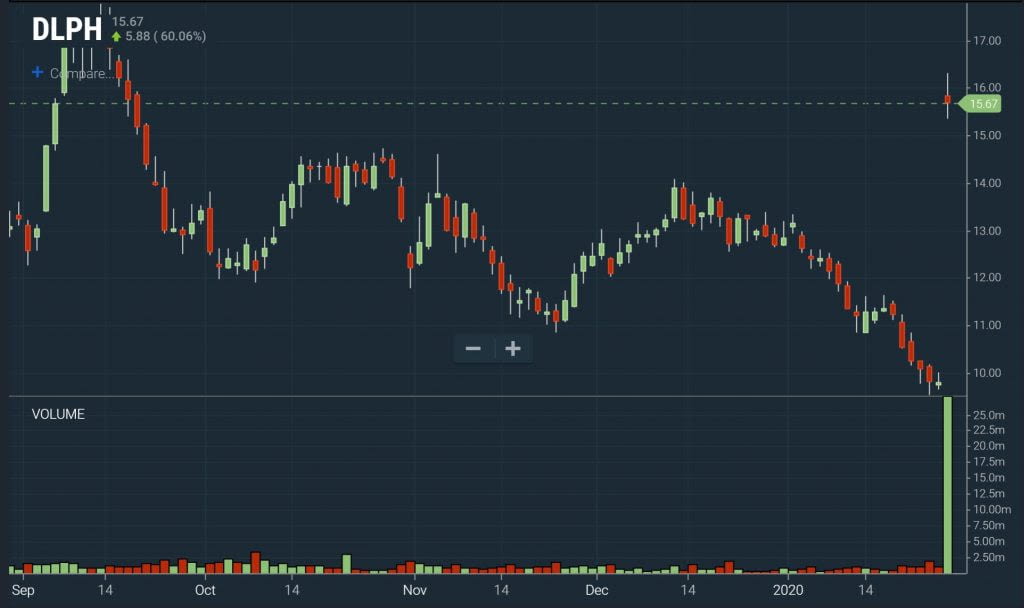
One of the simplest ways to look for potential reversals is to scan for stocks that may already be experiencing a reversal. Many reversals start with a large price jump that bucks the existing trend. If that sudden price change occurs on abnormally high volume, it may be more than a temporary aberration – it could be the start of a reversal.
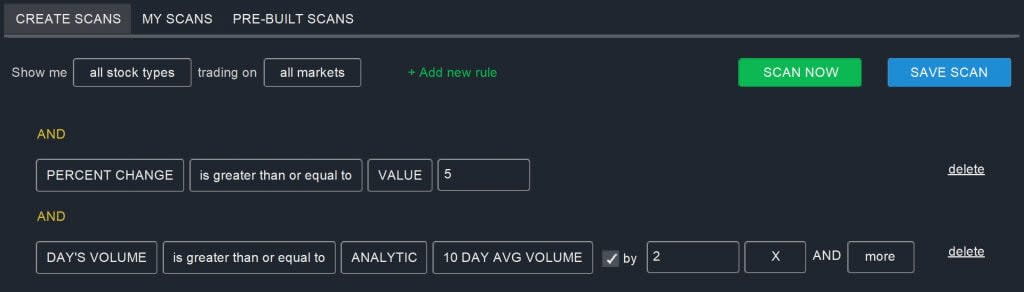
You can spot these potential reversals by looking for stocks that are up several percent in a single day and are trading with significantly above-average volume:
PERCENT CHANGE is greater than or equal to VALUE 5
AND
DAY’S VOLUME is greater than or equal to ANALYTIC 10 DAY AVG VOLUME by 2 X and More
You can modify the cutoff values in this scan to make it broader or narrower. Also keep in mind that if you’re looking for bearish reversals, you’ll need to scan for a negative percent change. When scanning solely based on price change and volume, it’s important to look at other technical indicators or news that could help confirm the suspected reversal.
2. Moving Average Cross
Moving averages are some of the best indicators you can use to scan for potential trend reversals. Here is an example of a scan you can use to scan for short-term bearish reversals:
Exponential Moving Average (Daily, 10) is less than or equal to ANALYTIC Simple Moving Average (Daily, 20) by 10% and more
AND
Simple Moving Average (Daily, 20) is greater than or equal to ANALYTIC Simple Moving Average (Daily, 50)
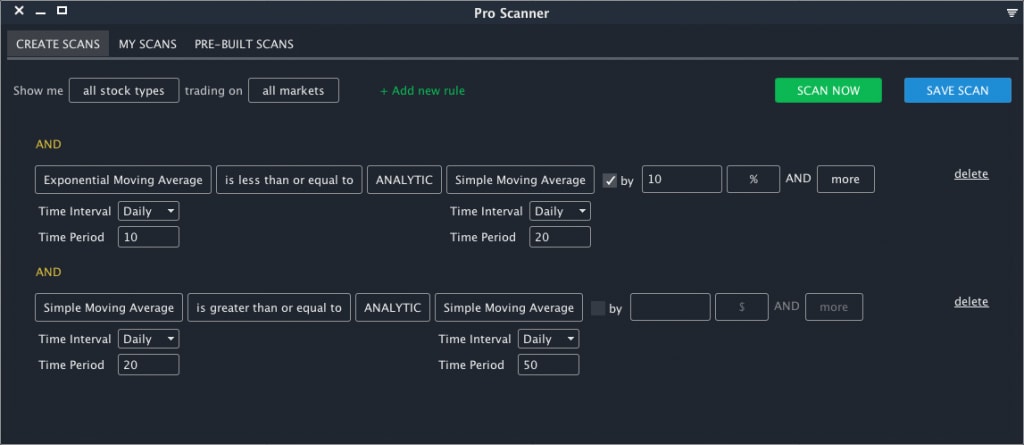
The first rule is used to show a change in the short-term trend. With the 10-Day EMA below the 20-Day SMA, we can find stocks where short-term momentum has shifted.
The second rule is to establish that this is actually a reversal of trend and not just a continuation of a downtrend. With the D0-Day SMA over the 50-Day SMA, we can find stocks where the previous trend was an uptrend.
These settings can be tweaked based on the timeframe of the reversal you are looking for. You can also reverse the logic to find bullish reversals.
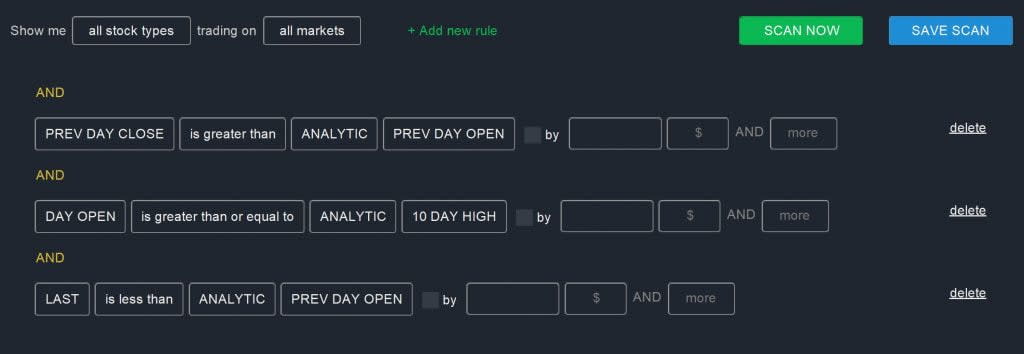
3. Key Reversal
Key reversals are common one-day chart patterns in which it’s possible to see bears taking over after a bullish trend or vice versa. In a bearish key reversal, a stock opens to new highs, but then is sold until it closes below the previous day’s opening price.
You can spot key reversal patterns by combining several price parameters in the Pro Scanner:
PREV DAY CLOSE is greater than PREV DAY OPEN
AND
DAY OPEN is greater than or equal to ANALYTIC 10 DAY HIGH
AND
LAST is less than ANALYTIC PREV DAY OPEN
Key reversals won’t always trigger an offset moving average cross, so this scan can identify some potential reversals that scan may otherwise miss. However, you should be careful to pull in information about trading volume and other technical indicators before trading on this chart pattern.
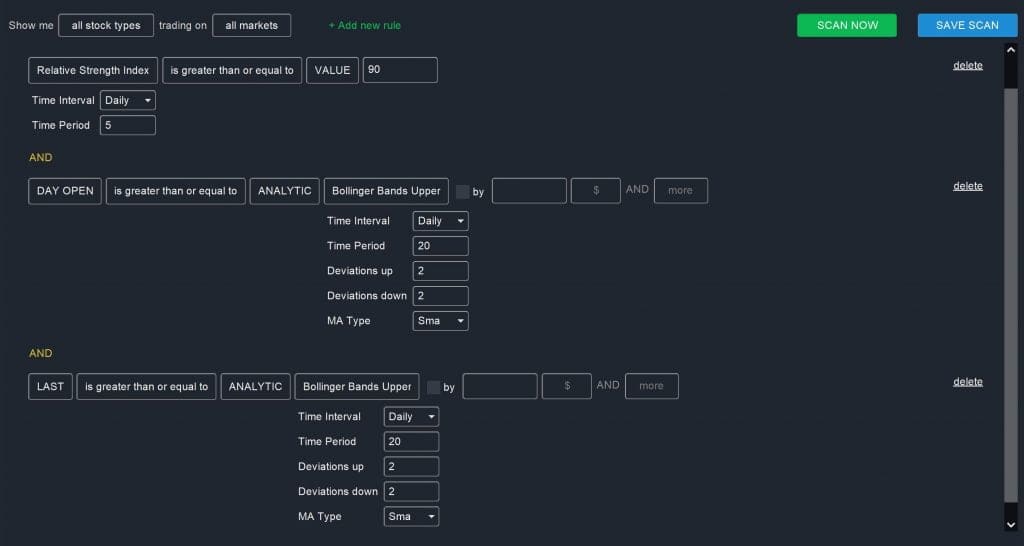
4. Out of Bounds Reversal
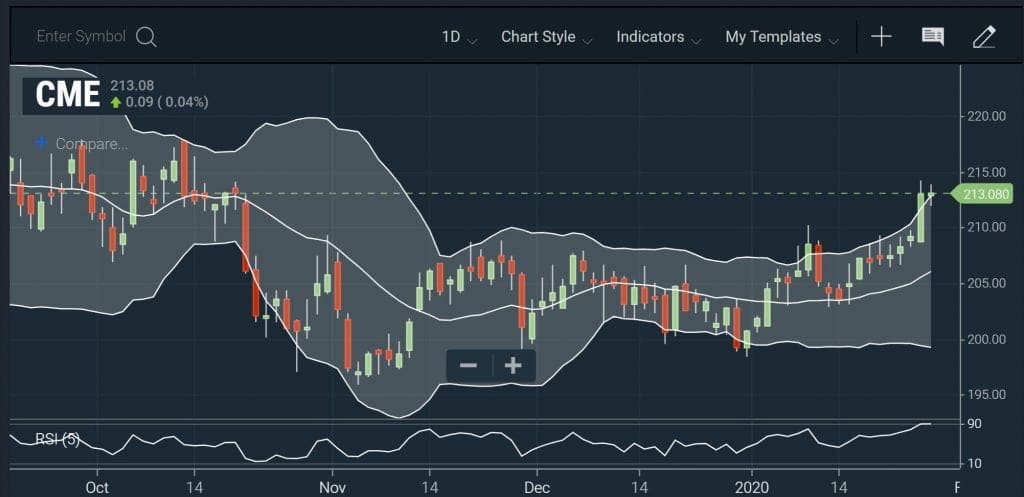
Another way to look for stocks that are poised for a reversal is to search for stocks that are extremely overbought or oversold. These stocks will not only have an extreme RSI value in the short term, but will be priced outside of the Bollinger Bands that are trailing the existing trend. This scan will not return results for stocks that have already reversed. Instead, it will help you find stocks that are highly overbought/oversold and may be due for a reversal.
You can scan for a bearish reversal buy searching for stocks that are very overbought and for which the latest candlestick opens and closes above the upper Bollinger Band.
Relative Strength Index (Daily, 5) is greater than or equal to VALUE 90
AND
DAY OPEN is greater than or equal to ANALYTIC Bollinger Bands Upper (Daily, 20)
AND
LAST is greater than or equal to ANALYTIC Bollinger Bands Upper (Daily, 20)
To find a bullish reversal, use an RSI less than 10 and search for bars developing below the lower Bollinger Band. Note that this scan can be effectively used on intraday timescales as well as daily timescales. That makes it significantly more versatile for day traders than some of the other reversal scans we looked at.
Anticipating Trend Shifts with Reversal Scans
Trend reversals can be extremely profitable if you can spot them before they fully develop. With these four scans, you can use the Scanz Pro Scanner to identify stocks that are poised for a reversal or are actively experiencing a trend shift. When using these scans, be sure to filter your results to look only at stocks that have an established trend. In addition, it’s important to use multiple technical indicators, stock news, and trading volume to help you confirm a reversal before trading on it.
Related Reading:
- Overbought Stock Screeners: Spot Reversal Candidates
- RSI Stock Screeners: Identifying Overbought and Oversold Stocks
- Bollinger Bands Scan: Finding Squeeze and Reversal Setups
Ready to start scanning? Try for free and choose the plan that fits your workflow.