What is a 52-week high breakout, and why does it work?
A 52-week high breakout is a stock trading above the highest price it reached in the past year. “52 weeks” and “one year” mean the same window; on a daily chart it is about 252 to 260 sessions, depending on the platform. The breakout is the moment price clears that old high, and traders judge it on two things: where the stock closes that day, and how much volume came with it.
The level matters because of who is standing there:
- No one is waiting to break even. Below an old high, every rally runs into holders who bought higher and sell as soon as they are whole again. Above the 52-week high, everyone who bought in the past year is in profit. Mark Minervini puts it in one line: a stock hitting a new high “has no overhead supply to contend with” (Minervini, archived).
- Everyone is watching it. The 52-week high prints on every quote screen, so buy-stop orders, short sellers’ stops and alerts collect just above it. A study in Management Science found volume is “strikingly higher” when price crosses the top of its past trading range, more so the longer since the last extreme, and that returns after the cross were reliably positive (Huddart, Lang and Yetman, 2009).
- Investors anchor on it. The most-cited paper on the effect ranked all US stocks each month by how close they traded to their 52-week high, from 1963 to 2001. Buying the closest 30% and shorting the furthest 30%, held six months, earned 0.45% a month, or 1.23% a month leaving out January (George and Hwang, Journal of Finance, 2004). Their explanation: traders treat the old high as a ceiling and are slow to price in news that pushes through it.
Read that last finding carefully, because most pages that cite it do not. It is a portfolio of hundreds of stocks ranked on nearness to the high and held for months, with the losers shorted. It is not a test of buying one stock on the day it breaks out with a stop. This page tests that trade separately, on real breakouts, further down.
How do you find stocks breaking their 52-week high?
You need two things: a tap on the shoulder when a stock prints a new one-year high, and a list, at the end of the day, of the breakouts that came with real volume. The Scanz real-time stock scanner has a template for each, and they are built to be used together. The rules below are exactly what the templates store.
The scan · Data Scanner · Regular hours; read it after 4:00 pm ET
52-Week High Break
| Rule | Setting | Why it's there |
|---|---|---|
| Close (Full Session) | > High (last 260) | Today's price above the highest high of the 260 daily candles before today, about one trading year. Both sides count the full session, so pre-market and after-hours prints are part of the old high. During the day, today's close is simply the last trade, so a stock joins the list the moment it trades above the old high and leaves it if it falls back below. |
| RVOL (20-day avg) | ≥ 1.5 | Today's regular-hours volume is at least one and a half average days, measured against the last 20 sessions. It is the breakout-volume rule most traders use; IBD asks for at least 40% above the 50-day average. |
| Volume (RH) | ≥ 300,000 shares | A floor on real shares, so a thin stock with a tiny average cannot pass on a few trades. |
Listed common stocks only: no ETFs, no OTC. The grid shows Ticker, Last Price FD, Vol FD and Time, sorted by volume. It lists nothing before 9:30 am ET, because both volume rules count regular hours.
The trial is 7 days of Pro, free, card required. It renews on the plan chosen at sign-up, Starter at $89/month or Pro at $199/month, unless you cancel in the app. Starter keeps one data scan and one signal scan, enough for both on this page.
When the scan lists a stock, in plain words. Two things must be true at the same moment: price is above the old high, and today has already traded one and a half average days of volume. The first can happen at 9:31. The second usually cannot, because this relative volume compares today’s volume so far with a whole average day and is not matched to the time of day: a stock having a normal day reads about 0.1 at 10:00 am and 1.0 at the close (how this RVOL reads through the day). So the scan lists heavy, early breakouts by mid-morning, ordinary ones in the afternoon, and many only when the closing auction prints at 4:00 pm.
That was true of most real breakouts in the example below. Of eight from September and October 2026 with intraday data, three were on the list by 3:45 pm, one at 3:55 pm, and four only with the closing print. That is why the main play on this page is judged after the close, and why the scan is the confirmation step, not the alert.
The scan · Signal Scanner · Regular hours
New 52-Week Highs
| Rule | Setting | Why it's there |
|---|---|---|
| Fires when | New High, Yearly, over the last 1 year | One row in the feed for every new one-year high, with the time and the price: "New 1 year High occurred at $21.03". A stock fires again on each higher print, so a name that keeps appearing is still climbing. |
| Volume (RH) | ≥ 250,000 shares | Leaves out new highs on stocks that have barely traded today. |
| Last Price | ≥ $1 | Leaves out sub-dollar stocks. |
The signal's universe is wider than the scan's: it includes ETFs, ADRs, preferreds and warrants. On a falling day the feed fills with inverse ETFs, as the capture below shows. Use the feed's Type filter to leave out ETFs if you only trade stocks.
The two work as a pair. The signal is the event: it tells you during the day which stocks are printing new one-year highs, so you can open the chart, check the base, and put the good ones on a watchlist. The scan is the standing list with the volume rule the signal does not have: after the close it tells you which of those breakouts traded one and a half average days. New Highs signals are the most-used prebuilt signals in Scanz. Copy the template with Use template and give it a sound so a fire reaches you while you are looking at something else (Signals guide).
Tightening and loosening it.
- Small caps: add a price floor ($5 is common among breakout traders) and raise the volume floor. Small caps break 52-week highs on news, and the base rule below matters even more.
- Large caps: 1.5 is a real event for a $200 stock. Keep it, and add a dollar-volume floor if you want only institutional names.
- Earlier in the trend: the 20-Day High Break template in the same category asks for a close above the 20-session high, RVOL ≥ 1.5, 250,000 shares and 100 trades: stocks clearing a month’s range rather than a year’s.
- The night before: with Data set to the previous day (the selector beside Exchanges and Type), the scan runs on yesterday’s session, so you can build the morning’s list before the open (filter reference).
What are the entry, stop and exit rules?
The ranking pages and the traders who publish their methods teach three ways in: buying the breakout as it clears the old high, buying the first pullback to the old high after it, and day-trading the intraday break. Most lead with the first. IBD’s method treats the breakout through the buy point as the main buy and the pullback as a “follow-on” entry taken with a smaller position (IBD via Yahoo Finance); altFINS and AskTraders wait for a daily close above the high. So the main card is the breakout, judged on the close and bought the next morning. The pullback and the intraday break are variations below, each with its own rules.
The setup on one card
- The list
- On 52-Week High Break after the close: above the old high, RVOL ≥ 1.5 against the 20-day average, 300,000 shares in regular hours
- Time window
- Read the list from 4:00 pm ET, or before the next open with Data set to the previous day. Enter at the next open, 9:30 am ET.
- Setup
- The old 52-week high was set at least five weeks (25 sessions) before the breakout, so the stock has built a base under it; this is a breakout, not a stock that has been making new highs all month
- Market
- The S&P 500 is above its 50-day moving average. No new breakouts when the market is in a correction.
- Entry
- At the next open, only if it opens above the old high and no more than 5% above it
- Stop
- 7% below the entry. A gap below the stop fills at the open, so the loss can be larger.
- Target
- Sell at +20%, about 2.9 times the risk
- Otherwise
- Sell on the first close below the 50-day moving average on volume above its 50-day average
- Skip it when
- It opens more than 5% above the old high; it opens back below the old high; the market is below its 50-day line; the old high is less than five weeks old
Why the close, and why the next morning. A stock can trade above its 52-week high at 10:00 am and close back under it at 4:00 pm; that is the most common false breakout, and judging on the close filters it out. Stock Alarm’s guide says a stock that clears the high intraday but closes back below it “more often than not” fails (Stock Alarm). The volume test belongs to the close too, for the reason above: the 1.5 reading is a whole-day number, and many breakouts reach it only in the closing auction. AskTraders and altFINS both wait for a daily close above the high, and rickorford.com buys during the next session. The next open is the first price at which both tests are already known.
Why five weeks of base. IBD counts bases in weeks and asks for at least five for a flat base and seven for a cup with handle: “one, two or three weeks do not get the job done” (IBD via Yahoo Finance). A stock that set its 52-week high last week and sets another today is extending a run, not breaking out of a range, and the sellers who cap a range have not been worked through. The scan cannot see this; the daily chart can, in two seconds.
Why no more than 5% above the old high. IBD calls a stock more than 5% past its buy point “out of buying range” (IBD via Yahoo Finance). The further above the level you buy, the further a normal pullback to it takes you toward your stop.
Why 7% and 20%. These are O’Neil’s numbers: cut every loss at 7% to 8% below the purchase price (IBD via Yahoo Finance), and “take most of your profits when they reach 20% to 25%” (IBD via Yahoo Finance). The arithmetic is the point: with a 20% target and a 7% stop, one winner pays for nearly three losers, so the plan can break even while losing most of its trades. IBD makes one exception: a stock that gains 20% within three weeks of the breakout is held at least eight weeks. The card leaves it out to keep the test simple.
Why the 50-day line. Most breakouts neither hit +20% nor −7% quickly. IBD’s rule for those is that a stock that “collapses below 50-day support in heavy volume is often sending a sell signal”, and a slip below it on light volume is not (IBD via Yahoo Finance).
Why the market rule. O’Neil’s reason is that three out of four stocks follow the general trend (IBD via Yahoo Finance). IBD makes its own call on market direction; the S&P 500 against its 50-day line is a simple stand-in you can check in a second, and it is what the test below uses.
Sizing from the stop. Decide what you will lose if the 7% stop is hit, then divide by 7% of the price. $700 of risk on a $100 stock is 1,000 shares, a $100,000 position; that is why many swing traders use a tighter stop on large positions or trade fewer of them. Results below are counted in R, multiples of that 7% risk.
A real example: November 20, 2026, and the twelve breakouts before it
What the scan and the signal showed on a falling day
November 20, 2026 was a bad day to look for breakouts: by 12:35 pm ET the S&P 500 ETF was down 2.1% and Nvidia 7.4% (Yahoo Finance quotes). Both templates were opened from Discover with no changes.
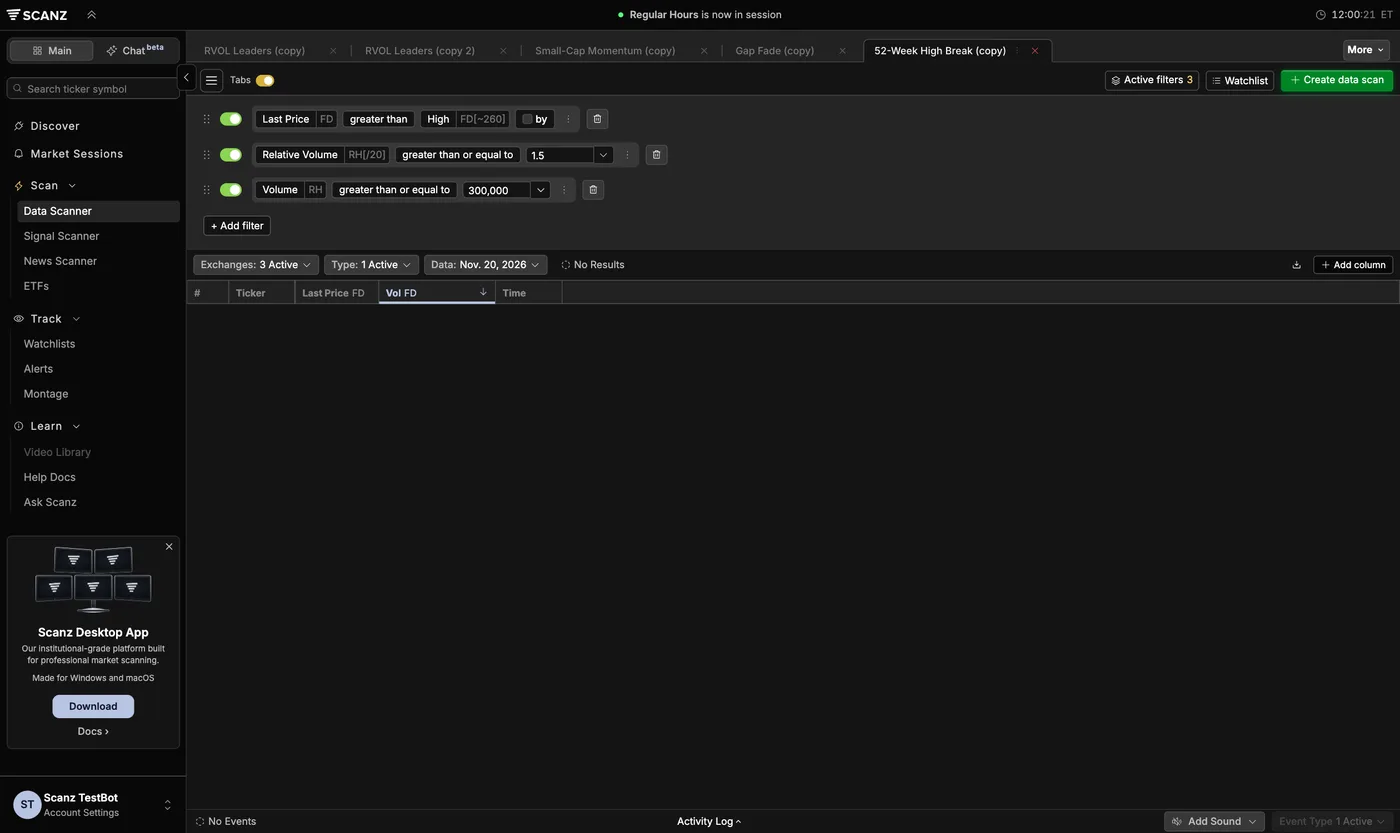
An empty list, and why. At noon the scan listed nothing. Checking all 503 S&P 500 stocks against Yahoo Finance’s daily bars at 12:35 pm, exactly one had traded above its 52-week high: W. R. Berkley (WRB), at $79.69 against an old high of $79.26. Its volume so far was 0.26 of an average day, a sixth of what the scan needs. Had it held above the old high and traded heavily into the close, it could have joined the list at 4:00 pm. On a day like this the empty list is the scan doing its job, and the market rule on the card says not to buy breakouts anyway.
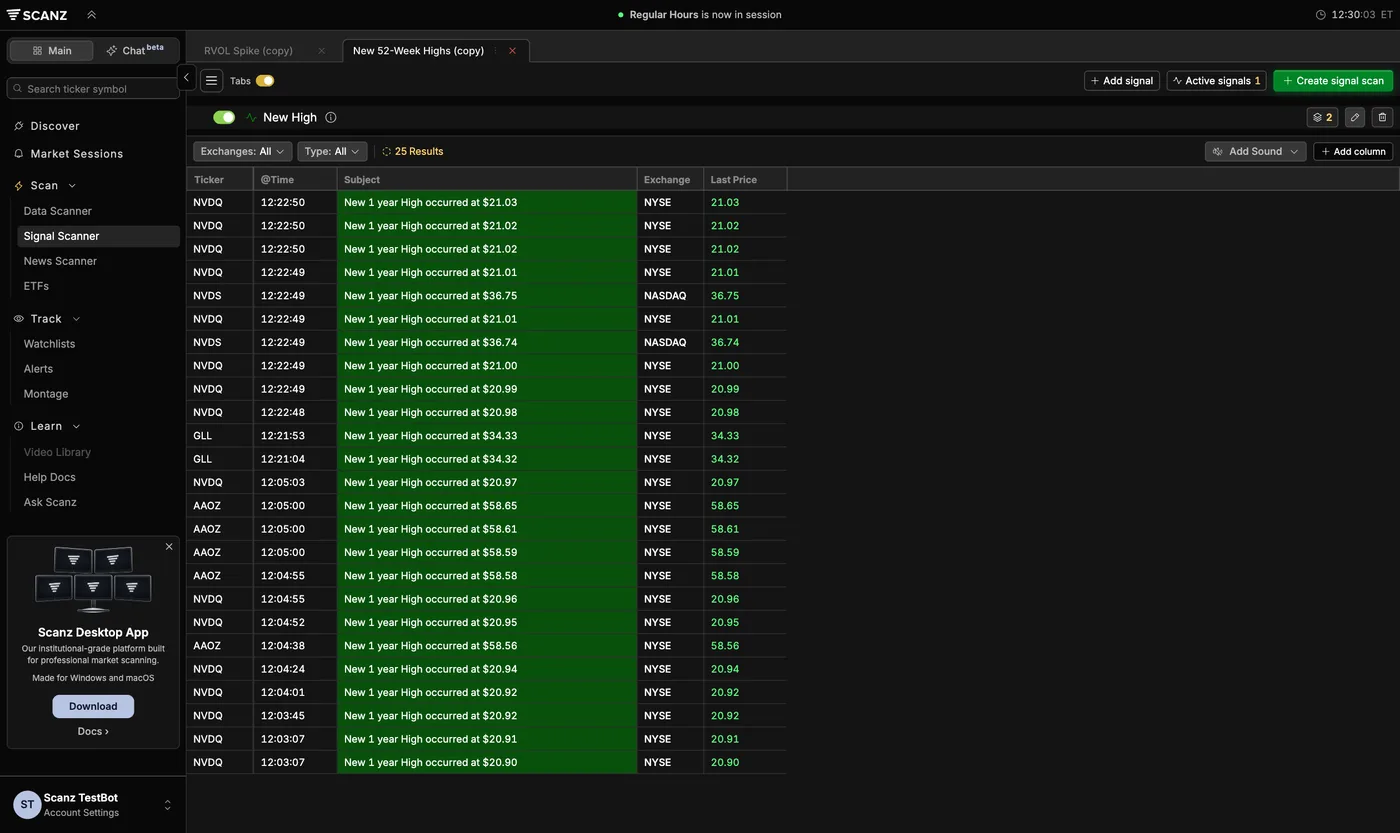
A full feed, and why. The signal was busy, and every fire was a fund that rises when something else falls: T-Rex 2X Inverse NVIDIA (NVDQ) fired at each cent from $20.90 to $21.03, Tradr 1.5X Short NVDA (NVDS) at $36.74 and $36.75, ProShares UltraShort Gold (GLL) at $34.32 and $34.33, and Tradr 2X Short AAOI (AAOZ) from $58.56 to $58.65. The signal includes ETFs and the scan does not, which is why one was full and the other empty. Two lessons: on a down day the new-highs feed is a list of what the market is betting against, and if you trade stocks, set the feed’s Type filter to leave out ETFs before you trust it.
The twelve breakouts before it, and what the card did with them
A capture shows one day. To see the rules over a run of breakouts, here is every S&P 500 stock that met the card from September 1 to October 28, 2026, from Yahoo Finance’s public daily and 5-minute data. “On the list” is when the scan’s two volume rules and the price rule were all true, worked out from 5-minute bars; those bars leave out the 4:00 pm closing auction, so “at the close” means the closing print is what put it over 1.5. The old high here is from regular-hours prices; the scan’s includes extended hours.
| Breakout day | Stock | Old high | Close | Day’s RVOL | Base | On the list | Next open | Result |
|---|---|---|---|---|---|---|---|---|
| Sep 1 | Deere (DE) | $674.19 | $676.08 | 1.96 | 27 weeks | (no intraday data) | $678.06, +0.6% | Stopped Oct 9, −7.0% |
| Sep 21 | AMD | $584.73 | $615.52 | 2.33 | 11 weeks | (no intraday data) | $606.57, +3.7% | Gapped through the stop Oct 15, −11.0% |
| Sep 21 | Twilio (TWLO) | $258.35 | $266.06 | 1.71 | 6 weeks | (no intraday data) | $271.60, +5.1% | Skipped: opened out of the buy zone |
| Sep 24 | Everpure (P) | $119.10 | $121.88 | 1.64 | 5 weeks | At the close | $122.88, +3.2% | Target Oct 6, +20.0% |
| Oct 9 | Humana (HUM) | $428.88 | $431.87 | 3.90 | 12 weeks | 10:10 am | $434.57, +1.3% | Stopped Nov 2, −7.0% |
| Oct 9 | Palantir (PLTR) | $207.52 | $209.05 | 1.64 | 47 weeks | At the close | $208.90, +0.7% | Stopped Oct 15, −7.0% |
| Oct 15 | eBay (EBAY) | $119.31 | $122.91 | 1.61 | 20 weeks | At the close | $123.94, +3.9% | Open, −4.6% |
| Oct 15 | Keurig Dr Pepper (KDP) | $33.82 | $34.18 | 1.69 | 15 weeks | At the close | $34.41, +1.7% | Open, +2.7% |
| Oct 15 | Veeva (VEEV) | $310.50 | $313.03 | 1.79 | 51 weeks | 3:55 pm | $319.95, +3.0% | Stopped Nov 6, −7.2% |
| Oct 20 | Hasbro (HAS) | $106.98 | $109.52 | 4.25 | 34 weeks | 1:20 pm | $110.27, +3.1% | Open, +3.2% |
| Oct 20 | Hilton (HLT) | $358.00 | $359.29 | 2.82 | 17 weeks | 12:30 pm | $360.00, +0.6% | Open, −0.6% |
| Oct 28 | Labcorp (LH) | $341.80 | $360.25 | 2.78 | 9 weeks | (no intraday data) | $355.94, +4.1% | Open, +3.3% |
Open trades are marked at 12:35 pm ET on November 20. Eleven trades taken, one skipped: one target, five stops, five still open. That is an ordinary stretch for this plan, and it shows how the plan is meant to work: the five losses add up to 39% of one position, the one winner to 20%, and the open trades decide the rest.
The winner, minute by minute. Everpure traded as high as $124.21 in the first five minutes of September 24, above its $119.10 high, so New 52-Week Highs would have fired in the opening minutes. It ran to about $130 by noon on heavy volume, then gave back most of it: $124.41 at 2:00 pm, $121.89 at 3:55 pm. Its relative volume was 1.49 on the last 5-minute bar, and the closing auction took it to 1.64. A trader reading the scan at 3:45 would not have seen it; the trader reading it at 4:00 would. It opened at $122.88 the next morning, 3.2% above the old high, inside the buy zone, and reached the +20% target ($147.46) on October 6, eight sessions after the entry.
A loss, minute by minute. Palantir traded below its $207.52 high all morning, $199.61 at 10:00 am, and first traded above it at 2:50 pm. It closed at $209.05 with 1.41 average days traded by 3:55 pm and 1.64 after the closing print. Every rule passed: a 47-week base, the market above its 50-day line, an open of $208.90, 0.7% above the old high. Three sessions after the entry, on October 15, it was through the $194.28 stop. Nothing on the card warned against it. That is what a 7% stop is for.
The gap. AMD’s stop was $564.11, but it opened October 15 well below that and the loss was 11.0%, not 7%. A stop order protects you during the session, not across a night. Large caps gap on earnings, and the card has no earnings rule, because Scanz’s templates do not filter on earnings dates; check the calendar before you buy.
Do the rules work? 20 months of S&P 500 breakouts
To test the card on more than a dozen trades, the same rules were run over every S&P 500 breakout from December 17, 2024 to August 31, 2026, with exits through November 20, 2026.
How it was tested. The 503 stocks in the S&P 500 on November 20, 2026, daily bars from Yahoo Finance. A breakout is the first close above the highest high of the 260 sessions before it, with no such close in the ten sessions before. The card’s rules exactly as above: RVOL of the breakout day against its 20-day average, the S&P 500 ETF against its 50-day average of closes, the base measured from the session of the old high, entry at the next open only within 0% to 5% above the old high, stop at 7% (filled at the open when it gapped below), target at 20%, otherwise out on the first close below the 50-day average on volume above the 50-day average volume. When the stop and target fell in the same session, the stop was counted. No commissions or slippage.
| Group | Trades | Winners | Average win | Average loss | Average result | Total |
|---|---|---|---|---|---|---|
| The card | 136 | 40 (29%) | +12.5% | −6.1% | −0.09R | −12.2R |
| Card, but the market below its 50-day line | 26 | 5 (19%) | +6.6% | −5.3% | −0.43R | −11.2R |
| Card, but a base under five weeks | 128 | 33 (26%) | +12.0% | −6.0% | −0.20R | −25.6R |
| Card, but volume under 1.5 times average | 250 | 79 (32%) | +12.6% | −5.5% | +0.03R | +8.4R |
| Every first breakout opening in the buy zone | 1,249 | 372 (30%) | +12.0% | −5.7% | −0.06R | −72.0R |
Of the card’s 136 trades, 21 reached +20%, 62 were stopped and 53 left on the 50-day rule. A further 42 breakouts were skipped because they opened more than 5% above the old high, and 17 because they opened back below it.
Split by year, the card earned +0.09R a trade on 78 breakouts from December 2024 to November 2025 (36% winners) and −0.34R on 58 from December 2025 to August 2026 (21% winners). The same rules, a different market.
What the test says. Plainly: in large caps over these 20 months, buying 52-week high breakouts on these rules was close to break-even, and no single rule turned it into an edge. Three findings are worth more than the total:
- The market rule mattered most. Breakouts taken with the S&P 500 below its 50-day line lost 0.43R a trade and none of the 26 reached the target. Skipping them is the easiest improvement there is.
- The base mattered. Stocks that had set their old high less than five weeks earlier did more than twice as badly per trade as stocks with a base.
- The volume rule did not separate winners from losers here. Breakouts on less than 1.5 times average volume did slightly better than the card. That runs against IBD’s teaching and matches Thomas Bulkowski’s study of more than 8,000 chart-pattern breakouts, where high-volume upward breakouts gained only 1.8 points more, failed more often (14% against 5%) and pulled back three times as often (Bulkowski). Heavy volume says demand is real today; it does not say the stock will hold its gains.
What that means for the card. Run with only the base and market rules and the 300,000-share floor, the same 20 months gave 386 trades, 31% winners and −0.01R a trade, no better or worse than the card. Sorted by the breakout day’s relative volume, there was no slope: under 1 times average, +0.06R a trade (90 trades); 1 to 1.5, +0.02R (160); 1.5 to 2, −0.05R (57); 2 to 3, −0.22R (49); 3 and up, +0.04R (30). The card keeps the 1.5 rule because it is the confirmation most breakout traders use and what the scan lists, and it keeps you to stocks with real attention and real liquidity. It should not be read as a quality score. If you want a wider list, lower the RVOL rule in your copy of the scan to 1.0; in this sample the record was about the same (296 trades, −0.03R a trade), and the base and the market did the sorting.
What it does not say. The S&P 500 list is today’s, so it includes stocks that were added because they rose and leaves out ones that fell out; that flatters breakouts. It is large caps only, while the scan covers every listed common stock. It uses a fixed 7% stop, while many traders stop under the base or the old high. And it is twenty months. Treat it as a description of how this plan behaved, not a forecast.
What are the other ways to trade a 52-week high breakout?
The first pullback to the old high. After a breakout, the stock often comes back to the level it broke. IBD says up to 40% of big winners retreat to their proper buy points (IBD via Yahoo Finance); Upstox’s playbook waits three to five days for that retest and buys if it holds on lighter volume (Upstox). Rules to test it: within ten sessions of the breakout, a day whose low comes within 1% of the old high and closes above it; buy that close; same stop, target and 50-day exit. On the same 20 months, after breakouts on 1.5 times volume, 101 such pullbacks came and the trade lost 0.16R a trade (33% winners); after quieter breakouts, it made 0.09R. It gives a better price, not a better record. Find yesterday’s breakouts with the scan’s Data set to the previous day and set price alerts at the old highs.
Variation: the first pullback to the old high (as tested)
- The list
- A stock that met the main card's breakout rules in the last ten sessions: find them with the scan's Data set to a previous day
- Setup
- Within ten sessions of the breakout, a day whose low comes within 1% of the old 52-week high
- Trigger
- That day closes above the old high
- Entry
- At that close, 3:55–4:00 pm ET
- Stop, target, exit
- 7% below the entry, +20%, or a close below the 50-day line on above-average volume, as on the main card
- Skip it when
- The pullback closes below the old high; the market is below its 50-day line; it has been more than ten sessions
- In the test
- 101 trades after breakouts on 1.5 times volume: 33% winners, −0.16R a trade. 195 after quieter breakouts: +0.09R a trade.
Buying it as it breaks. IBD’s own buy is intraday, as the stock clears its buy point on volume running well above normal. Scanz’s RVOL is not matched to the time of day, so it cannot tell you at 11:00 am whether volume is “running” 50% ahead; New 52-Week Highs tells you when the break prints, and the 5-minute volume against the bars before it is your read. You get a lower price than the next open and give up knowing the close.
The day trade. Day traders trade the level itself, for minutes, not months. One published version: from 9:45 to 11:30 am ET, buy the close of the first 5-minute candle above the 52-week high if its volume is at least 1.5 times that slot’s average, and get out on a 5-minute close back under the level (Day Trading Toolkit). New 52-Week Highs is the alert for it; Scanz has no same-time-of-day volume average, so compare the break bar with the bars before it. The high of day guide has full rules for intraday breaks, and the VWAP guide for the line that tells you whether it is holding.
Variation: the intraday break, for day traders
- The alert
- New 52-Week Highs fires on the stock, with its Type filter leaving out ETFs
- Time window
- 9:45 to 11:30 am ET
- Trigger
- The first 5-minute bar that closes above the old 52-week high, on more volume than any of the six bars before it
- Entry
- At the close of that bar
- Stop
- A 5-minute close back under the old high, or the low of the trigger bar, whichever comes first
- Exit
- Half off at 1R; trail the rest under each higher 5-minute low; all out by 3:55 pm (this page's choice, not the published rules)
- Skip it when
- It gapped several percent above the old high at the open (that is a gap-and-go, not a break of the level); the S&P 500 is below VWAP or the break bar's range is more than a third of the day's range so far (both this page's additions)
This card is the page’s own version of the published day-trade rules above: the window and the close-back-under exit are theirs, the volume test, the 1R exit and the last two skip rules are this page’s. None of it was part of the test, which used daily bars.
Near the high, before the break. Many swing traders keep a list of stocks within a few percent of their high so they are ready. Minervini’s trend template, as commonly reproduced, wants a stock within 25% of its 52-week high and at least 30% above its 52-week low. Start from the 20-Day High Break template for stocks already clearing a month’s range, and set price alerts at their yearly highs.
When does a 52-week high breakout fail?
- It closes back under the old high. The most common failure. The card’s close rule removes the same-day version; a close back under the level in the days after is the first warning, and the 7% stop is the decision.
- The market turns. Most stocks follow the market. In the test, breakouts in a weak market did worst of every group.
- There was no base. A stock making new highs every week is extended, and a breakout from it is a continuation with no range behind it to hold.
- It was bought too high. A stock that opens 6% above the old high needs a 13% fall to reach a 7% stop below the level; a normal pullback does most of that.
- It gapped. Earnings, guidance and analyst days move large caps overnight. A stop does not fill at its price across a gap: AMD’s 7% stop cost 11%.
- The volume was one event. An index addition, a merger announcement or a block trade can put a stock over 1.5 times average with no buyers left the next day. Read the news on the row before you buy.
- The feed was the wrong market. On a down day the new-highs feed is inverse and leveraged ETFs. They are new highs, but not the breakout this page is about.
What Scanz cannot do for this setup: it has no pattern recognition, so it cannot tell a base from a run; it does not filter on earnings dates; its RVOL is not matched to the time of day, so the volume rule is only final at the close; and it does not make a market call for you.
The checklist before you take the trade
Before the next open
- Was the stock on 52-Week High Break after the close: above the old high, RVOL ≥ 1.5, 300,000 shares in regular hours?
- Did it close above the old 52-week high, not just trade above it?
- Was the old high set at least five weeks before, with a base under it?
- Is the S&P 500 above its 50-day moving average?
- Do you know why the volume came: earnings, news, an index change?
- Is there an earnings report before your trade is likely to be done?
- Did it open above the old high and no more than 5% above it?
- Is the size your dollar risk divided by 7% of the entry price?
- Is the stop 7% below the entry, and is the +20% target set?
- Will you sell on a close below the 50-day line on above-average volume?
Questions traders ask
Is it good to buy a stock at its 52-week high?
It can be, and it goes against instinct. Research on US stocks from 1963 to 2001 found stocks near their 52-week high went on to beat stocks far from it over the following six months. But that is a ranked portfolio, not one breakout; in this page's test of single breakouts in the S&P 500, the trade was close to break-even, and the market and the base decided more than the breakout itself.
What happens when a stock breaks its 52-week high?
Volume usually jumps, because stops, buy orders and alerts sit at the level, and everyone who bought in the past year is now in profit. Then the stock either holds above the old high, often after a pullback to it, or closes back under it, which is the most common failure.
How do you confirm a 52-week high breakout?
Most traders use the daily close and the day's volume: a close above the old high, on at least 1.5 times an average day's volume (IBD uses 40% above the 50-day average). Many also want a base of at least five weeks below the high and a market in an uptrend.
Is the 52-week high based on the close or the intraday high?
It differs by platform. Most use the highest intraday price of the past 52 weeks; some use the highest close. Scanz's 52-Week High Break uses the highest high of the 260 daily candles before today, including pre-market and after-hours trades.
Where do you put the stop on a 52-week high breakout?
O'Neil's rule is 7% to 8% below the purchase price, the stop this page tests. Others stop under the low of the base or a little under the old high. A tighter stop gets hit more often by normal pullbacks to the level.
How long do you hold a 52-week high breakout?
In this page's test the median trade lasted 38 calendar days from the breakout: about two weeks for the stops, seven weeks for the targets and eight for the 50-day exits. Day traders trade the same level for minutes and are out on a 5-minute close back under it.
What is the difference between a 52-week high and an all-time high?
A 52-week high is the highest price of the past year; an all-time high is the highest price ever. Every all-time high is also a 52-week high, but a stock can break its 52-week high while still far below a peak from years ago, with old holders above waiting to sell.
How do I find stocks breaking their 52-week high today?
In Scanz, the New 52-Week Highs signal shows each new one-year high as it prints, and the 52-Week High Break scan lists stocks above the old high on 1.5 times their normal volume. Read the scan after 4:00 pm ET: its volume rule compares with a whole day, so many breakouts only qualify with the closing print.