Jump to: The scan · The numbers · The card · Example · The test · Variations · Failures · Checklist
What is a short squeeze, and what actually moves the price?
A short seller borrows shares, sells them, and hopes to buy them back cheaper. If the price rises instead, the loss grows with every tick, and the only way out is to buy. A short squeeze is what happens when many short sellers have to do that at once: their buying pushes the price up, which puts the next short seller deeper underwater, who buys too.
That is the mechanism every article describes. The part that matters for a trader is how small it usually is next to everything else. When SEC staff studied GameStop’s January 2021 run, the most famous squeeze there is, they found buying by those covering shorts was “a small fraction of overall buy volume”, and that “it was the positive sentiment, not the buying-to-cover, that sustained the weeks-long price appreciation” (SEC staff report, 2021). The same report did find covering in the sharpest bursts, where at times it was a large share of the net buying.
The November 19, 2026 example on this page shows the same thing in numbers. Vivid Seats (SEAT) had 1,020,361 shares sold short, 27.84% of its float in Scanz. That day it traded 124 million shares. If every short had covered, it would have been under 1% of the day’s volume. What moved SEAT was a headline and everyone who bought it.
So treat short interest as fuel, not as the spark. The shorts are the traders who will be forced to buy if the price breaks above where they sold; the trade on this page waits for that break, and for the volume that shows it is real.
How do you scan for short squeeze stocks?
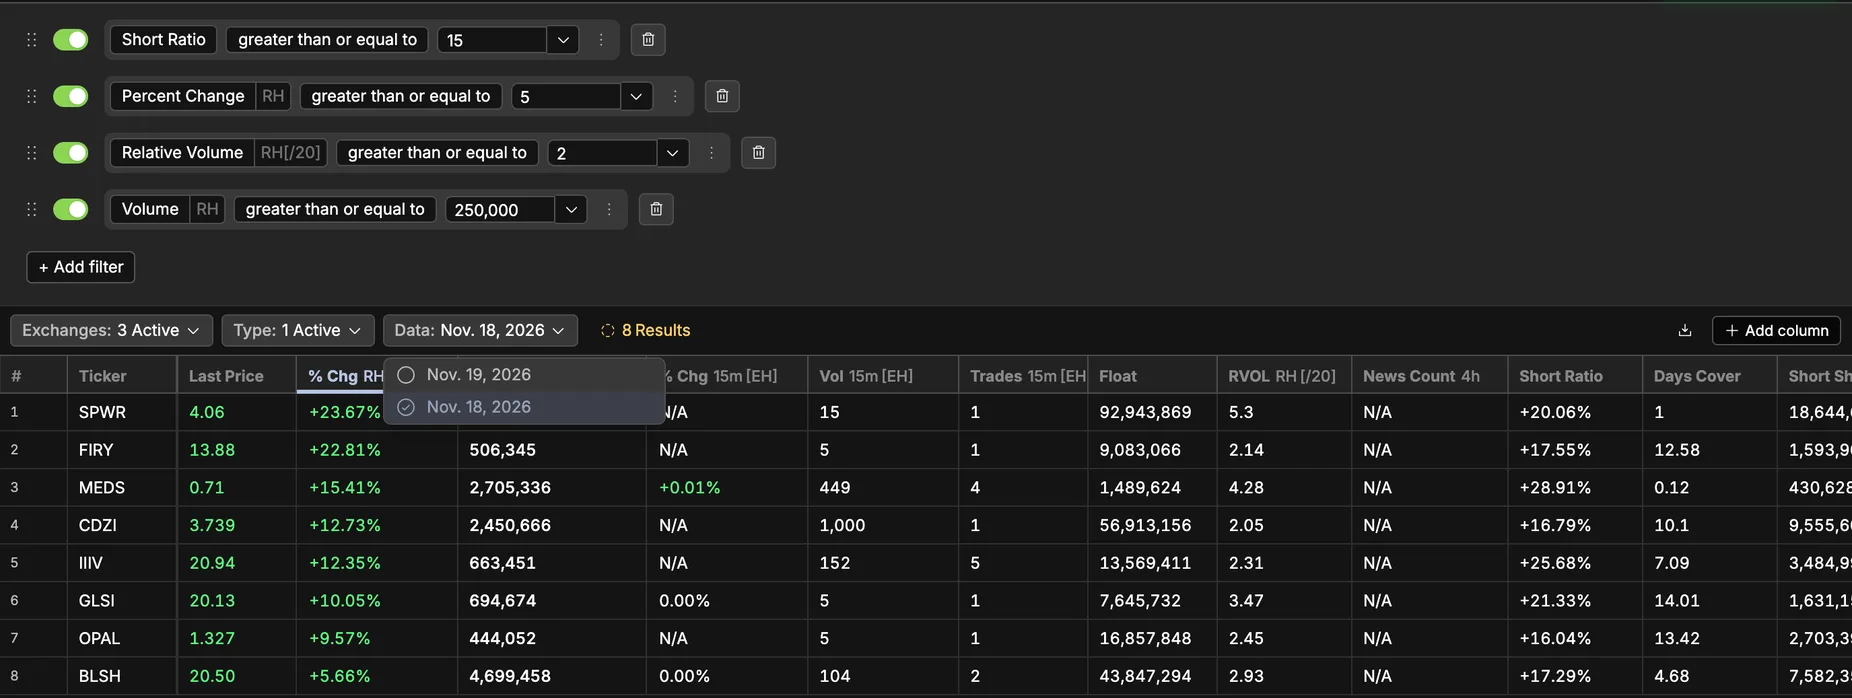
The list has to answer two questions at once: is a lot of the float sold short, and is the stock moving today on real volume. Scanz has a ready-made scan for that, Short Squeeze Watch. This is what it returned for November 19, 2026, with short-interest columns added.
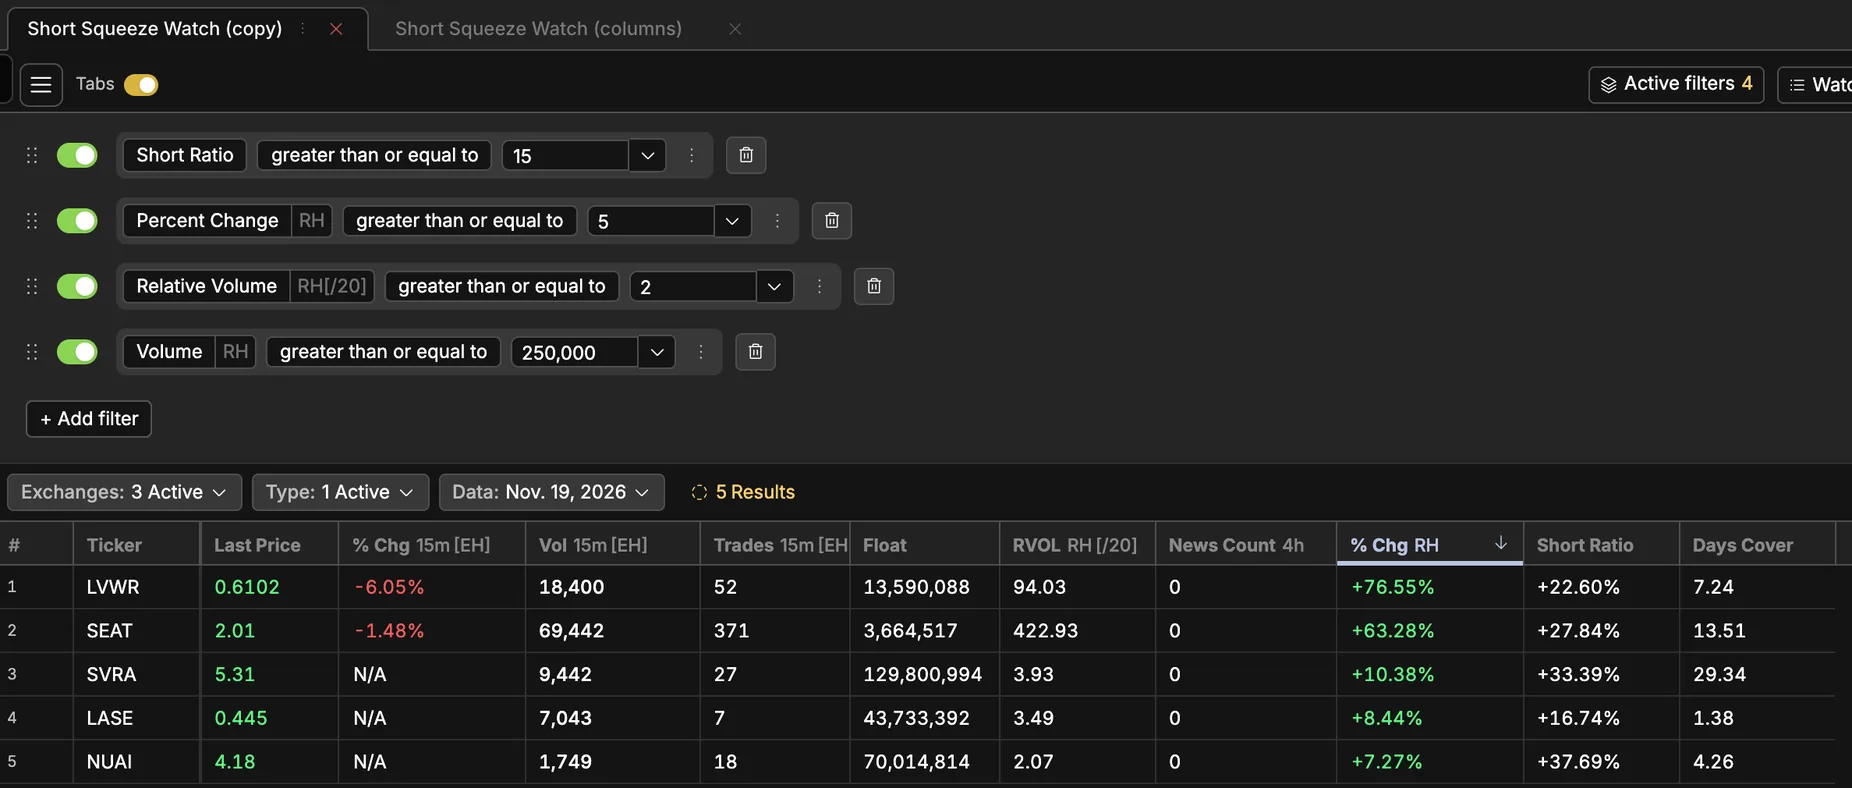
These are its rules exactly as the template stores them, under the names the filter bar shows.
The scan · Data Scanner · Regular hours, 9:30 am–4:00 pm ET
Short Squeeze Watch
| Rule | Setting | Why it's there |
|---|---|---|
| Short Ratio | ≥ 15 (short interest as a % of the float) | A big enough share of the float sold short that covering could matter. The template's own card calls it Short % float. |
| Percent Change (Regular Hours) | ≥ 5% vs the previous close | Only stocks already moving up today: the shorts are losing money now, not in theory. |
| Relative Volume (Regular Hours, 20-day average) | ≥ 2 | Today's regular-hours volume so far is at least twice an average day's. It keeps out heavily shorted stocks drifting up on nothing. |
| Volume (Regular Hours) | ≥ 250,000 shares | Enough trading to get in and out. |
The template shows Ticker, Last Price, % Chg 15m, Vol 15m, Trades 15m, Float, RVOL RH (20-day) and News Count 4h, sorted by the 15-minute change, and no short-interest column. In your copy, click + Add column and add Short Ratio, Days to Cover and Short Shares from the Short Interest group, and Percent Change set to Regular Hours to see the day's move.
7 days of Pro free, card required: this list with its short-interest columns. At this page's pace a five-session trial week brings a few triggers, or none: the two sessions tested brought two. After day 7 it renews on the plan chosen at sign-up, Starter at $89/month or Pro at $199/month, unless you cancel in the app.
About the name. The filter the template uses is called Short Ratio in the filter bar and the column header. It holds short interest as a percent of the float: LVWR’s 22.60 is its 3,071,728 short shares divided by its 13,590,088-share float. Days to cover is a separate filter, Days to Cover (the column header says Days Cover). A stock’s Montage shows the same figures in its Fundamentals tab, under Short Interest: shares short, shares short the prior month, short percent of float, days to cover and the month-over-month change.
The RVOL rule joins late. Relative Volume here is regular-hours volume so far divided by the average of the last 20 full days. It is not matched to the time of day (filter reference), so a stock trading at three times its usual pace at 10:00 am still reads under 2, because most of its day is still to come. In the test below, the RVOL rule added a stock a median of about an hour and a half after the other three rules were met, and four of the 13 only qualified after 3:30 pm, too late for the rules to trade. A stock showing up on this list is not the start of its move; on many days it is the middle.
How old is the short interest number?
Short interest is reported data, not a live count. Brokers report their customers’ short positions to FINRA twice a month, as of a mid-month and a month-end settlement date, and FINRA publishes the totals on the seventh business day after it (FINRA). Positions held on Friday, November 13, 2026 are published on Tuesday, November 24; those of November 30, on December 9. So on November 19 the newest figures anyone had described positions at the end of October, and a short who covered on November 2 still counted. FINRA proposed weekly reporting in May 2026 and withdrew the proposal in August (SR-FINRA-2026-012), so twice a month is still the schedule. Scanz does not show which settlement date a figure comes from.
Scanz also has no hard-to-borrow, locate or borrow-fee data, as a filter or a column (what Scanz doesn’t filter for). A rising borrow fee is one of the best live signs that shorts are under pressure; if you want it, ask your broker.
Variations on the scan
Days to cover first. Days-to-Cover Heavies, in the same Low Float & Squeeze group, swaps the short-percent rule for days to cover of 5 or more, with RVOL of 3 or more, a 3% gain and 250,000 shares. Days to cover is short interest divided by average daily volume: how many normal days it would take every short to buy back. Of the 13 stocks in the test, GLSI, LVWR, SEAT and SVRA met its rules too.
An earlier list. Copy the scan and switch the Relative Volume rule off with the toggle at its left; Volume of 250,000 or more and the card’s own volume test stay. In the test below, the same 13 stocks joined this list a median of about 90 minutes sooner, and the card took five trades for +1.08R instead of two for −2R. That rests on two sessions and on stocks that had all passed the RVOL rule by the close; the earlier list would also have held stocks still under 2, which nobody tested. So the card stays on the template, and the earlier copy is one to run beside it and count.
Before the bell. Short Squeeze Watch counts only regular hours, so SEAT’s pre-market squeeze on November 19 came and went before it could list it. To watch earlier, copy the scan and switch the session on Percent Change, Volume and Relative Volume to Pre-Market (pre-market scanning).
How much short interest is enough?
There is no official line. Commonly cited rules of thumb call 20% of the float high and 30% or more extreme; the Scanz template takes 15%. For scale, SEC staff counted that for large companies short interest “is often less than 2.5%”, for small ones “less than 13%”, and “Few stocks, if any, have short interest greater than 50% on a given date”. GameStop was the exception: 122.97% of its float in January 2021, possible because the same shares were lent more than once (SEC staff report).
The three numbers on the scan tell you different things:
| Number | What it is | What it says | November 19, 2026 |
|---|---|---|---|
| Short % of float (the Short Ratio column) | Shares sold short ÷ the float | How crowded the short side is | NUAI 37.69%, SEAT 27.84%, LVWR 22.60% |
| Days to cover | Shares sold short ÷ average daily volume | How long covering would take on a normal day | SVRA 29.34, SEAT 13.51, LVWR 7.24, LASE 1.38 |
| Float | Shares free to trade | How few shares there are to buy back | SEAT 3,664,517, LVWR 13,590,088 |
Days to cover matters less on a squeeze day than it looks: it is measured against normal volume, and squeeze days are not normal. SEAT showed 13.51 days to cover on November 19, and traded more shares than its whole short interest in the first ten minutes of its pre-market run.
A high short interest is not a buy signal on its own. Heavily shorted stocks, as a group, do worse than other stocks afterwards. One study of US stocks found those with “relatively high short interest subsequently experience negative abnormal returns”, though the effect “can be transient” (Boehmer, Huszar and Jordan, 2010); another found equal-weighted portfolios of high short interest stocks underperform while value-weighted ones do not, which points at small companies (Asquith, Pathak and Ritter, 2004). Short sellers are often right. The squeeze is the exception, which is why the rules below never buy a stock for being shorted; they wait for it to break where the shorts sold.
What are the entry, stop and exit rules?
The play traders actually trade in a squeeze is the momentum breakout: the stock clears a level shorts are defending, the shorts who sold under it start buying, and you are in with them. This card trades that, and nothing else.
The setup on one card
- In play
- On the Short Squeeze Watch list when the trigger bar closes
- Time window
- No entry in the first five minutes (9:30–9:35 am ET); no new trade after 3:30 pm ET
- Level
- The highest of yesterday's regular-session high, today's pre-market high and today's high before the trigger bar opens
- Trigger
- A 5-minute bar that closes above the level on at least twice the average volume of today's earlier regular-session 5-minute bars (from 9:30 to the bar before it)
- Entry
- At the close of the trigger bar
- Stop
- Under the trigger bar's low. Shares = the dollars you will risk ÷ the distance from the entry to the stop
- Exits
- Half off at 1R. Trail the rest under the previous 5-minute bar's low. Anything still open comes off by 3:55 pm ET: nothing is held after hours or overnight
- Attempts
- Two a stock a day. After a stop, the level is the day's high
- Size
- Half your normal dollar risk when the stop is more than 10% under the entry
- Skip it when
- The spread is more than a tenth of the risk; a registration or offering filing is out today: S-1 or S-3, F-1 or F-3 from a foreign company, or a 424B prospectus supplement
Why each rule is there
- On the list when the bar closes. The list is the reason to look at all: a heavily shorted stock that is up, on volume. Because the list updates as the session trades, a stock can join it during the very bar that triggers; LVWR did.
- The highest of three levels. Yesterday’s high is where yesterday’s late shorts sold; the pre-market high is where this morning’s did; the day’s high is where today’s did. Above all three, every short from the last day is losing money, and the ones with stops have them just above.
- A close, on twice the volume. A stock can poke through a level and fall back inside the bar. The close shows it held; the volume, that more traders bought the break than sold it.
- No entry in the first five minutes. The open is where the night’s buyers meet the day’s sellers: SEAT’s first bar on November 19 traded 6,855,115 shares and closed 16 cents under its open.
- Half at 1R, trail the rest tight. Squeeze spikes reverse as fast as they rise. LVWR fell from $0.738 to $0.383 in two bars.
- No new trade after 3:30 pm. Everything comes off by 3:55, so a later entry has under 25 minutes to work.
- Two attempts a stock a day. It caps what one stock that keeps failing can cost you at 2R.
- A spread under a tenth of the risk. Buying at the ask and selling at the bid costs about one spread, so at a tenth of the risk the round trip costs about 0.1R before the stock moves.
- No offering filed today. A company whose stock is squeezing has a reason to sell shares into it, and new shares are usually priced under the market.
How to size it
A stock back under the trigger bar’s low has failed the break, so the stop goes there and the share count comes from it: the dollars you will lose ÷ the distance to the stop. The two trades below show the range. GLSI’s stop was 53 cents under a $21.48 entry, 2.5%: with $100 at risk that is 188 shares, about $4,040 of stock. LVWR’s was 14.84 cents under $0.6199, 24%: over 10%, so half risk, $50, which is 336 shares, about $208 of stock. A spike bar makes a wide stop, and a wide stop makes a small position.
What a halt does to your stop
A stop fills at the reopen, not at its price. Under the Limit Up-Limit Down plan, 15 seconds at the band around the last five minutes’ average price brings a five-minute pause: the band is 10% for most stocks over $3, 20% from $0.75 to $3, and the lesser of 15 cents or 75% under $0.75 (LULD plan). A squeezing stock can reach it in seconds, in either direction. Scanz carries no halt data; a pause leaves a 5-minute bar with no trades. None of the 13 stocks in the test left one during regular hours.
A real example: SEAT and LVWR on November 19, 2026
Both topped the November 19 list, and both had more than a fifth of their float sold short. One squeezed before the bell and faded all day; the other did nothing for 45 minutes, then rose 54% inside one 5-minute bar. Prices, times and volumes are read from the Scanz 5-minute chart and Montage, and short figures are the ones Scanz showed; volume is shares per bar.
SEAT (Vivid Seats) closed at $1.275 on November 18, on 102,782 shares, with a regular-session high of $1.30. Its float in Scanz was 3,664,517 shares, 27.84% of it sold short, with 13.51 days to cover. At 4:30 am on November 19 it put out “Vivid Seats Enters Into Transaction Support Agreement for Comprehensive Recapitalization”, followed by an 8-K at 5:11 am.
The result: no trade. SEAT was on the list from the first bar, and it never closed above its $2.85 pre-market high. A buyer of the open was down 17% at the close.
| Time (ET) | What SEAT did | What the rules said |
|---|---|---|
| 6:30–7:20 | Traded between $1.10 and $1.73 on about 360,000 shares | The chart’s first bars. Not on the list: the scan counts regular hours only. |
| 7:25–8:00 | Squeezed from $1.40 to $2.80: 18.2 million shares in eight bars, 6.4 million of them in the 8:00 bar | Five times the float in 40 minutes. |
| 8:05–8:30 | Fell to $1.85 | Two-thirds of the move given back before the bell. |
| 9:00 | Spiked to $2.85 on 5,314,503 shares, then closed the bar at $2.54 | Mark the level: the $2.85 pre-market high. Pre-market volume ended at 65.7 million shares, 18 times the float. |
| 9:30 | Opened at $2.52, made its regular-session high, $2.62, and closed the bar at $2.36 on 6,855,115 shares | On the list from the first bar. No entry in the first five minutes. |
| 9:40 | Closed at $2.54 | Under $2.85: no trigger. |
| 9:45–10:25 | Fell to $1.73 | 31% under the open. |
| 10:30–3:55 | Made the day’s low, $1.67, at 1:55 pm; closed at $2.09, up 63.28% | No close above $2.85 all day, no trade. Rotation 16: the float traded 16 times in regular hours. |
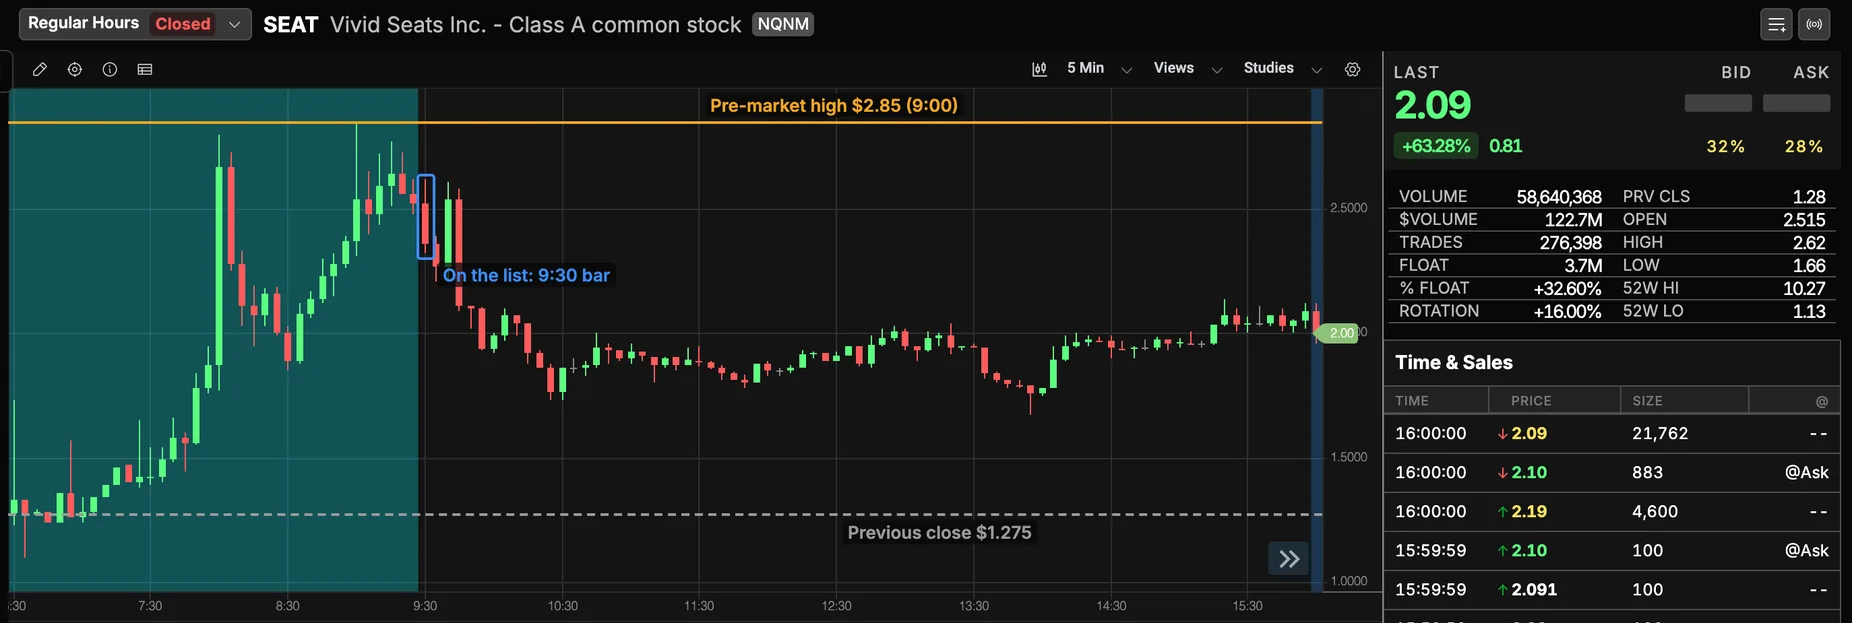
SEAT is the most common shape of a squeeze day: the move happens on the news, before most traders’ scans are running, and the regular session is the unwind. A deal that rewrites a company’s balance sheet can change its share count, and with it the float and short percent on the list.
LVWR (LiveWire Group) closed at about $0.37 on November 18, with a regular-session high of $0.3899. Its float in Scanz was 13,590,088 shares of 205.4 million outstanding (insiders own 94.06%), 22.60% of the float sold short, with 7.24 days to cover. Scanz’s news feed shows no headline or filing for LVWR on November 18 or 19; its last was an 8-K on November 17.
The result: one trade, in at $0.6199 at 10:20 and stopped at 10:25 for −1R, on a stock that closed up 76.55%.
| Time (ET) | What LVWR did | What the rules said |
|---|---|---|
| 4:00–9:25 | Traded 11,572 shares all morning, at no more than $0.3701 | Not on any list. The level: yesterday’s $0.3899 high. |
| 9:30–10:10 | Opened at $0.382 and crept to $0.4755 on light volume, 5,704 shares in the first bar | Up 5% by 9:40, but nowhere near twice an average day’s volume. Not on the list. |
| 10:15 | Traded 1,000,976 shares and hit $0.5328 | The level is now the day’s high: $0.5328. |
| 10:20 | Ran to $0.738 and closed at $0.6199 on 5,135,655 shares; RVOL passed 2, and LVWR joined the list | Trigger: a close above $0.5328 on 44 times the session’s average 5-minute bar of 115,755 shares. Entry $0.6199, stop under the bar’s $0.4715 low, risk 14.84 cents (24%), 1R at $0.7683. Half size. |
| 10:25 | Traded to $0.6479 and closed at its low, $0.47, on 3,513,208 shares | Stopped at $0.4715: −1R. |
| 10:30 | Fell to $0.383 | 48% under the 10:20 high, two bars later. |
| 10:45–10:50 | Ran back to $0.60 on 10.7 million shares | After the stop the level is the day’s high, $0.738. No close above it. |
| 11:00–3:30 | Slid to $0.425 by 11:20, then climbed through the afternoon | No trigger. |
| 3:35 | Made $0.7125 | Still under $0.738. |
| 4:00 | Closed up 76.55% on 63.5 million shares | Rotation 4.7: the float traded nearly five times. |
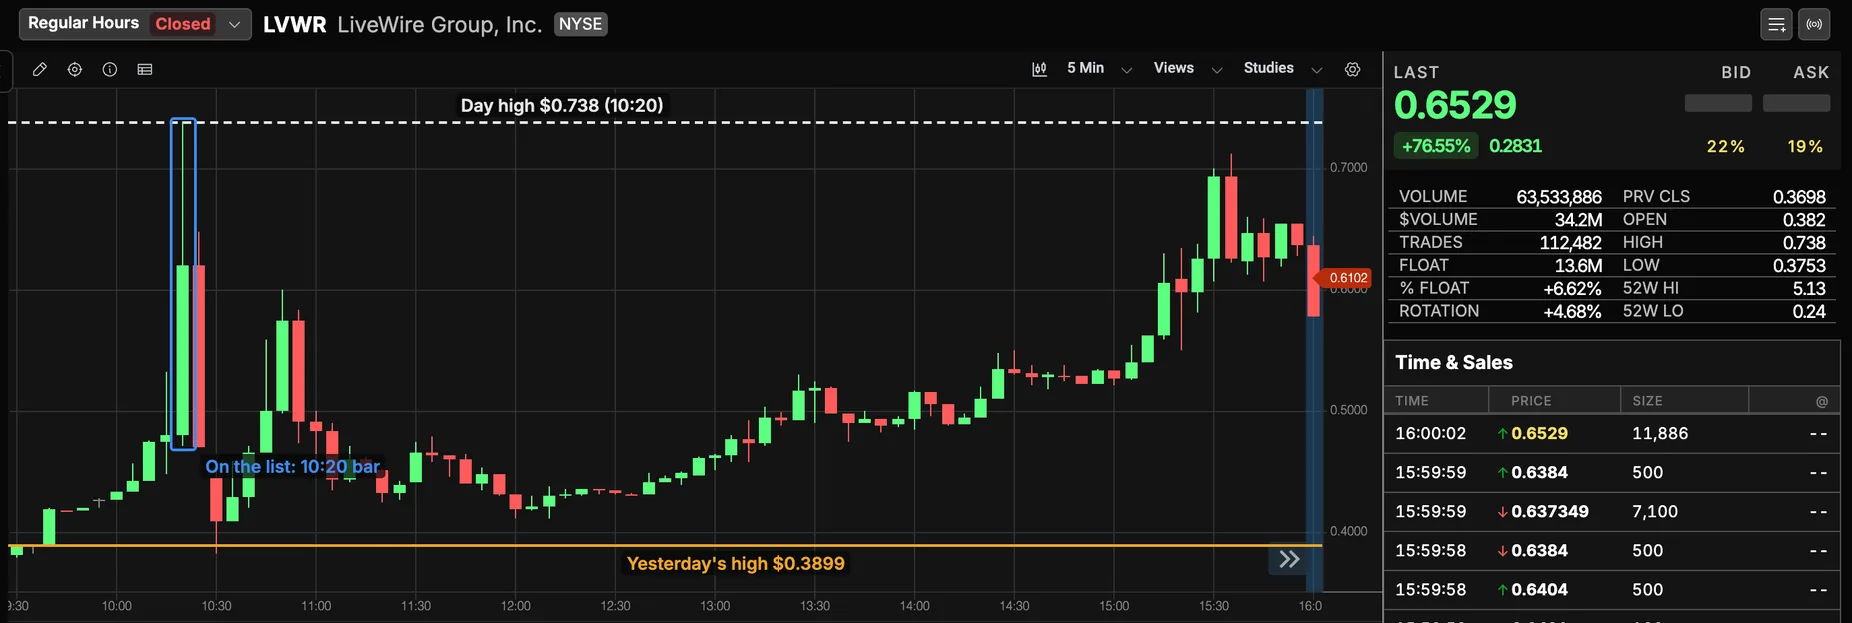
The trigger and the list arrived together because LVWR had no pre-market and no early volume: the RVOL rule could only be met by the spike itself. A trigger on the bar that made the move gives the widest possible stop, and here a 1R target above the bar’s own high. The card took the trade at half size and lost 1R; the rules then waited for a close above $0.738, which never came.
GLSI, November 18: the other trade
Greenwich LifeSciences closed at $18.70 on November 17, up 36% after it announced, at 4:00 am, that abstracts had been accepted at the San Antonio Breast Cancer Symposium. On November 18, its second day, 21.33% of its 7,645,732-share float was short, with 14.01 days to cover. It traded 674,675 shares in regular hours, less than half the roughly 1.6 million shares sold short.
| Time (ET) | What GLSI did | What the rules said |
|---|---|---|
| 9:30–10:30 | Opened at $18.51 and climbed to $21.22 by 10:30 | Past yesterday’s $19.20 high; the level is the day’s high, $21.22. Not on the list yet. |
| 10:35–11:55 | Drifted back to $19.12 by 11:15, on bars as small as 436 shares | |
| 12:00 | Closed at $20.13; RVOL passed 2, and GLSI joined the list | On the list, under the level. |
| 12:05–1:40 | Closed no higher than $20.97, in bars of 63 to 16,239 shares | Under $21.22: no trigger. |
| 1:45 | Traded to $21.93 and closed at $21.48 on 43,541 shares | Trigger: a close above $21.22 on 4.7 times the session’s average bar (9,301). Entry $21.48, stop under the bar’s $20.95 low, risk 53 cents, 1R at $22.01. |
| 1:50–1:55 | Closed at $21.27, then traded to $20.90 | Stopped at $20.95: −1R. |
| 2:00–4:00 | Closed at $20.62 | No second trigger. |
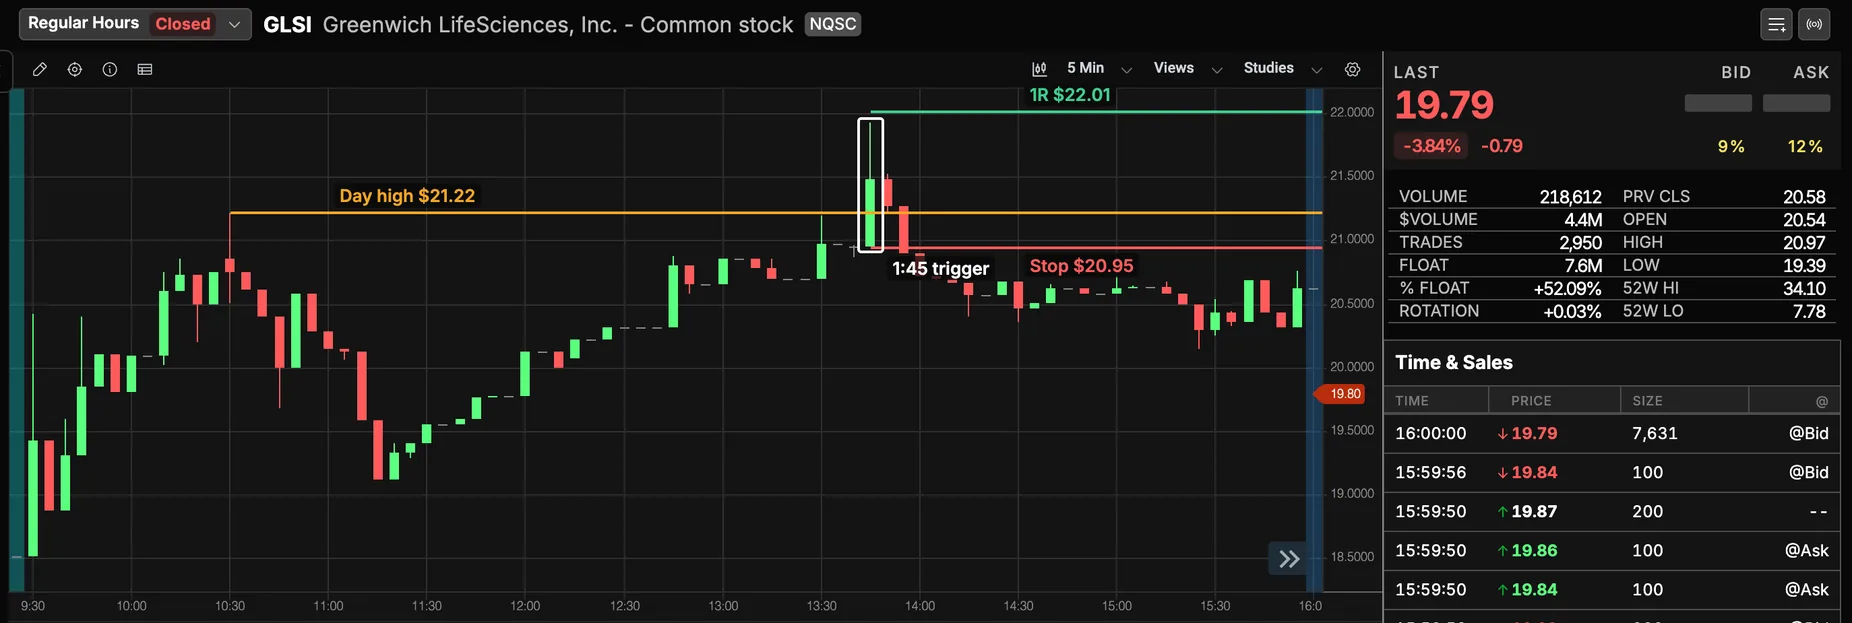
GLSI is what a thin squeeze candidate looks like at midday: bars of a few hundred shares, then one bar of 43,541 that clears the level, and nothing behind it. Twice the session’s average bar is a low bar to clear when the average is 9,301 shares.
MEDS, November 18: the one exit worked in full
The two trades above both stopped out, so neither shows the exit. MEDS does, with one caveat: it comes from the earlier list (the template without its RVOL rule, from the test below), which added MEDS at 11:00. The template itself added it at 12:00, on the day’s top bar.
DataMeds AI closed at $0.6201 on November 17. At 4:00 am on the 18th its subsidiary announced a drug-discovery partnership; it had filed 424B5 prospectus supplements on November 16 and 17. Its float in Scanz was 1,489,624 shares, 28.91% of it short (430,628 shares), with 0.12 days to cover.
| Time (ET) | What MEDS did | What the rules said |
|---|---|---|
| 7:30 | Set a pre-market high of $0.66 | The level: $0.66, above yesterday’s $0.6447 high. |
| 9:30–10:20 | Opened at $0.6625, dipped to $0.621, then climbed to $0.7167 | Past $0.66; the level is the day’s high, $0.7167. |
| 11:00 | Up 5% with 250,000 shares traded | On the earlier list. Not yet on the template’s. |
| 11:10–11:15 | Hit $0.7192, then closed at $0.7183 on 71,521 shares | The level is $0.7192. A close nine-hundredths of a cent under it: no trigger. |
| 11:20 | Closed at $0.7363 on 36,056 shares | Trigger: 2.1 times the session’s average bar of 17,511. Entry $0.7363, stop under the bar’s $0.7183 low, risk 1.8 cents (2.4%), 1R at $0.7543. |
| 11:25–11:40 | Held between $0.7297 and $0.74 | Above the stop. |
| 11:45 | Ran to $0.799 on 108,291 shares | Half off at $0.7543: +1R on that half. Trail the rest under this bar’s $0.7492 low. |
| 11:50 | Closed at $0.78, its low | Trail up to $0.78. |
| 11:55 | Traded down to $0.7747 | The rest out at $0.78: +2.43R on that half. The trade: +1.71R. |
| 12:00 | Spiked to $0.8783 on 817,052 shares and closed the bar at $0.7503 | The day’s high, in the bar that put MEDS on the template’s list. |
| 4:00 | Closed at $0.7313 | No close above $0.8783 again. |
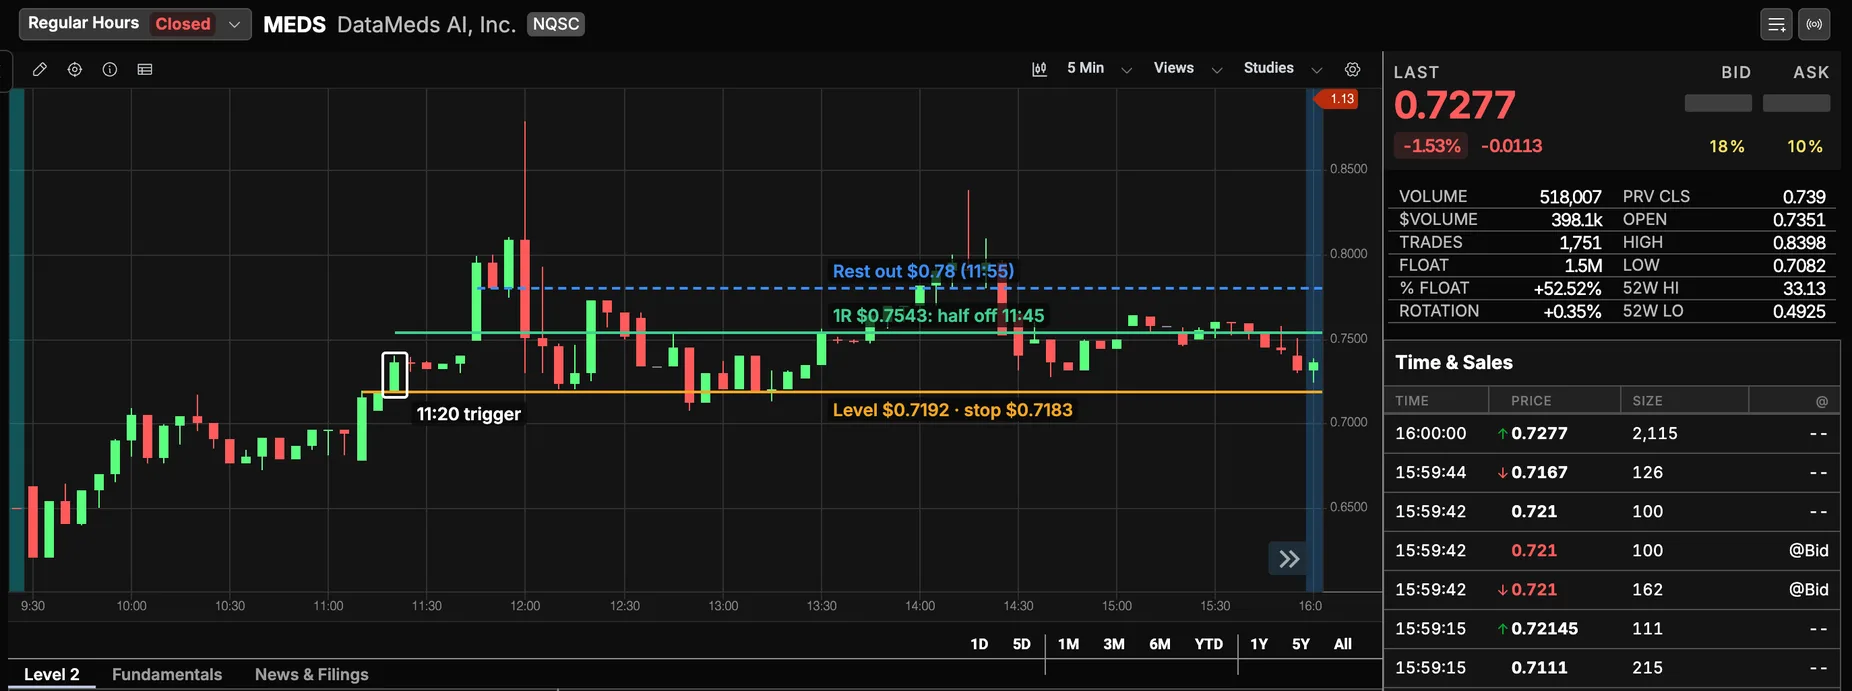
The trail gave up the top: the rest came off at $0.78, one bar before the $0.8783 high. It also kept the gain, because the bar that made the high closed at $0.7503. One caveat the test cannot settle: a 1.8-cent risk passes the spread rule only if the spread was under 0.18 cents, and the spread was not recorded.
Does it work? Two sessions, 13 stocks, two trades
Two trades, both stopped, −2R. Two sessions are far too few to say whether the rules make money; the test shows how they behave, and what the scan’s RVOL rule does to them.
The test ran the card over every stock on the Short Squeeze Watch list for November 18 and 19, 2026, as the list stood after the close: eight stocks and five. Each was traded from the bar it would have joined the list, worked out from its 5-minute bars: the first bar at whose close it was up at least 5% and its regular-hours volume was at least twice its 20-day average and at least 250,000 shares. Two controls ran on the same 13 stock-days: the plain break, which drops the volume test, and the list without its RVOL rule.
| Version | Trades | Winners | Total |
|---|---|---|---|
| The card, on the template’s list | 2 | 0 | −2.00R |
| Plain break, on the template’s list | 2 | 0 | −2.00R |
| The card, without the RVOL rule | 5 | 3 | +1.08R |
| Plain break, without the RVOL rule | 6 | 4 | +1.99R |
The volume test changed nothing on the template’s list: both triggers came on heavy bars. Without the RVOL rule the same 13 stocks joined earlier, and the card took five trades: GLSI and FIRY (−1R each) and three winners, MEDS (+1.71R), SVRA (+1.00R) and LVWR, a bar earlier at 10:15 (+0.37R). The volume test then cost one winner, BLSH (+0.91R on the plain break).
Read that carefully. A list without the RVOL rule would also have held other stocks, ones still under 2 at the close, and none of those were tested. What the test does show is the delay: the RVOL rule put a stock on the list a median of about 90 minutes after its other three rules were met.
| Date | Stock | Short % float | Days to cover | Joins the list | Without RVOL | What the card did | Open → close |
|---|---|---|---|---|---|---|---|
| Nov 18 | SPWR | 20.06% | 1.00 | 11:25 | 11:20 | No trade: never reached yesterday’s $4.6865 high | +21.9% |
| Nov 18 | FIRY | 17.55% | 12.58 | 3:55 pm | 12:15 | Too late to trade | +24.3% |
| Nov 18 | MEDS | 28.91% | 0.12 | 12:00 | 11:00 | No trade | +10.4% |
| Nov 18 | CDZI | 16.79% | 10.10 | At the closing print | 11:45 | Too late to trade | +12.7% |
| Nov 18 | IIIV | 25.68% | 7.09 | 3:50 pm | 12:30 | Too late to trade | 0.0% |
| Nov 18 | GLSI | 21.33% | 14.01 | 12:00 | 10:30 | Trade at 1:45 pm: −1R | +11.4% |
| Nov 18 | OPAL | 16.04% | 13.42 | 3:15 pm | 1:50 pm | No trade | +9.1% |
| Nov 18 | BLSH | 17.29% | 4.68 | 3:30 pm | 9:35 | No trade | −4.8% |
| Nov 19 | LVWR | 22.60% | 7.24 | 10:20 | 10:15 | Trade at 10:20: −1R | +66.7% |
| Nov 19 | SEAT | 27.84% | 13.51 | 9:30 | 9:30 | No trade: never closed above $2.85 | −17.1% |
| Nov 19 | SVRA | 33.39% | 29.34 | 11:05 | 9:45 | No trade | +8.2% |
| Nov 19 | NUAI | 37.69% | 4.26 | 3:55 pm | 9:40 | Too late to trade | +5.6% |
| Nov 19 | LASE | 16.74% | 1.38 | 11:20 | 9:35 | No trade | −6.4% |
Open → close runs from the 9:30 open to the 3:55 bar’s close. The column is mostly positive because every stock here was still up 5% at the close: that is how it got on a list read after the close.
Nothing in the short columns separated the two trades from the rest. NUAI and SVRA had the most shorted floats and neither traded; SVRA’s 29.34 days to cover was the highest on either day, and it rose 8% from the open.
How the test was run, and what it misses
The card was written before the bars were read and not changed after, with one exception: the in-play rule first required a stock to be on the list before the trigger bar began. LVWR showed that a list read live adds a stock during the bar, so the rule became “on the list when the trigger bar closes”, which turned LVWR’s 10:20 bar from no trade into the −1R trade above.
- Survivorship. The lists were read after the close, so they hold only stocks still meeting all four rules at 4:00. A stock that made the list at 10:00 and faded under 5% by the close is missing, and those are exactly the failed squeezes.
- Two sessions. November 18 and 19 are the whole sample. Two trades say nothing about an edge either way.
- Join times are worked out, not seen. They come from the 5-minute bars’ running volume and the 20-day average implied by the close’s RVOL. The bars miss some prints: CDZI’s only add up to RVOL 2 with its closing auction.
- The spread was not recorded. The test assumed a one-cent spread on stocks over $1, which skipped two CDZI triggers in the no-RVOL control. The filing rule was checked against each stock’s Scanz news feed: neither traded stock filed on its trade day.
- Short figures are what Scanz showed on November 19. They describe positions from weeks earlier (how old the number is).
What are the other ways to trade a squeeze?
The breakout above is one play. Traders run at least four others on the same stocks. None is tested here; each is shown with the dated case it fits.
| Play | What it trades | When it fits | From November 18–19 |
|---|---|---|---|
| Pre-market squeeze | The news-driven run before 9:30 | A catalyst before the open and a heavily shorted float | SEAT’s $1.40 to $2.80 between 7:25 and 8:00, then the unwind. It needs the pre-market copy of the scan; regular hours never saw it. |
| Day two | The follow-through after a first squeeze day | Yesterday’s high is now the shorts’ line | GLSI, up 36% on November 17, broke its high again on the 18th, and failed. |
| Early stage, over several days | Building a position before the break, on days to cover | Short interest rising month over month, and a catalyst due | Days-to-Cover Heavies with a Short % Change MoM column. The data is two to four weeks old, so this is a swing trade, not a day trade. |
| First pullback | The first higher low after the spike, rather than the spike | The trigger bar was too wide to size | LVWR’s 10:30 low at $0.383 and the run back to $0.60. The low float guide has a pullback-then-break card. |
| Fading the blow-off | Shorting the spike after it stalls | Volume climaxes and the price stops rising | LVWR fell 48% in two bars from its $0.738 high; SEAT fell 41% from its pre-market high to the day’s low. A short needs borrow, and an early fade is how shorts get squeezed. |
What separates them is timing. The pre-market squeeze and the early-stage trade come before the breakout; the pullback and the fade come after it. The breakout is the one with a defined price, a defined stop and a moment every trader watching the same level sees together.
Why do short squeezes fail?
Most never start, and most that start stop early. Of the 13 stocks on the two lists, two gave the card a trigger while they were on the list, and both failed. The failures come from the same few places:
- The buyers were never the shorts. Covering is a fraction of a squeeze’s volume (SEAT: under 1%). When the news buyers stop, the short sellers who are left do not have to buy, and the price falls back toward where they sold.
- The company sells stock into the run. A heavily shorted company is often one that needs money. DataMeds (MEDS) filed 424B5 prospectus supplements on November 16 and 17, the two days before it was on the list. The card only skips a filing out today, so it allows MEDS on the 18th, and in the no-RVOL control MEDS was the best trade, +1.71R. A program on file is a risk to size for, not a verdict. The Dilution Watch template in the News Scanner lists S-1, S-3, S-4, Form D and Form 144 filings as they arrive; check EDGAR for a recent 424B too.
- A share-count change. SunPower (SPWR) announced a reverse split on November 16 and was on the list two days later. A split, a recapitalization (SEAT’s headline) or an offering changes the float and the shares outstanding, and short interest measured before it is measured against a different number.
- The number is old. A short percent from the end of October cannot tell you who covered in the first half of November. A stock with high short interest may already have squeezed, and the shorts gone.
- The list joins late. With the RVOL rule, a stock’s first appearance is often hours into its move, or its peak bar, as LVWR’s was.
- Thin stocks fake the break. GLSI’s trigger bar cleared the level on 43,541 shares against an average bar of 9,301. On a thin stock, twice the average is not much.
- A pause against you. A stop does not protect you through a halt, and squeezing stocks reach their bands quickly in both directions.
What the scan cannot see: borrow, halts, whether the short interest figure is current, an offering being marketed before it is filed, and how much of the volume is covering. It finds the heavily shorted stocks that are moving; the chart, the filings and the level decide whether one is worth trading.
The checklist before you take the trade
Before the trigger
- Is it on the Short Squeeze Watch list as the trigger bar closes?
- Is it between 9:35 am and 3:30 pm ET?
- Have you marked the level: the highest of yesterday's high, the pre-market high and today's high before this bar?
- Did a 5-minute bar close above it on twice the average volume of the session's earlier 5-minute bars?
- Is the share count your dollar risk divided by the distance to a stop under the trigger bar?
- With a stop more than 10% under the entry, are you at half risk?
- Is this your first or second attempt on this stock today?
- No S-1, S-3, F-1, F-3 or 424B offering filing out today?
- Is the spread under a tenth of the risk?
- Do you know where half comes off, where the rest trails, and that it is all out by 3:55 pm?
To have it running before the next open:
- Start the 7-day Pro trial. A card is required.
- Open Discover, choose Data Scanner, open Low Float & Squeeze, pick Short Squeeze Watch and click Use template. It lands in My Scans.
- In your copy, click + Add column and add Short Ratio, Days to Cover and Short Shares from Short Interest, and Percent Change set to Regular Hours.
- For the morning, make a second copy with Percent Change, Volume and Relative Volume set to the Pre-Market session.
- To see stocks sooner, make a third copy with Relative Volume switched off, and compare its list with the template’s.
- Before 9:30, mark each stock’s high from yesterday and its pre-market high. The card does the rest.
What a trial week holds at this page’s pace: the list held eight stocks and five on the two days tested, and the card triggered twice, so five sessions may bring a few triggers, or none.
After day 7 the trial renews on the plan chosen at sign-up, Starter at $89/month or Pro at $199/month, unless you cancel. Starter runs one scan at a time, saves one data scan and has no alerts (plans and limits).
Questions traders ask
What is a short squeeze in simple terms?
A heavily shorted stock rises, and short sellers buy shares back to limit their losses, which pushes it higher still. Most of the buying usually comes from other traders: SEC staff found covering was a small fraction of buy volume even in GameStop's 2021 squeeze.
How high does short interest need to be for a squeeze?
There is no threshold. Scanz's Short Squeeze Watch template uses 15% of the float; many traders call 20% high and 30% extreme. On November 19, 2026, NUAI had 37.69% of its float short and rose 5.6% from open to close, while LVWR had 22.60% and closed up 76.55%.
What is days to cover, and what is a good number?
Short interest divided by average daily volume. Scanz's Days-to-Cover Heavies template looks for 5 or more; on a squeeze day volume is far from normal, so the number overstates how long covering would take.
How often is short interest updated?
Twice a month, published seven business days after each mid-month and month-end settlement date: positions of November 13, 2026 come out November 24.
How do I find stocks about to short squeeze?
No scan can tell you a squeeze is about to happen. Short Squeeze Watch finds heavily shorted stocks already up 5% on twice their usual volume; Days-to-Cover Heavies leans on days to cover instead. The trade on this page waits for a close above the shorts' levels.
How long does a short squeeze last?
From minutes to weeks. LVWR's November 19, 2026 spike rose 54% inside one 5-minute bar and gave all of it back in the next two. GameStop's January 2021 run lasted weeks, carried by buyers rather than by covering.
Does the short squeeze strategy on this page work?
Too few trades to say: on November 18–19, 2026 the card took two trades on the template's list, both stopped, for −2R, and five for +1.08R on the earlier list without its RVOL rule.
What is the difference between a short squeeze and a gamma squeeze?
A short squeeze comes from short sellers buying stock back. A gamma squeeze comes from options dealers who sold calls buying stock to hedge as the price rises toward the strikes. Scanz has no options data, so this page covers short squeezes only.
Is the TTM Squeeze the same as a short squeeze?
No. The TTM Squeeze is a chart indicator for volatility compressing, Bollinger Bands inside Keltner Channels, and has nothing to do with short sellers. The shared word is the only link.
Is a short squeeze illegal?
A squeeze that happens because a stock rose and shorts covered is legal. Coordinating trades or spreading false information to move a price can be manipulation, whichever side you are on.
Can you short a stock after a squeeze?
It is a different trade, and a risky one: borrow is often scarce and expensive, and an early fade becomes the next squeeze. LVWR fell 48% in two 5-minute bars from its November 19, 2026 high, then ran back to within 4% of it that afternoon.
How much should I risk on a short squeeze trade?
The rules on this page set the stop under the trigger bar's low and the share count from it, then halve the risk when the stop is more than 10% away. LVWR's November 19, 2026 trigger bar made a 24% stop: at $50 of risk that was 336 shares.