What is relative volume, and how is it calculated?
Relative volume, or RVOL, is a stock’s volume divided by its normal volume. An RVOL of 1 means the stock is trading as much as usual; 2 means twice as much; 0.5 means half. Because it compares a stock with itself, it puts a $3 small cap that normally trades 400,000 shares a day and a megacap that trades 60 million on the same scale.
That is the whole formula, and it is also where most of the confusion starts, because “volume now” and “normal volume” can each be measured several ways. Two charting platforms, or two scans in the same platform, can show different RVOL for the same stock at the same minute and both be right. Four settings decide the number:
| Setting | What it decides | Common choices |
|---|---|---|
| The candle measured | How much of today’s volume is “now” | The whole day so far (daily candle), or one intraday candle: 1, 5, 15 minutes |
| The baseline | What “normal” means | One past candle (yesterday, or the previous bar), or an average of several |
| The lookback | How many candles go into the average | 10, 20, 30 or 50 are common; 20 is about a trading month |
| The hours | Which trades count | Regular hours only, or pre-market and after-hours as well |
There is a fifth question that splits platforms in two: is the comparison matched to the time of day? Volume is not spread evenly through a session. NYSE measured the first half hour of trading at 11.0% to 12.6% of the whole day’s volume across the US equity market, with a second bulge into the close. So there are two families of RVOL:
- Time-of-day RVOL compares volume so far with the average volume by the same clock time on past days. A stock having a normal morning reads about 1.0 at 10:00 am. The Trade Ideas guide defines RVOL this way, and StockCharts offers it as a separate indicator, RVOL-TOD.
- Cumulative RVOL compares volume so far with a whole average day. A normal stock starts the day near 0, reads roughly 0.11 to 0.13 at 10:00 am if it follows the market’s curve, and reaches 1.0 at the close. This is how Scanz’s relative volume works: it compares against an average over the period, not the same time of day on previous days (Scanner guide).
One stock, worked through both ways. Take a stock that trades 1,000,000 shares on an average regular-hours day, and suppose it has traded 600,000 shares by 10:00 am:
| Baseline | Calculation | RVOL at 10:00 am | |
|---|---|---|---|
| Cumulative, 20-day average (Scanz templates) | An average whole day: 1,000,000 | 600,000 ÷ 1,000,000 | 0.6 |
| Time-of-day, 20-day average | An average first half hour, about 12% of the day: 120,000 | 600,000 ÷ 120,000 | 5.0 |
| Previous candle on a Daily interval (the filter’s default Offset) | Yesterday’s whole day, say 1,500,000 | 600,000 ÷ 1,500,000 | 0.4 |
Same stock, same minute, three numbers. By the close, if it trades 2,400,000 shares in all, the cumulative reading is 2.4 and the time-of-day reading for the full session is also 2.4: the two families agree at 4:00 pm and disagree most in the first hour, which is exactly when day traders read them.
Neither is wrong, but a threshold does not travel between them. A stock that reads 3 on a cumulative RVOL at 10:00 am has already traded three average days of shares in 30 minutes, which on the NYSE curve is about 24 to 27 times its normal first-half-hour pace. On a time-of-day tool the same stock would read somewhere near 25. When someone says “I want RVOL above 2”, the first question is: measured how, and at what time?
What the Scanz templates use
Scanz’s templates label an RVOL rule by its average, for example “RVOL (20-day avg) ≥ 3” in RVOL Leaders. In that scan’s stored definition the rule is the Relative Volume filter set to a Daily data interval, Regular Hours session, extended hours off, and an Offset of “Avg. of 20 candles”. In words: today’s regular-hours volume so far, divided by the average regular-hours volume of 20 daily candles. It reads nothing before 9:30 am ET, it rises all day for every stock, and a stock having an exactly average day finishes at 1.0.
When you add the Relative Volume filter to a scan yourself, it starts from a different default: an Offset of Previous candle, which compares the current candle with just the one before it (filter reference). On a Daily interval that is today against yesterday, which is handy for spotting a jump but not a measure of typical volume. Set the Offset to Avg. of N candles to get a true relative reading, and choose the Data Interval and Session to match what you are asking. The same three settings exist for Relative Dollar Volume and Relative Trades.
What a “good” RVOL is
There is no single number, because the right threshold depends on the settings above and on what you want the filter to do. The Scanz templates are a useful map of how the number gets used, since each one sets RVOL for its own job. All of these are on the same 20-day-average setting unless noted:
| RVOL rule | Templates that use it | What the rule is doing |
|---|---|---|
| ≥ 1.5 | VWAP Reclaim, Red to Green, 20-Day High Break, 52-Week High Break, EMA 9/20 Cross, VWAP Cross Up | Confirms that a price event happened on real participation, without demanding a frenzy |
| ≥ 2 | High % Gainers, Gap & Go, Moving on News NOW, HOD Break - Momentum, Short Squeeze Watch | Keeps the list to stocks that are clearly in play today |
| ≥ 3 | RVOL Leaders, Capitulation Flush, Days-to-Cover Heavies | Volume is the reason the stock is on the list |
| ≥ 5 | Bull Flag Breakout; RVOL Spike (fires on the cross); Small-Cap Momentum (on a 50-day average) | Only the day’s real outliers |
A rough rule that holds across platforms: below 1 the stock is quieter than usual, and breakouts in quiet stocks fail more often because there is no one new to buy them; 2 to 3 is a stock in play; 5 and above is an event, usually news, an offering, an index change or a squeeze, and you should find out which before you trade it.
Why does relative volume matter to a day trader?
Volume is the number of people with a reason to trade a stock today. A stock trading three times its usual volume has new buyers and sellers in it who were not there yesterday, and they are the ones who carry a price through a level. Three things follow from that, and they are why RVOL sits in most momentum traders’ stock filters, ahead of any chart:
- Moves have fuel. A breakout needs buyers who were not already long. When volume is normal, the people who would buy the break have mostly bought already, and the level holds.
- Fills are better. More shares changing hands means you can get in and out near the price on the screen, and stops get filled near where you placed them.
- Someone knows something. Unusual volume usually has a cause: a headline, a filing, an upgrade, a block buyer. A 2001 study in the Journal of Finance found that stocks with unusually high volume over a day or a week tended to rise over the following month, and its authors put that down to the attention the volume brings. That is a multi-week effect, not a day-trade signal, but it is the same mechanism: volume brings eyes, and eyes bring buyers.
What relative volume does not tell you is direction. A stock collapsing on an offering has high RVOL too. That is why every scan on this page pairs the RVOL rule with a price rule, and why the trade below waits for price to confirm.
How do you scan for high relative volume stocks?
You need two things from a scanner: a list of the stocks trading far above their normal volume right now, and a ping the moment a new one joins. The Scanz real-time stock scanner has a template for each. These are the rules exactly as the templates store them.
The scan · Data Scanner · Regular hours, 9:30 am–4:00 pm ET
RVOL Leaders
| Rule | Setting | Why it's there |
|---|---|---|
| RVOL (20-day avg) | ≥ 3 | Today's regular-hours volume so far is at least three times an average day's. Because the comparison is with a whole day, a stock passing it in the first hour is trading many times its normal pace. |
| % Change (RH vs prev close) | ≥ 2% | Keeps the list to stocks that are up today, so the volume is buying interest rather than a stock being sold down. |
| Volume (RH) | ≥ 250,000 shares | Requires real shares today, not just a big ratio. A stock that normally trades 2,000 shares a day reads RVOL 10 on 20,000 shares; this rule keeps it off until a quarter of a million have traded. |
| Trades (RH) | ≥ 100 | Volume spread over at least 100 trades, so the ratio is not one or two large prints. |
| Last Price | ≥ $0.30 | A low floor: the list keeps sub-dollar stocks. Raise it if you do not trade them. |
It counts regular hours only, so it lists nothing before 9:30 am ET. For the pre-market, the Pre-Market Gappers template filters on pre-market gap and volume instead.
The trial is 7 days of Pro, free, card required. It renews on the plan chosen at sign-up, Starter at $89/month or Pro at $199/month, unless you cancel in the app. Starter keeps one data scan and one signal scan, enough for both scans on this page.
Tightening and loosening it. RVOL Leaders is wide on purpose: no float, no market cap and a 30-cent price floor. Three changes cover most styles:
- Small-cap momentum: raise % Change to 10%, add a price range of $1 to $20, and keep RVOL at 3 or raise it to 5. It is close to the stock-selection filters small-cap momentum traders commonly publish: a double-digit move, relative volume of 5 or more, and a news catalyst you check yourself.
- Large caps: lower RVOL to 1.5 or 2, lower % Change to 1%, add a $20 price floor and a volume floor in the millions. Large caps rarely trade three days of volume in a morning, and when they do, earnings or a deal is often behind it.
- When last week’s news skews the average: a stock that had one enormous day in the last 20 sessions carries it in its average for four weeks, which makes today’s RVOL look smaller than it is. Switch the Offset to a longer average (the Small-Cap Momentum template uses 50 days) or check the daily chart.
Reading the number through the day. Because this RVOL is cumulative, the same threshold gets easier to meet as the day goes on. A stock that makes the list at 9:50 am is far more unusual than one that makes it at 2:30 pm, though both have had a big day. In the scan builder the rule reads Relative Volume RH[/20]: RH for the session, /20 for the average of 20 candles. The grid shows the same reading in its RVOL RH [/20] column, next to the last 15 minutes of % change, volume and trades, a Float column and News Count over 4 hours. By default it sorts by the 15-minute % change, so the stocks moving right now sit on top.
The scan · Signal Scanner · Regular hours
RVOL Spike
| Rule | Setting | Why it's there |
|---|---|---|
| Fires when | Relative Volume crosses 5× the 20-day avg (RH) | The same daily, regular-hours, 20-day-average reading as RVOL Leaders, but as an event: a row in the feed when a stock crosses 5. A stock can fire more than once in a session. |
| Last Price | ≥ $1 | Leaves out sub-dollar stocks, where share volume is cheap and ratios run high. |
| Volume (RH) | ≥ 100,000 shares | A floor on real shares, so a stock that normally trades a few thousand shares cannot fire on a handful of trades. |
The signal's universe is wider than the scan's: besides common stock it includes ETFs, ADRs, preferreds and warrants, and OTC stocks. Its direction is Either, so it fires on stocks falling on volume as well as rising: check the % change before you read a fire as bullish.
The two work as a pair. RVOL Spike tells you the moment a stock arrives; RVOL Leaders is the standing list you trade from, with the % change and trade-count rules the signal does not have. Once you copy the signal with Use template, give it a sound so a fire reaches you while you are watching a chart (Signals guide).
What do traders actually do with high RVOL stocks?
Relative volume picks the stock; a price setup picks the moment. The page Google ranks first for this search says it in as many words, “RVOL is a filter, not an entry” (Trade Ideas), and the long entries it and other trading educators pair with RVOL come down to two: the breakout of a level on a high-volume bar, and the pullback that holds and turns up as volume returns. Nobody publishes a count of which one traders take more. This page teaches the first pullback as its main play: let the opening push happen, wait for the first rest on lighter volume, and buy when the stock breaks out of it with volume coming back. The breakout versions are on their own pages and in the variations below.
It gets the main card for three reasons. It needs the volume to be there before the entry rather than hoping it arrives. The pullback gives a stop that means something: if the low of the rest breaks, the buyers who were supposed to defend it did not. And it is the trade the volume tells you most about, because you can see volume dry up on the dip and return on the break. StockCharts’ guide to the indicator puts the logic in one line: a pullback on low relative volume is likely to be temporary (StockCharts ChartSchool).
What are the entry, stop and exit rules?
The setup on one card
- The list
- On RVOL Leaders when the trigger bar closes: RVOL ≥ 3 against the 20-day average, up 2% or more, 250,000 shares and 100 trades in regular hours
- Time window
- Triggers from 9:45 am to 3:30 pm ET. The first 15 minutes are the push; there is no pullback to trade yet.
- Setup
- A push of at least three 5-minute bars, then a pullback of two to six bars that holds above VWAP, gives back no more than half the push, and trades less volume per bar than the push did
- Trigger
- A 5-minute bar that closes above the pullback's high on at least twice the pullback bars' average volume
- Entry
- At the close of the trigger bar
- Stop
- Below the pullback low
- First target
- 1R: the distance from entry to stop, added above the entry. Take half off there.
- The rest
- Trail under each higher 5-minute low; out on a 5-minute close below VWAP, and all out by 3:55 pm
- Skip it when
- The pullback trades heavier than the push; price closes below VWAP during the pullback; an offering filing is out today; the spread is more than a tenth of the risk; it is your third attempt on the stock today
Why the pullback has to be quieter. On a stock in play, the push is buyers arriving. The pullback tells you whether sellers arrived too. Bars a third or half the size of the push bars mean the dip is traders taking profits and new buyers waiting, and the stock is holding. Pullback bars as heavy as the push bars mean someone is selling size into the move, which is how many offering days and failed runners look on a chart.
Why twice the pullback’s volume on the trigger. The template’s RVOL tells you the day is unusual; it does not tell you whether this particular bar is. The trigger asks the same question again on the 5-minute chart: is volume coming back now? Compare the trigger bar with the pullback bars before it, not with the push. You do not know a bar’s volume until it closes, which is why the entry waits for the close rather than the first trade through the high.
Why VWAP. VWAP is the average price everyone paid today. A pullback that holds above it leaves most of today’s buyers in profit, so they have no reason to sell. One that breaks below it puts them underwater, and the stock usually needs a reclaim before it is a long again (VWAP guide).
Sizing from the stop. Decide what you will lose if the stop is hit, then divide by the distance from entry to stop. A $0.20 stop and $100 of risk is 500 shares; a $0.50 stop is 200. Results are counted in R, multiples of that risk, so they compare from one stock to the next.
A real session: RVOL Leaders and MSS on November 20, 2026
This is the template as it ran on a Friday, opened from Discover with no changes, then the list’s most active stock taken through the rules card bar by bar. It shows what the number looks like in practice, and why reading it takes more than a threshold.
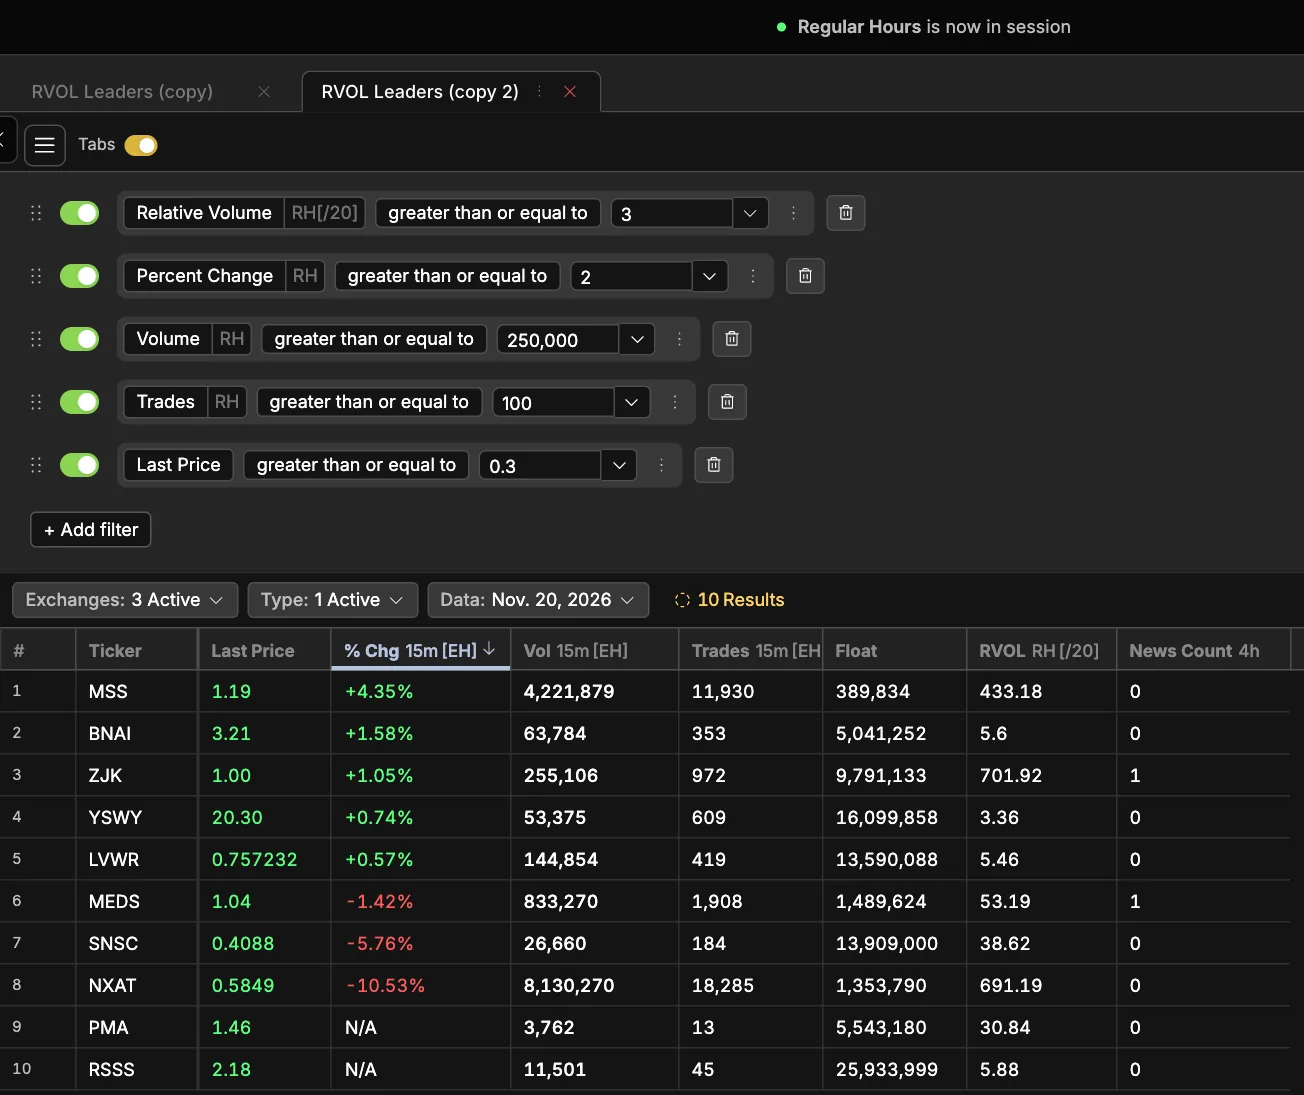
Ten stocks, two kinds of number. Four readings are what most traders picture when they say “high relative volume”: YSWY at 3.36, BNAI at 5.6, LVWR at 5.46 and RSSS at 5.88. Each has traded three to six average days of volume by noon. The other six are in a different world: MEDS at 53.19, PMA at 30.84, SNSC at 38.62, and three in the hundreds, MSS at 433.18, NXAT at 691.19 and ZJK at 701.92. A reading of 700 does not mean a stock is 100 times more interesting than one at 7. It means the stock normally trades almost nothing, so any real day divides by a tiny average. All six were priced under $1.50.
What the other columns add. MSS traded 4,221,879 shares in the last 15 minutes alone, on a float of 389,834 shares: the whole float changed hands nearly eleven times in a quarter of an hour. That is a stock in play by any measure, and its RVOL is the least informative number in its row. PMA shows the opposite: an RVOL of 30.84 but 3,762 shares and 13 trades in the last 15 minutes. Its reading was earned earlier in the day, and nothing is happening now. NXAT is on the list with 8,130,270 shares in 15 minutes while falling 10.53% over the same 15 minutes. It passes because it is still up at least 2% on the day; the volume right now is selling.
What the card would do with this list. The pullback on this page needs a stock that is active now and holding above VWAP. By 15-minute volume, four names were active at noon: MSS, NXAT, MEDS and ZJK, and NXAT was falling. The grid has no VWAP column, so the last check is the chart; a Last Price ≥ VWAP filter added to your copy does it for you. YSWY was the only stock above $5, so a trader with a $5 floor had one name, and it was quiet. On a slow Friday that is a normal result: RVOL Leaders gives you a short list, and the rules decide whether any of it is a trade.
MSS through the card, bar by bar
MSS was the list’s most active name all afternoon, so it is the one to put through the rules. Its RVOL climbed at every pass: 433.18 at 11:58 am, 919.25 at 1:30 pm, 1,159.81 after the close. Its price did not follow.
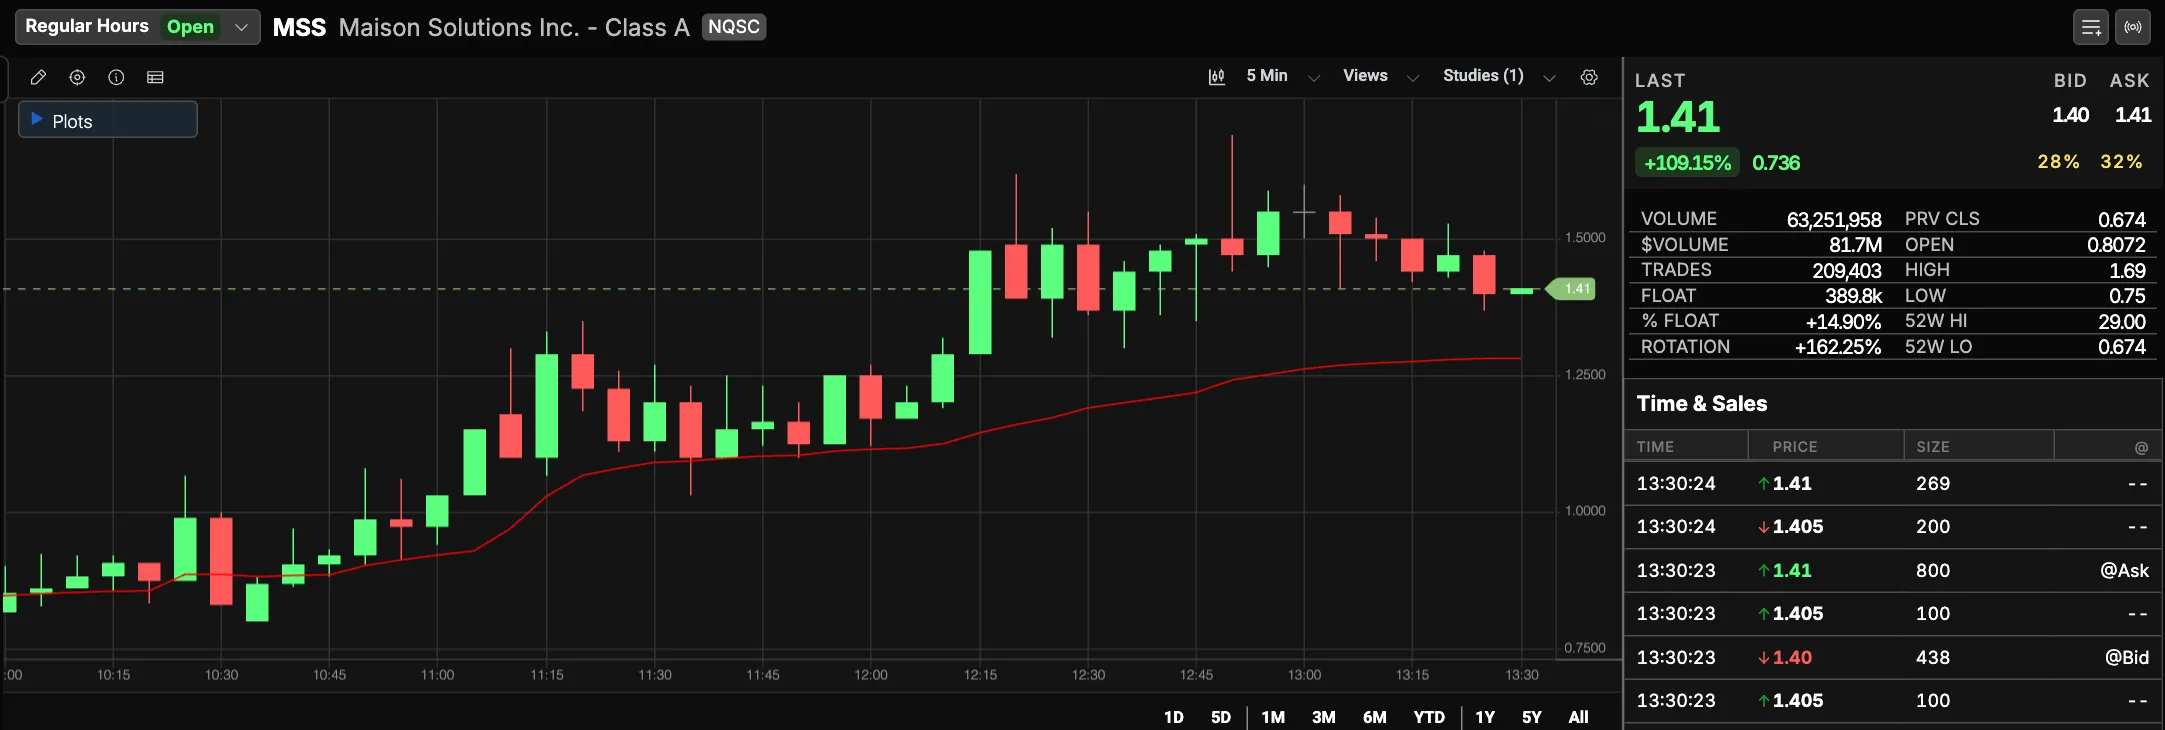
The table puts the card’s tests on those bars. Volume and VWAP come from the public 5-minute bars for the session (Yahoo Finance), because the montage chart above has no volume pane; highs and lows can differ by a cent or two between feeds, which changes none of the answers.
| Time (ET) | What happened | Card test | Result |
|---|---|---|---|
| 11:05–11:20 | First push, $1.02 to $1.35, average 2.11 million shares a bar | A push of at least three bars | Pass |
| 11:25–11:50 | Pullback to $1.03, average 1.83 million a bar; the 11:35 bar closed at VWAP, $1.095 | Lighter than the push; gives back no more than half; holds VWAP | Lighter, but it gave back nearly all of the push and touched VWAP: skip |
| 12:10–12:20 | Second push, from the 12:05 low of $1.17 to $1.62, average 2.09 million a bar | A push of at least three bars | Pass |
| 12:25–12:45 | Pullback to $1.30, average 2.17 million a bar, above VWAP throughout | Lighter than the push; no more than half back | Heavier than the push and gave back about 70%: skip |
| 12:50 | The day’s high, $1.69, on 3.93 million shares, the heaviest bar of the afternoon; closed $1.47 | Trigger: a close above the pullback high of $1.55 | No: it closed back inside |
| 12:55 | Closed $1.5501, a hundredth of a cent over the pullback high, on 1.95 million shares | Trigger volume at least twice the pullback’s 2.17 million | No |
| 1:35 pm | Closed $1.27, the first close under VWAP ($1.285) since the morning | Stop under the pullback low, $1.29 | A trader who bought 12:55 anyway is out here |
| 3:05 pm | After chopping around VWAP, closed under it ($1.25 against $1.29) and stayed under to the close | ||
| 4:00 pm | Closed at $1.10, up 63% on the day and 35% under the high, on 80.5 million shares |
What the card did: nothing, and that was the trade. Both pullbacks failed a test before any trigger: the first gave back almost the whole push, and the second traded heavier than the push, which is what selling into a move looks like. A trader who bought the 12:55 close anyway at $1.55, with a stop under the pullback low at $1.29, was stopped at 1:35 pm for −1R; the stock never got closer than 20 cents to the 1R target at $1.81. Meanwhile RVOL went from 919 to 1,160. On a stock that normally trades a few tens of thousands of shares, every share of the fade counted toward the number.
ZJK, the other high reading. ZJK ran from $1.00 at 9:35 am to $1.64 in the 9:50 bar, which traded about 2.2 million shares, closed back under VWAP by 9:55, and stayed under it for the rest of the session while its RVOL rose from 701.92 to 830.16. It never offered a pullback above VWAP, so the card never had a long to consider. It closed at $0.90, up 13%.
The signal, at noon and after. RVOL Spike was opened from Discover at 11:53:36 am ET the same day. Every fire reads the same way, for example “Regular Hours volume of 27,829,105 shares is 5 times the avg 20 days volume”. These came in during its first 34 seconds:
| Time (ET) | Ticker | Exchange | Regular-hours volume in the fire |
|---|---|---|---|
| 11:53:36 | MSS | NASDAQ | 27,829,105 |
| 11:53:36 | MEDS | NASDAQ | 35,018,139 |
| 11:53:37 | ABVX | NASDAQ | 10,694,473 |
| 11:53:37 | ZJK | NASDAQ | 7,127,472 |
| 11:53:38 | BILL | NYSE | 12,260,595 |
| 11:53:38 | NIXX | NASDAQ | 147,225 |
| 11:53:42 | BNAI | NASDAQ | 661,461 |
| 11:53:57 | (not captured) | OTC | 985,739 |
| 11:54:10 | (not captured) | NYSE | 372,655 |
Three things to take from it. First, a signal you switch on at noon fires at once for every stock already above 5×, so the first burst is a catch-up list, not seven stocks crossing in the same second. MSS’s fire carried 27,829,105 shares, more than 400 times its average, so it had crossed 5× hours earlier. The fires after the burst are the real crossings. Second, two of the seven are exactly why RVOL needs a price rule. ABVX, an $80 stock, fell from about $79 to $63.30 inside one 5-minute bar at 9:50 am, and much of the volume that put it in the feed came in that fall and the bounce after it. BILL, a $64 stock at the previous close, traded more than 12 million shares by noon and spent the whole morning inside a 30-cent range around $61.50 (5-minute bars from Yahoo Finance’s public chart data). Five times its normal volume, and no move to trade in either direction. Neither is on RVOL Leaders: the +2% rule keeps them off.
Third, the fires after the burst are mostly not the list. From 12:01 to 1:59 pm the feed logged 75 fires on 46 symbols, priced from $1.00 to $95.81, four of them OTC. Only five of the 46 (ZJK, LVWR, MGN, CMCT and EZGO) showed up on any RVOL Leaders pass that day; the rest crossed 5× without the 2% move, the trade count or the price the scan asks for. And a stock can fire more than once: LVWR fired 20 times and ZJK 11, every one at $1.00 to $1.02, right on the signal’s $1 price floor, which suggests each dip under the floor and back counted as a new crossing. Use the signal as the ping and the list as the filter.
The lesson to take from the session: sort or filter by price, dollar volume or float before you read RVOL, read the 15-minute volume to see which names are active now, and treat readings in the hundreds as “this stock is usually dead”, not as a stronger signal. A cumulative RVOL only goes up during the day, so it can never tell you a move is over; the price and the pullback’s volume do.
What are the other ways to trade relative volume?
Each of these uses the same RVOL list with a different trigger. The settings change; the principle that volume has to be present before you act does not.
The spike itself (the earliest entry). When RVOL Spike fires on a stock that has not yet moved far, some traders enter on the first 5-minute close above the opening range high instead of waiting for a pullback. The stop goes under the opening range low. It gets you in before the crowd that waits for the gainers list, and it gives up the confirmation of a quiet pullback. The opening range breakout guide has the rules.
The break of the high of day. Later in the session, a high-RVOL stock that rests under its morning high for 15 minutes or more and then breaks it on a volume bar is the high of day break. Its template, HOD Break - Momentum, uses RVOL ≥ 2 on the same 20-day setting.
The fade of climactic volume. After a long run, a 5-minute bar with the day’s heaviest volume and a long upper wick, followed by a close below that bar’s low, often marks the high. StockCharts notes that RVOL spikes at an extreme can mean a reversal rather than continuation. This is a short, it is harder, and Scanz cannot show you whether shares are available to borrow, so check with your broker first.
Before the open. RVOL Leaders is blank until 9:30 am. Pre-market traders filter gappers on pre-market volume instead; the pre-market scanning guide has the scan.
Large caps. A $200 stock almost never reads 3 on a cumulative 20-day RVOL before noon. For large caps, 1.5 to 2 is a real event; lower the RVOL and % Change rules and raise the price and volume floors, as in the tightening notes above.
Swing trades. Run the scan with Data For: Prev. Day after the close to list yesterday’s high-volume stocks, and look for the ones that closed near their highs. The trade is the next day’s or the next week’s continuation, not the next five minutes.
When does trading on relative volume fail?
- The volume is selling. High RVOL on a stock that cannot hold its gains is supply, not demand. Offerings, lock-up expiries and holders exiting after a run all produce heavy volume. The +2% rule keeps the worst of these off the list, and the quieter-pullback rule catches most of the rest.
- One print made the ratio. A single block trade can make a thin stock’s RVOL jump. The 100-trade and 250,000-share floors guard against it; on a fresh fire, check Time & Sales for whether the volume came from many trades.
- A news day in the average. A stock that traded 30 million shares on news two weeks ago has that day in its 20-day average until it ages out, so today’s RVOL reads low. The reverse, a stock that has been unusually quiet, reads high on modest volume.
- The time of day was ignored. A cumulative RVOL of 1.5 at 3:45 pm is an ordinary day with a busy close. A time-of-day RVOL of 3 at 9:31 am is three normal opening minutes. Read every number with the clock.
- Index and options events. Index rebalances, quarterly options expiration and the closing auction create heavy volume with no story behind it. Volume at 3:50 pm on a rebalance day is not a reason to buy.
- The volume is real but the chart is not. High RVOL means people are trading the stock, not that the trade is good. A stock already 40% above VWAP with RVOL 12 is a stock where the easy part is over.
What Scanz cannot see for this setup: it has no time-of-day matched RVOL, so its readings need the clock; it does not show halts; and it does not know why the volume is there. Click the row and read the news before you trade the number.
The checklist before you take the trade
Before the trigger
- Is the stock on RVOL Leaders as the trigger bar closes (RVOL ≥ 3, up 2% or more, 250,000 shares, 100 trades)?
- Is it between 9:45 am and 3:30 pm ET?
- Do you know why the volume is there: a headline, a filing, an upgrade?
- Was there a push of at least three 5-minute bars before this pullback?
- Did the pullback last two to six bars, give back no more than half the push, and hold above VWAP?
- Were the pullback bars lighter than the push bars?
- Did the trigger bar close above the pullback high on at least twice the pullback's average volume?
- Is the share count your dollar risk divided by the distance to a stop under the pullback low?
- Is the spread under a tenth of the risk?
- No offering filing out today, and is this your first or second attempt on the stock?
- Do you know where half comes off, where the rest trails, and that it is all out by 3:55 pm?
Questions traders ask
What is a good relative volume for day trading?
It depends on how RVOL is measured. On a cumulative 20-day average like Scanz's templates, 2 marks a stock in play and 3 or more a stock where volume is the story; a reading of 3 before 10 am is extreme. On a time-of-day RVOL, many traders use 2 as the floor and 5 for momentum small caps.
How is relative volume calculated?
Current volume divided by a baseline volume. The baseline is usually an average over 10 to 50 past periods, and it is either a whole average day or the average up to the same time of day. Scanz's templates divide today's regular-hours volume so far by the average regular-hours volume of the last 20 daily candles.
What does a relative volume of 2 mean?
The stock has traded twice its baseline volume. On a cumulative daily RVOL, it has already done two average days' volume. On a time-of-day RVOL, it is trading twice its normal amount for this point in the session.
Is high relative volume bullish?
Not by itself. It means more traders are in the stock than usual, buying and selling. Stocks fall on high relative volume too, on offerings and bad news. Pair it with a price rule, such as RVOL Leaders' requirement that the stock is up 2% or more.
What is the difference between relative volume and average volume?
Average volume is the number of shares a stock usually trades in a day. Relative volume divides today's volume by that average, so it shows whether today is unusual for this stock, whatever its size.
Why does my RVOL differ between platforms?
Each platform picks its own candle, baseline, lookback and hours, and some match the time of day while others do not. A stock can read 3 on one and 25 on another at the same minute. Check the settings before comparing thresholds.
Can I use relative volume in the pre-market?
Yes, with a scan built on pre-market volume. RVOL Leaders and RVOL Spike count regular hours only, so they list nothing before 9:30 am ET. For the pre-market, scan on pre-market volume instead, as the Pre-Market Gappers template does.