Tried and true watchlists are key to finding profitable trading opportunities.
With a watchlist, you narrow the list of stocks you need to look through from thousands to a few hundred or less. Watchlists can be broad to help you generate new trade ideas, or they can be more narrowly focused to help you spot potential trade setups before they disappear. Depending on your trading style, you may just want one large watchlist that serves as a database of stocks you’re interested in, or several smaller lists that segment the market by trading setup, fundamentals, sector, or other factors.
The Pro Scanner in Scanz is an effective tool for building a wide variety of watchlists or adding stocks to your existing watchlists. Let’s take a look at 6 scans that you can run to start building more effective watchlists.
1. Small Cap “Value” Stocks
Many traders typically put volume, price, or market cap filters on their scans in order to limit results to only mid- and large-cap stocks. That’s a good strategy, but it misses out on a huge segment of companies that often move separately from the broader market – small caps.
This scan is ideal for building a watchlist centered around small-cap stocks that may be selling at a bargain price:
MARKET CAP is between 250,000,000 AND 1,000,000,000
AND
Relative Strength Index (Daily, 14) is less than or equal to VALUE 30
AND
Gross Profit is greater than or equal to VALUE 1,000,000
The first rule of this scan limits results only to small-cap stocks, which we’ve defined as companies with a market capitalization of between $250 million and $1 billion. You can adjust this range if you want to capture micro-caps or mid-caps as well.
The RSI parameter scans for stocks that are potentially oversold. Of course, being “oversold” does not mean that a stock is a bargain. You could continue to add more fundamental filters for revenue, profit, and cash to find companies that are performing well. This should be combined with additional fundamental research to determine which companies are actually “value” plays.

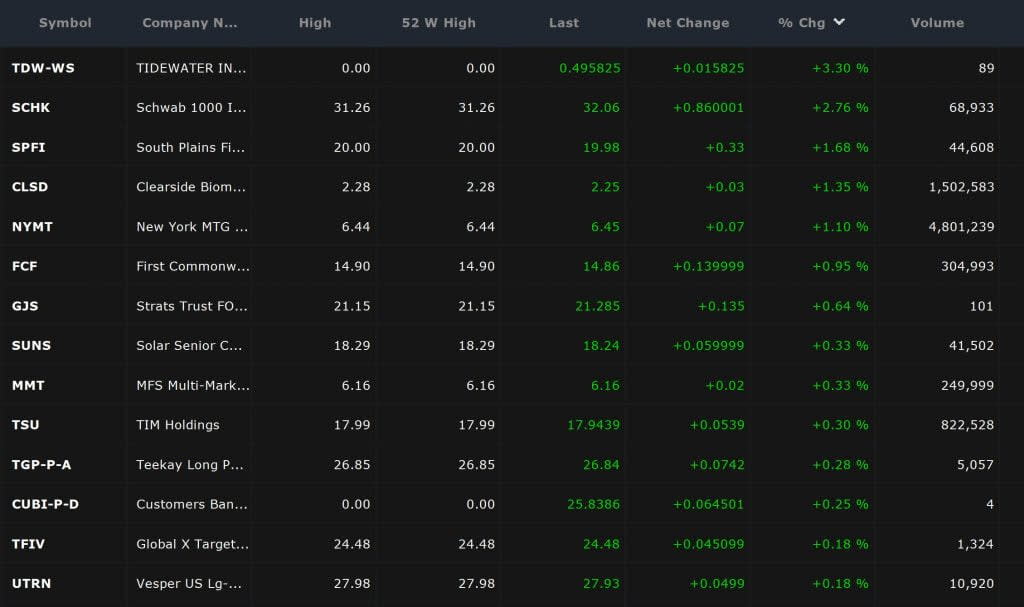
2. Stocks Hitting New Highs
It’s always a smart idea to keep an eye on stocks that are hitting new highs. These stocks may be responding to positive news, or they may just be on a bullish streak that’s propelling them into uncharted territory. Either way, there may be opportunities to jump on the trend or play a reversal as the stock is overbought.
To search for stocks hitting new highs, use this scan:
DAY HIGH is equal to ANALYTIC 52 WEEK HIGH
You’ll probably want to add in a market cap or volume filter to this scan to hone in on the market sector that you want to trade.

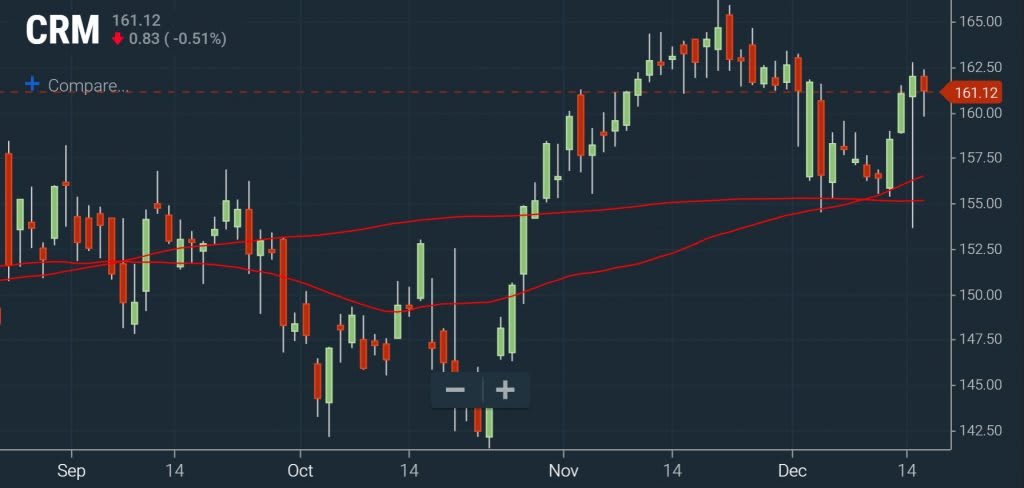
3. Golden Cross
A Golden Cross occurs when a stock’s 50-day moving average crosses above it’s 200-day moving average. This is generally considered to be a very bullish signal and it often signals the beginning or continuation of a trend.
You can search for a Golden Cross using these scanner rules:
Simple Moving Average (Daily, 50) is greater than or equal to ANALYTIC Simple Moving Average (Daily, 200) by 2% and less
AND
PREV DAY CLOSE is greater than ANALYTIC CLOSE 5 DAYS AGO
It’s helpful to include the 2% and less parameter here so that you’re only looking at Golden Cross patterns that occurred very recently. Similarly, the second rule helps to eliminate stocks for which the 50-day moving average is decreasing rather than increasing.

4. Bullish MACD-Stochastic Double Cross
This is another momentum scan that can help you keep an eye on potential bullish swings. This scan relies on two indicators – moving average convergence-divergence and stochastics, which measure very different properties – aligning in signaling a coming price increase.
Moving Average Convergence-Divergence is greater than or equal to ANALYTIC MACD Signal
AND
MACD Histogram is between 0 AND 0.2
AND
Stochastic SlowK is greater than or equal to ANALYTIC Stochastic SlowD by 0.5 $ AND less
AND
Stochastic SlowK is less than VALUE 80
The first two rules look for a bullish MACD cross that occurred within the past several days, while the second pair of rules does the same for a stochastics cross.


This scan is a nice one to run at the start of each trading day. You can use it to create a daily watchlist for use with the Breakouts module, which allows you to then quickly spot when potential setups identified by this scan are triggering on volume or a moving average cross.

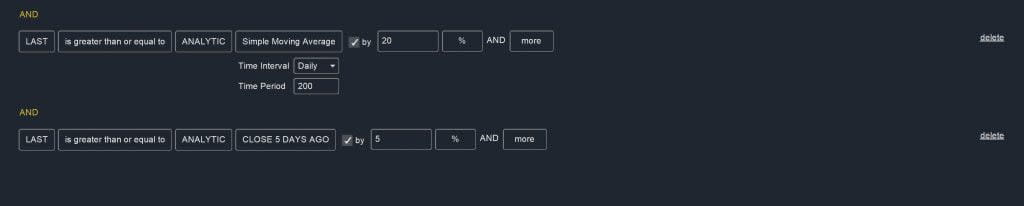
5. High Momentum Stocks
Many traders will also want to keep an eye on stocks that are exhibiting prolonged momentum – on the scale of several months. In this case, you need to look for stocks that have been performing well for a long time, and that have continued to perform well recently.
You can look across these two timelines using this scan:
LAST is greater than or equal to ANALYTIC Simple Moving Average (Daily, 200) by 20% AND More
AND
LAST is greater than or equal to ANALYTIC CLOSE 5 DAYS AGO by 5% AND More
You can also modify the duration of the moving average, or add in a second moving average threshold, to look for stocks that have performed well over a longer time period or more consistently. This scan can be combined with some of the other momentum scans to create a narrower watchlist of stocks that are prime for intra-week entry.

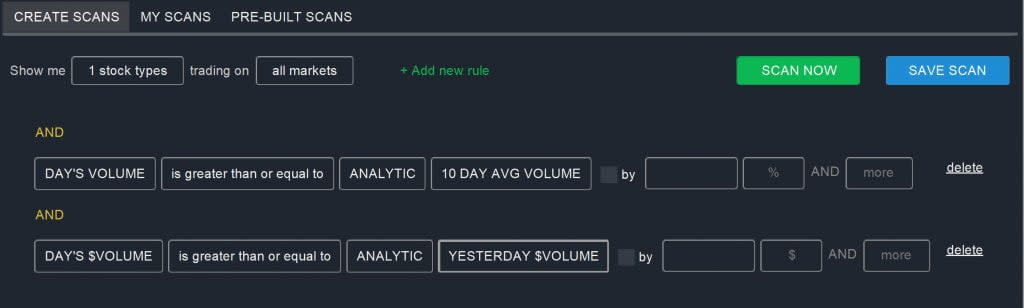
6. Abnormal Trading Volume
Unusually high trading volume is a sign of enhanced interest in a stock, which may be due to news, institutional trading, or a potential setup for a move higher or lower. As a result, it’s a good idea to have a watchlist that keeps an eye on stocks with lots of trading activity.
You can scan for abnormally high trading volume with the Pro Scanner using two rules:
DAY’S VOLUME is greater than or equal to ANALYTIC 10 DAY AVG VOLUME
AND
DAY’S $VOLUME is greater than or equal to ANALYTIC YESTERDAY’S $VOLUME
The $Volume parameter helps to normalize for short-term changes in stock prices, but isn’t strictly necessary for a broad scan. You may also want to use the By parameter for either of these rules to create a cutoff for how high volume needs to be relative to the average in order to show up in your scan results.

Conclusion
Using the Pro Scanner to create watchlists is a good way to improve your trading. With preset watchlists, you can be certain that you’ll never miss a potentially profitable setup or run out of trading ideas. These 6 scan ideas can help you get started with building better watchlists. But, don’t be afraid to customize your scans and make them broader or narrower to suit your needs.
Related Reading:
Ready to start scanning? Try for free and choose the plan that fits your workflow.