Building high-quality scans that can help you quickly spot prime trading opportunities is essential to every strategy. With the Scanz Pro Scanner, you can easily develop new trading ideas or fine-tune a scan for existing trading strategy with just a few filters. In this guide, we’ll highly six all-purpose filters that can help you create more nuanced and actionable scans.
1. Moving Averages to Spot Price Trends
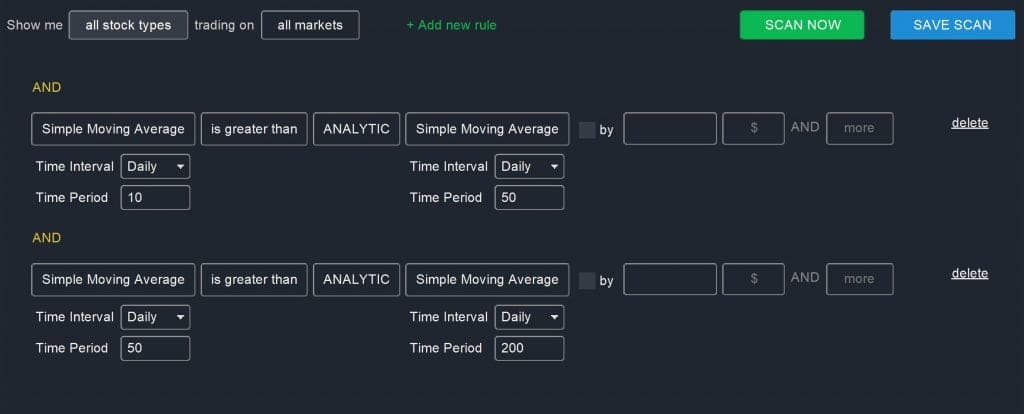
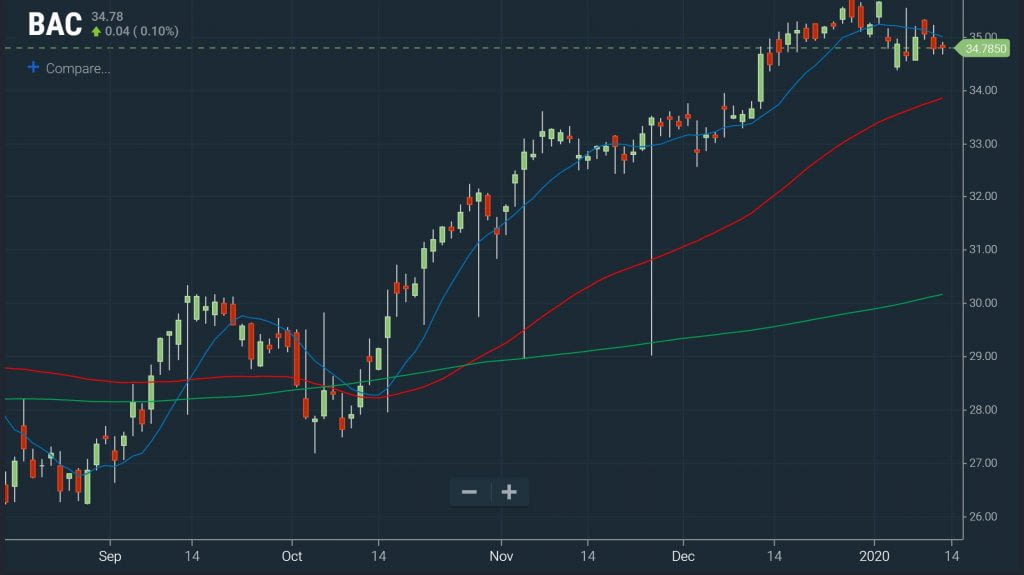
Moving averages are among the most helpful filters you can apply to any scan. By scanning for stocks that have a short-term moving average stacked above a long-term moving average, you can limit your results to stocks that are trending upward. As an example, the following scan looks for stocks that are broadly increasing in price over a 10 to 50-day timescale:
Simple Moving Average (Daily, 10) is greater than ANALYTIC Simple Moving Average (Daily, 50)
AND
Simple Moving Average (Daily, 50) is greater than ANALYTIC Simple Moving Average (Daily, 200)
This filter can be easily modified to look for stocks that are trending upward on an intraday timescale as well. To look for bearish stocks, simply reverse the order of the stacking so that the short-term moving average is less than the long-term moving average.
2. ADX to Identify Trending Stocks
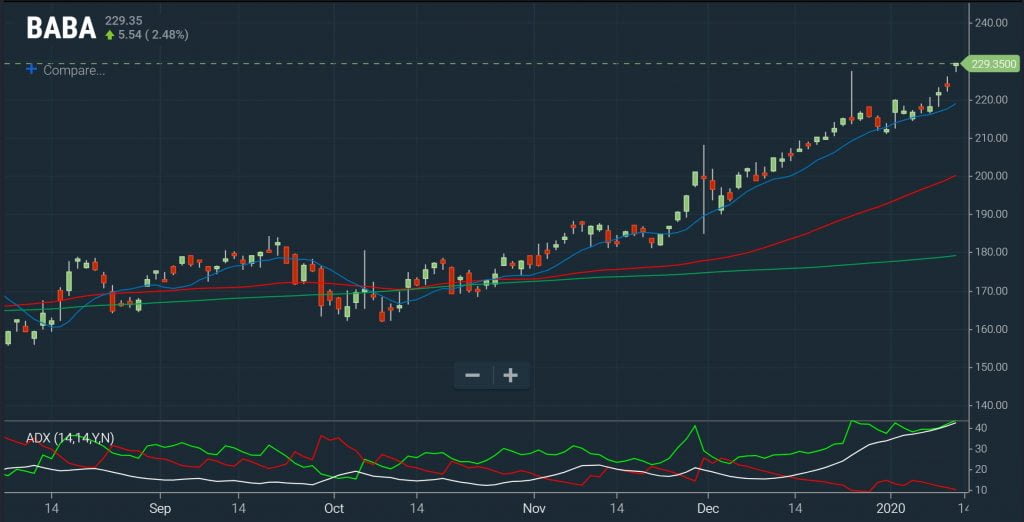
The Average Directional Index (ADX) is another powerful filter you can use to scan for trending stocks. This indicator offers a single number that can be used to evaluate the strength of a price trend. An ADX value greater than 25 indicates a trend, while a value greater than 50 indicates a very strong trend.
You can add an ADX filter into any scan with the following parameter:
Average Directional Index (Daily, 14) is greater than VALUE 25
ADX is particularly useful for swing traders, although it can also be used on an intraday timescale to identify sustained movements on the scale of a few hours. Note that ADX is agnostic to the direction of the trend. If you want to only scan for bullish trends, however, you can pair the ADX filter with a bullish stacked moving average scan.
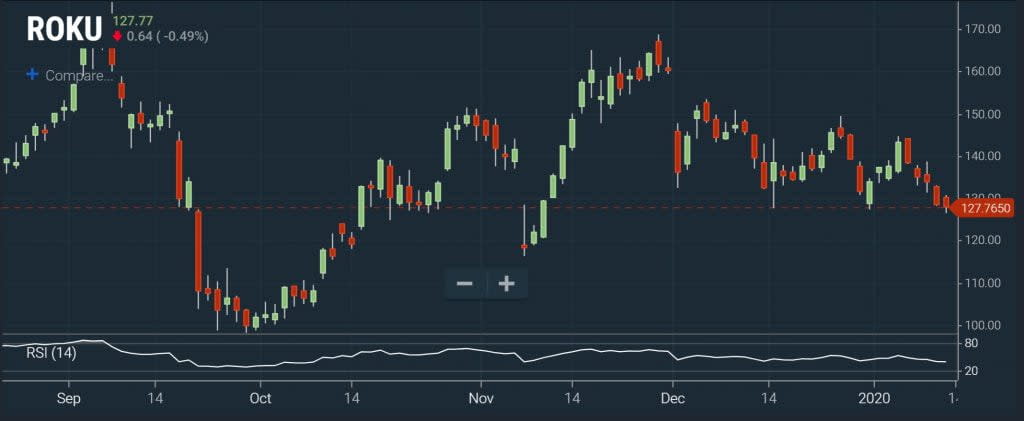
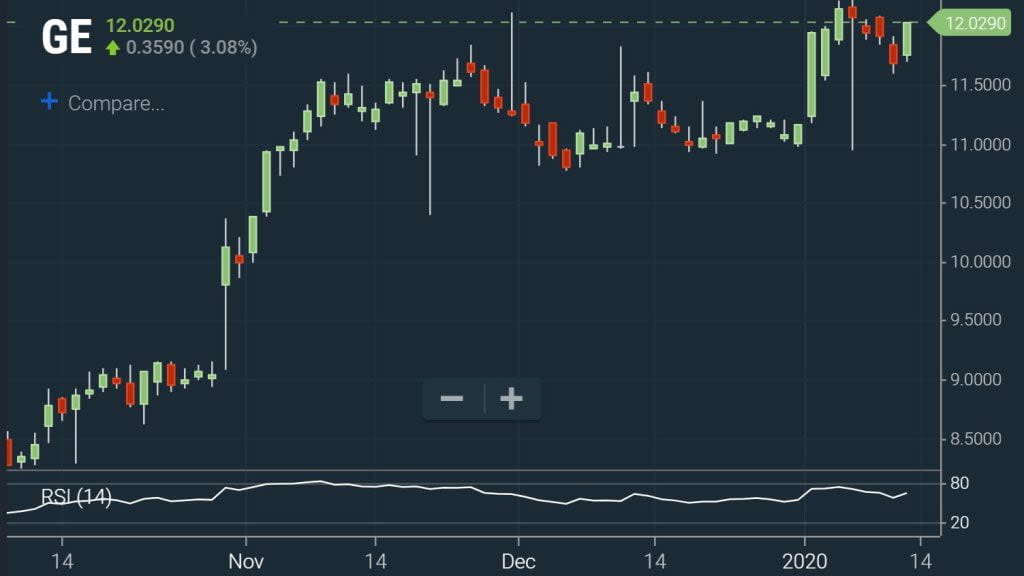
3. RSI to Find Overbought and Oversold Stocks
The Relative Strength Index (RSI) is a useful indicator that gives information about when a stock is overbought or oversold relative to its recent price history. If you’re looking for stocks that may offer a value or are nearing a price bottom, you can scan for equities with an RSI value below 30. Alternatively, an RSI value over 70 indicates that a stock is overbought and may be poised for a bearish reversal.
If your trading strategy doesn’t revolve around momentum or you’re looking for stocks that are trading choppily inside a channel, you may be more interested in avoiding stocks that are overbought or oversold. In that case, you can filter out any stocks with a high or low RSI value using this scan:
Relative Strength Index (Daily, 14) is between 30 AND 70
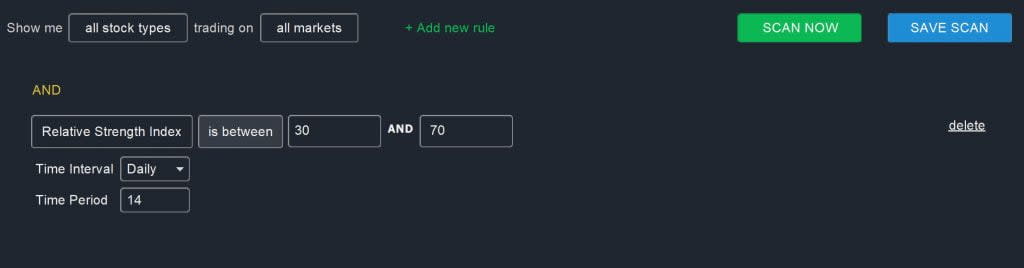
Note that some traders prefer to use RSI values of 20 and 80 to identify oversold and overbought stocks. In addition, RSI may be misleading during times when a stock is trending strongly up or down, since the indicator lags behind changes in price.
4. Declining Short Interest to Catch Bullish Stocks
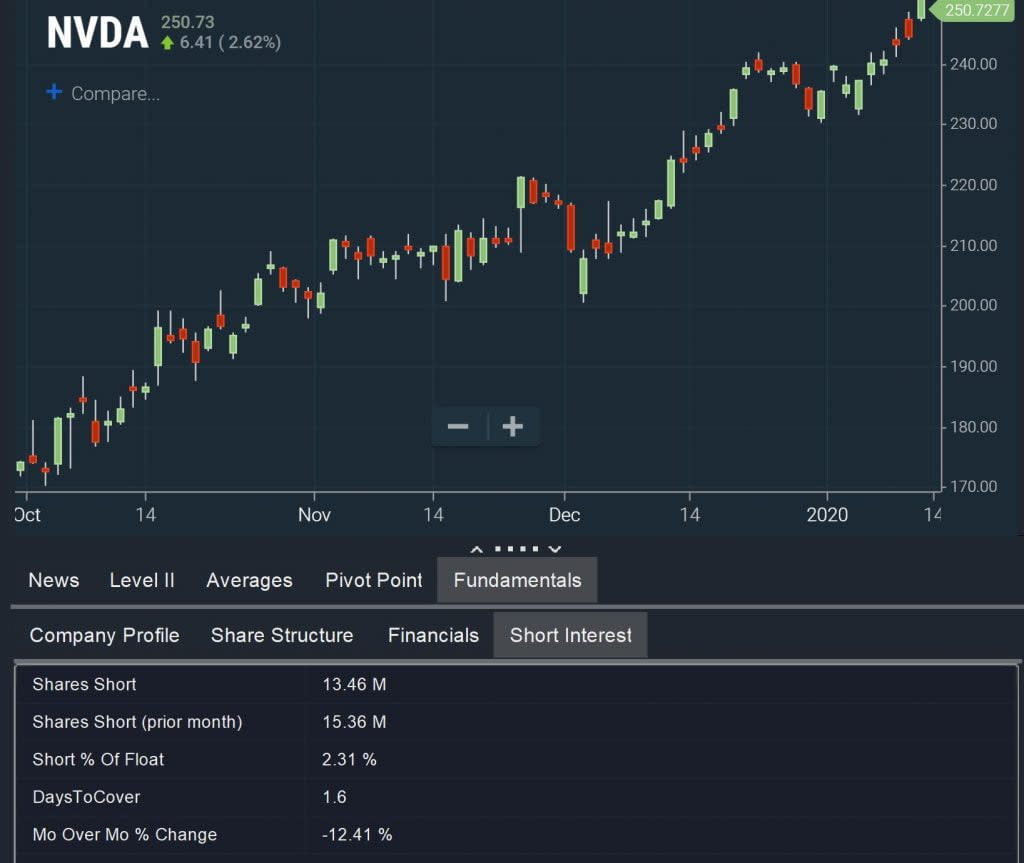
Looking for a decline in short interest is an interesting way to spot bullish stocks, which may or may not show up in your scans when using other indicators. Short sellers fleeing from a stock may be a sign of strong fundamentals, a positive financial report, or improving conditions in an industry. Alternatively, if a stock already had a high level of short interest, a modest increase in price can trigger a short squeeze – which in turn accelerates the bullish price movement.
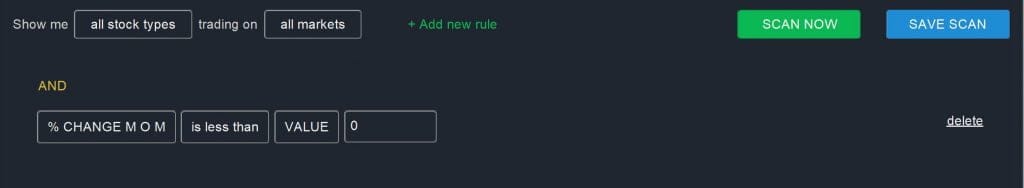
You can spot declining short interest with the following scan:
% Change M O M is less than 0
If you want to narrow your search further to stocks that are losing short interest in droves, you may consider changing the scan value to -10 or less. You can find the exact change in short interest in a stock identified by your scan by navigating to Fundamentals > Short Interest in the Charts module.
5. New Highs and Lows to Find Trading Opportunities
Stocks that are hitting new highs or lows offer a number of trading opportunities. Some of these stocks will have strong momentum behind them, propelling them to new highs. Others may meet resistance, lending themselves to consolidation that you can then act on before a renewed price movement. Or, highs and lows may identify peaks and troughs that form immediately before a reversal.
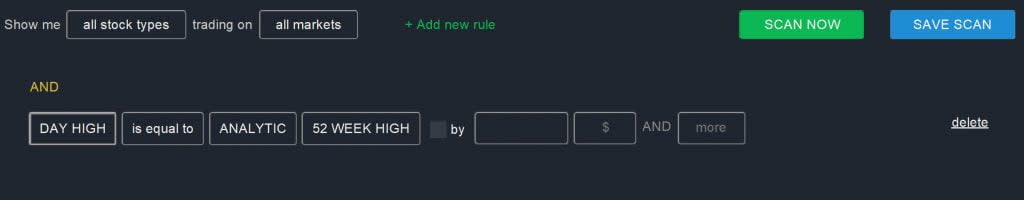
While the exact scenario around each new high and low may differ, it’s easy to add a filter that looks for stocks hitting new highs and lows into your scans:
DAY HIGH is equal to ANALYTIC 52 WEEK HIGH
If you’re interested in stocks that are close to a new high or have hit one in the past few days, you can change the DAY HIGH parameter to the 5 DAY HIGH parameter.
Depending on your trading strategy, it may be worthwhile to filter for RSI as well when looking at new highs and lows. This will give an indication of the price momentum around the high or low.
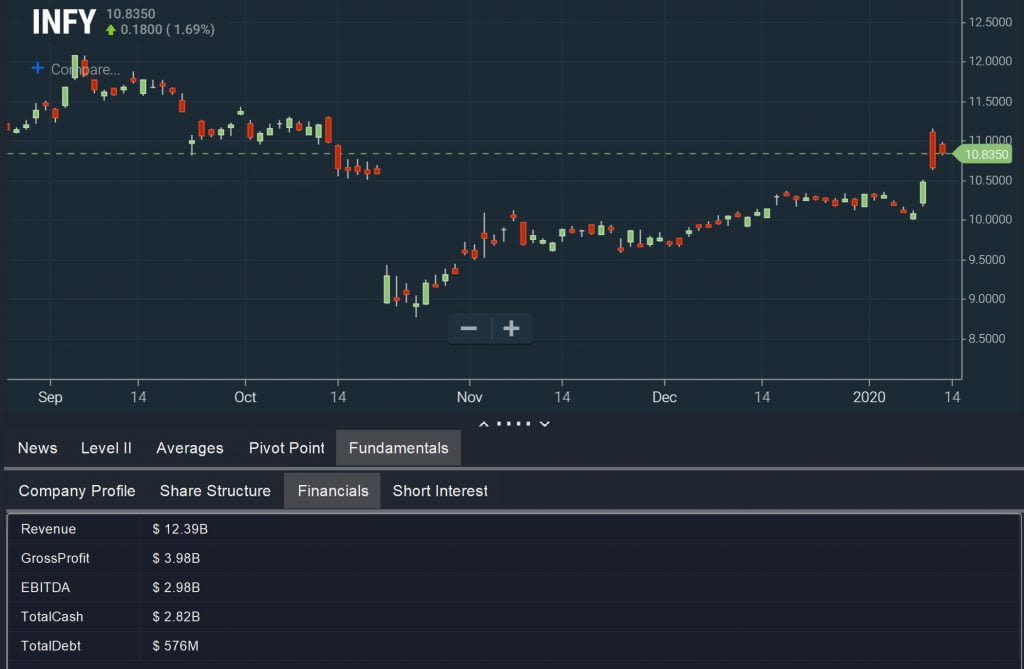
6. Fundamentals to Find Strong Companies
The Pro Scanner allows you to dive into companies’ fundamental metrics as well as their technical price movements. While you can use fundamentals to search for stocks in a specific market capitalization group, you can also use fundamental parameters to identify companies that are poised for growth.
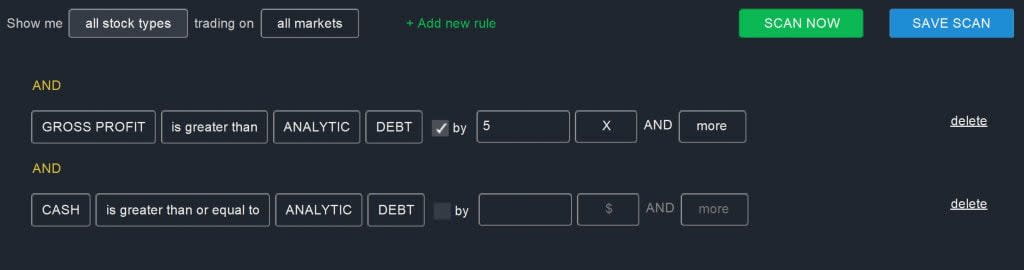
There are several ways to go about this, but one example is to look for companies that can pay back their debts either with cash on hand or within several years using net income. This test is a strong way to check whether companies have manageable amounts of long-term debt:
GROSS PROFIT is greater than ANALYTIC DEBT by 5X AND more
AND
CASH is greater than or equal to ANALYTIC DEBT
Keep in mind that this doesn’t provide information about changes in debt or revenue over time, so you may want to do additional research into companies you identify using this filter.
Alternatively, you can build a watchlist of companies that are strong based on earnings or revenue growth over time. With that, you could use the Breakouts module in Scanz to keep an eye on price movements among these companies.
Conclusion
These six filters can help you take your stock scans to the next level, winnowing down your results to only the stocks that are most relevant to your trading strategy. When building scans, keep in mind that it’s possible to combine multiple of these filters in the Pro Scanner to achieve unique results.
Related Reading:
- Ultimate Guide to Technical Stock Screeners
- How to Use a Stock Screener
- Fundamental Stock Screeners: Going Beyond Price Action
Ready to start scanning? Try for free and choose the plan that fits your workflow.