One of the most difficult aspects of analyzing stock price charts is looking at noisy price data. While volatility is critical for profitable trading, it can also make it tricky to spot price trends.
Moving averages help traders cut through the noise and quickly spot directional price movements. In particular, moving average crossovers can provide critical information about stocks’ momentum and trend changes over time.
In this guide, we’ll explain how you can put moving average crossovers to work for you and show you how to scan for moving average crossover using Scanz.
If you are new to using moving averages in your scans, make sure to check out this video first:
What is a Moving Average?
A moving average is a simple technical indicator that smooths out price data over time. A basic moving average simply calculates the average closing price of a stock over a set number of previous days. So, to determine the 10-day moving average, you could add up the closing price of a stock on each of the past 10 days and then divide by 10.
You can calculate a 10-day moving average like this every day. Then draw a line connecting the points to form a moving average overlay, like the kind that is used in most stock charting software.

Importantly, there are two different types of moving averages: simple moving averages and exponential moving averages.
Simple moving averages work as in the example above. Each day’s closing price is weighted equally to calculate the overall moving average.
Exponential moving averages use a more complicated calculation that gives more weight to recent price data. So, in the example above, yesterday’s closing price would have a bigger impact on the moving average than the closing price from 10 days ago. Many traders prefer exponential moving averages because they are more responsive to recent price action than simple moving averages.
Another thing to note is that moving averages can be applied over any timeframe. Moving averages that use the daily closing prices are common, but so are moving averages calculated based on one-minute, 15-minute price intervals, or even weekly price intervals.
What is a Moving Average Crossover?
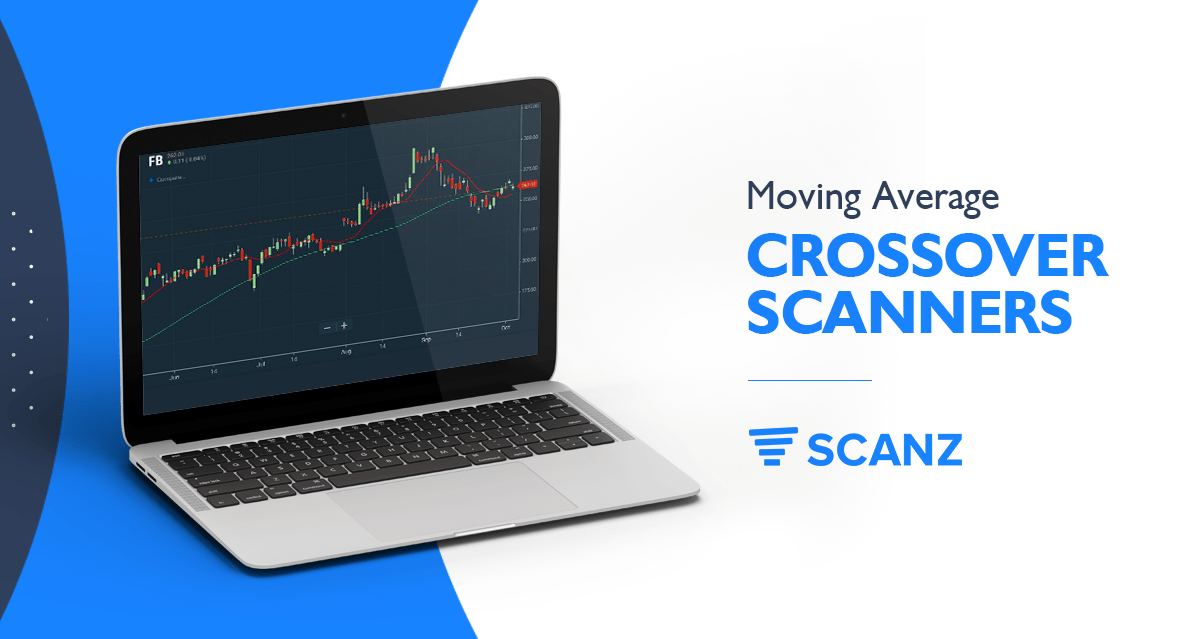
While a single moving average provides a lot of information, traders can get even deeper insights by looking at two different moving averages for a single stock. For example, it is possible to compare a plot of the 10-day moving average for a stock to the 50-day moving average for the same stock.
The two moving averages are said to experience a crossover when the 10-day moving average line crosses above or below the 50-day moving average line.

The Significance of Moving Average Crossovers
Moving average crossovers are closely watched by traders because they can indicate a shift in a stock’s price momentum or direction. For example, consider what it means when a 10-day moving average crosses from below a 50-day moving average to above it. Such a crossover happens because the stock has recently gained ground at a faster pace that it had been. This can mean that the stock is picking up price momentum or that it is experiencing a reversal after a downtrend.
Moving average crossovers can also signal bearish price action. If a short-term moving average crosses below a longer-term moving average, that indicates that recent price action has been more sharply downward compared to movement in the past.
Based on that, moving average crossovers provide key information about how a stock’s price trend may be changing. Looking for crossovers can be important for identifying trade entry and exit points.
How to Build Moving Average Crossover Scans
To create moving average crossover scans with Scanz, we’ll use the Pro Scanner. This allows us to fully customize the timeframe of the moving averages we’re interested in so that crossovers are relevant to your trading strategy.
Let’s start with basic crossover scan that is looking for instances where the 50-day moving average recently crossed above the 200-day moving average:
Exponential Moving Average (Daily, 50) is greater than ANALYTIC Exponential Moving Average (Daily, 200) by 1% AND Less

The ‘by’ parameter is important because it ensures that the screen turns up only recent crossovers. However, it is important to analyze the price charts of stocks that turn up in the results in order to make sure that a bullish crossover has actually happened, and not that the 50-day moving average has dropped to within 1% of the 200-day moving average.

Comparing the 50- and 200-day moving averages can be very useful for swing traders, but day traders may be more interested in moving average crossovers on shorter timescales. In that case, you can create a similar scan that compares the 10-day to the 20-day moving average:
Exponential Moving Average (Daily, 10) is greater than ANALYTIC Exponential Moving Average (Daily, 20) by 1% AND Less


It’s also possible to create scans for bearish crossovers. In that case, you would search for stocks for which the short-term moving average crossed below the long-term moving average:
Exponential Moving Average (Daily, 10) is less than ANALYTIC Exponential Moving Average (Daily, 20) by 1% AND Less


Conclusion
Moving average crossovers provide important information about changing price trends and momentum. These crossovers are relatively easy to interpret and simple to scan for, making them a helpful data point for many traders. With Scanz, you can use the Pro Scanner module to create highly customizable moving average crossover scans that fit any trading strategy.


