While trading activity dies down after the closing bell, you can use the evening hours as a chance to get ready for the next day of trading. Many stocks develop technical setups over the course of a day before making big price moves one or two trading days later. With an after hours stock screener, you can search for these setups without worrying about the market moving around you and generate a watchlist of potential trading opportunities for the days to come.
In this article, we’ll explain why an after hours screener is important and show you how to build one using Scanz.
Generating Watchlist Ideas After Hours
While the trading day can be hectic, stocks tend to settle out at the end of each day as day traders and derivatives traders close out their position. That means that many stocks reveal technical setups that aren’t always apparent in intraday trading.
The evening hours offer the perfect chance to scan for these setups. For example, you might look for stocks that are hovering close to key resistance levels or that appear to be forming a recognizable chart pattern like a triangle. If you have a screener, you can quickly pull up stocks that may be lining up with your trading strategy and look through the charts. If there are any promising prospects that look like they could trigger a trade within your strategy, add them to a watchlist. Then, the next day, you have a watchlist of stocks that are worth your attention.
This workflow – from screener to watchlist to trade – is a highly effective way to stay ahead of the market. Rather than try to make decisions in real-time during trading, when prices are constantly changing and it’s hard to see the forest for the trees, you can set yourself up for success by identifying prospects during the relatively calm evening.
What to Look for After Hours
Exactly what you should be looking for with your after hours screener depends on your personal trading strategy. It’s important that you have a clear idea of what a setup for your trading strategy looks like, since that’s how you will evaluate stocks turned up by your screen.
That said, there are a few basic things you can include in a basic after hours scan. Volume, both during the trading session and in after hours trading, is a good indicator to check. Stocks that are trading with abnormally high volume may be poised for a big move the following day.
Another thing to consider is where a stock’s price is sitting with respect to its moving averages. Is the stock in an uptrend or a downtrend? Checking the charts to see whether a stock is at a key support or resistance level or has recently broken out or reversed is also important when putting together a watchlist.
After Hours Stock Screeners Video Guide
After Hours Stock Screener Examples
Let’s take a closer look at some after hour screeners you can build using the Pro Scanner in Scanz. Keep in mind that these examples are meant to be built on, and your after hours screener should be designed as an integral part of your broader trading strategy.
Testing Support or Resistance
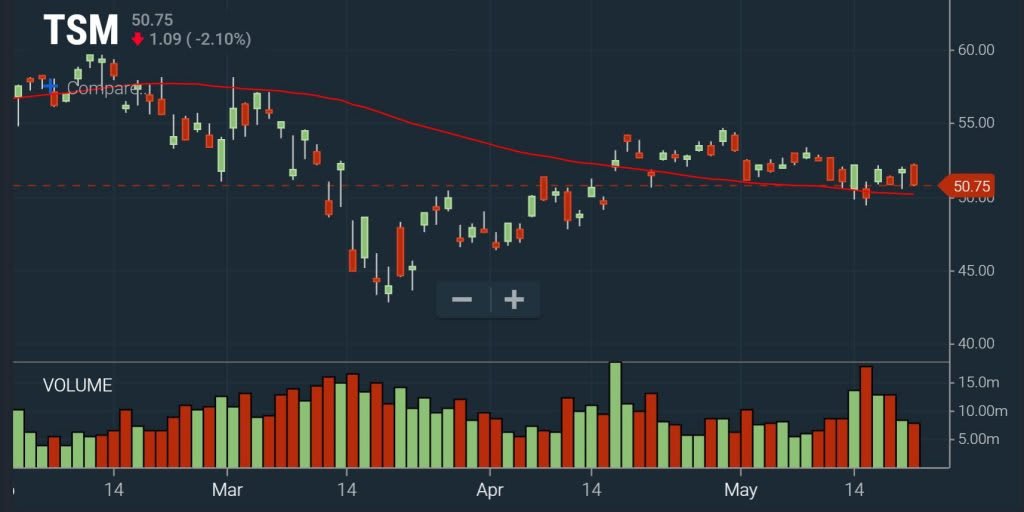
Often, stocks will test out key support or resistance levels for a trading day before breaking through them or reversing. Searching for stocks that are near their support or resistance levels is one of the best ways to use an after hours screener to spot trading setups.
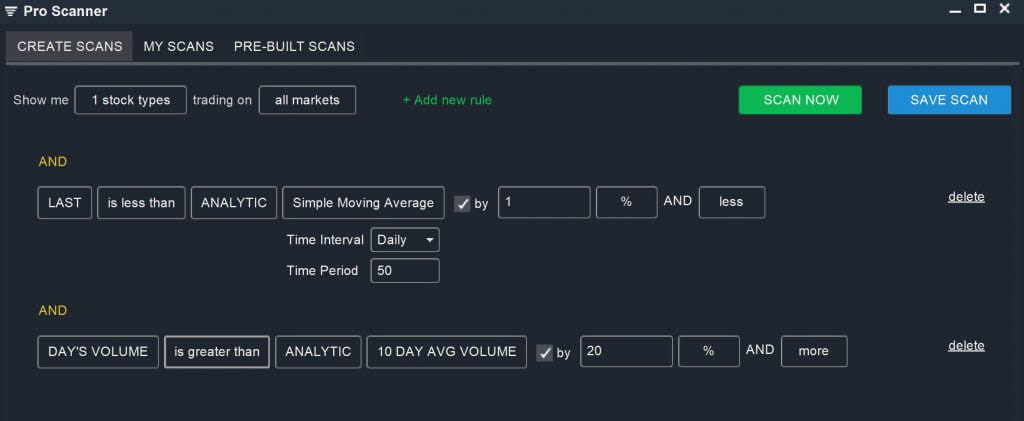
A stock that is readying for a breakout or a breakdown will usually trade with higher than average volume, even if it doesn’t break about its resistance level. So, to find potential breakouts, you can create a scan that searches for stocks trading near a resistance level on higher than average volume:
LAST is less than ANALYTIC Simple Moving Average (Daily, 50) by 1% AND Less
AND
DAY’S VOLUME is greater than ANALYTIC 10 DAY AVG VOLUME by 20% AND More
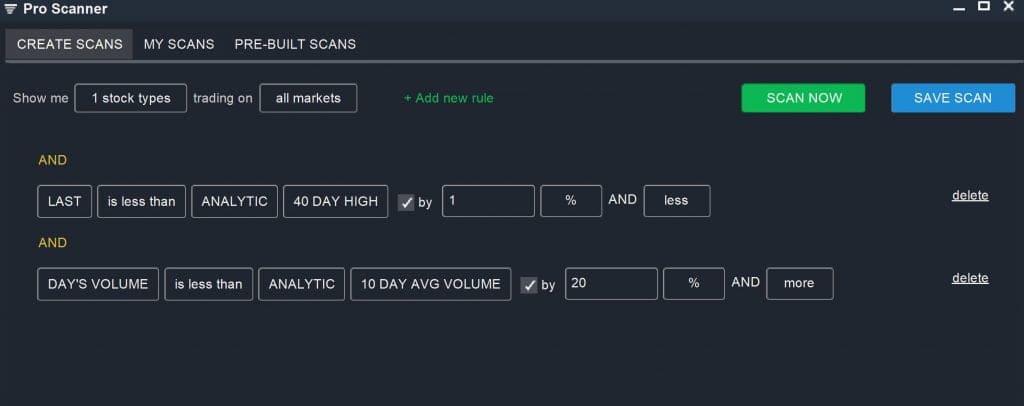
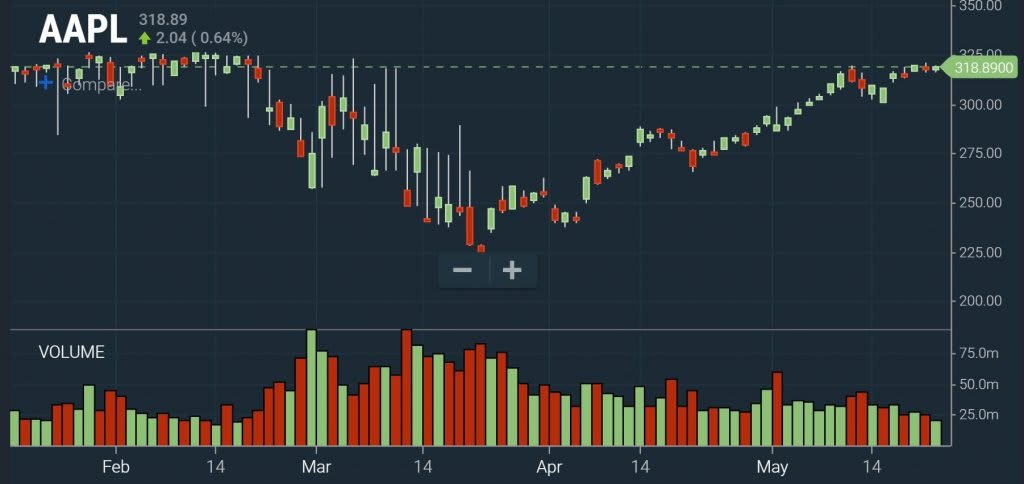
Alternatively, low volume is often a sign of an impending reversal. To look for potential reversals, you can modify this screen to search for stocks that are setting new highs but seem to be running out of momentum:
LAST is less than ANALYTIC 40 DAY HIGH by 1% AND Less
AND
DAY’S VOLUME is less than ANALYTIC 10 DAY AVG VOLUME by 20% AND More
This scan can be further narrowed by looking only for stocks with declining momentum, such as those with a declining ADX value, or for stocks that are overbought based on RSI.
Momentum Continuation
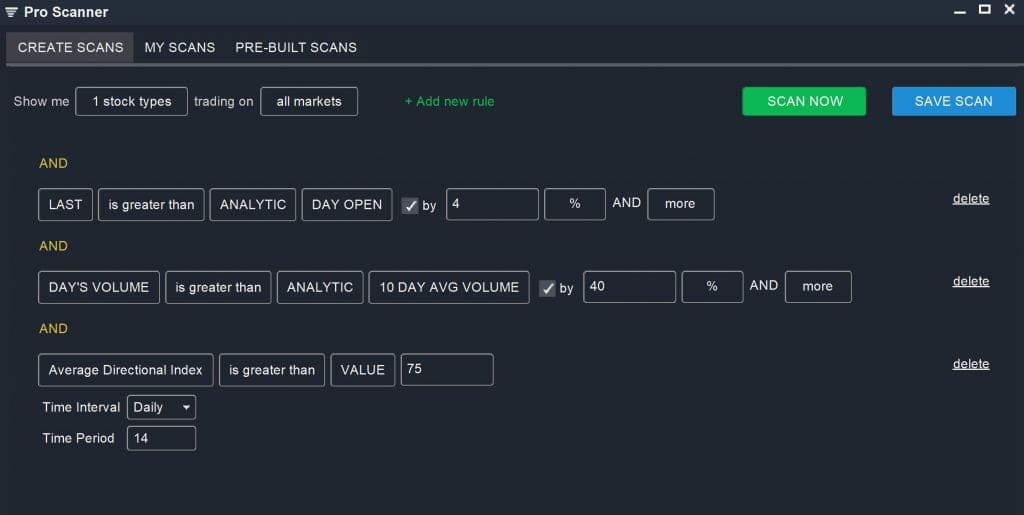
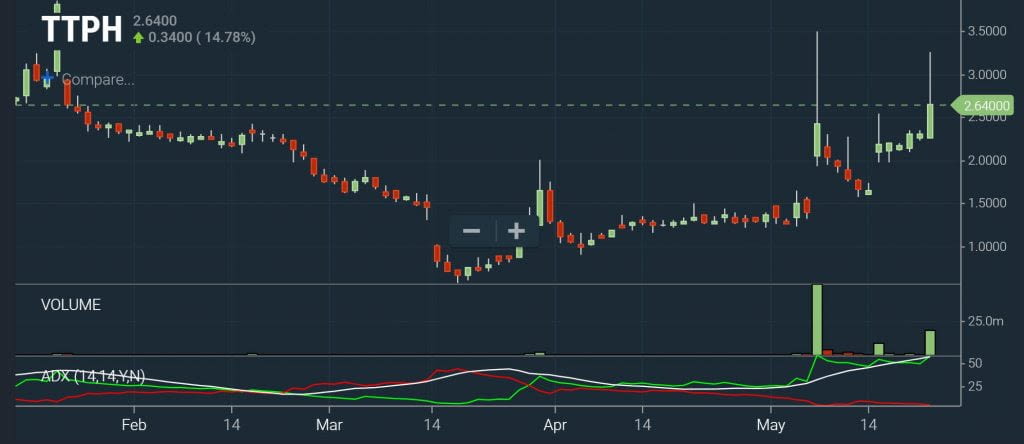
Another setup that you can spot using an after hours screener is a momentum continuation – stocks that are likely to continue a large directional move. There are a number of ways to spot momentum stocks, but one basic option is to look for high volume and a large price move, combined with strong directional indicators. For example, you can look for stocks that are likely to continue a bullish trend:
LAST is greater than ANALYTIC DAY OPEN by 4% AND More
AND
DAY’S VOLUME is greater than ANALYTIC 10 DAY AVG VOLUME by 40% AND More
AND
Average Directional Index (Daily, 14) is greater than VALUE 75
You can also spot trends using other indicators, such as moving averages or MACD, that may work better with your trading strategy. Of course, this screen also works for spotting bearish continuations.
Conclusion
Taking advantage of the evening hours to scan for setups that fit your trading strategy can help prepare you for the next day of trading. There are many ways to design after hours stock screeners, so you should experiment to find what combination of parameters works best for you. Running a nightly screener is one of the best ways to ensure that you go into each day with a game plan and a watchlist of stocks that play into your trading strategy.
Related Reading:
- Real-Time Watchlist Scanners: Build Your Daily Game Plan
- How to Find Stocks to Day Trade
- How to Find Breakout Stocks
Ready to start scanning? Try for free and choose the plan that fits your workflow.