Momentum traders are looking to capitalize on stocks that are moving steadily upwards or downwards. The bet is that a stock that’s trending will continue on its trajectory for at least long enough to enter a position, realize a profit, and exit.
Succeeding as a momentum trader requires being able to find trending stocks as they’re picking up steam and enjoying the best part of their run. If you only know how to find stocks after they’ve displayed a strong trend, right when their momentum is wearing off, you’ll have a difficult time spotting profitable momentum trading opportunities. So, let’s take a look at how you can use Scanz to scan for momentum stocks that are getting ready to run.
Basics of Momentum Scanning
Moving Average Stack
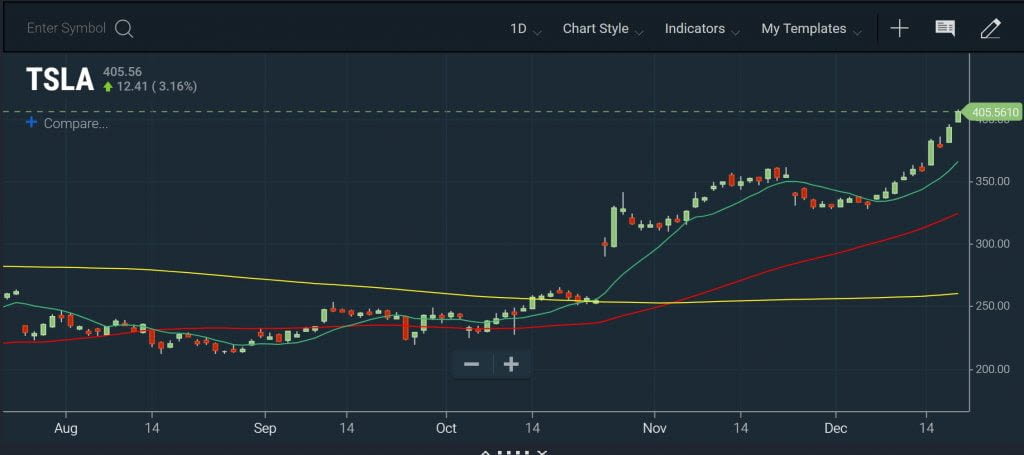
One of the most reliable ways to spot trending stocks is to look for prices that have continually gone up or down over time. This type of sustained price movement is captured by moving averages – a short-term moving average will be consistently above a long-term moving average for a bullish run, or below for a bearish run. Even better, divergence between the moving averages indicates that the price movement is accelerating rather than decelerating.
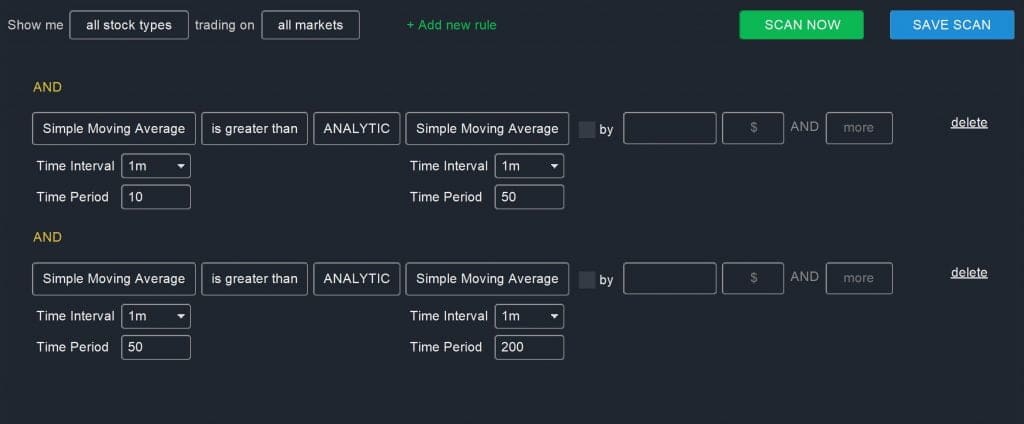
Most momentum traders use the 10-, 50-, and 200-period moving averages:
Simple Moving Average (Daily, 10) is greater than ANALYTIC Simple Moving Average (Daily, 50)
AND
Simple Moving Average (Daily, 50) is greater than ANALYTIC Simple Moving Average (Daily, 200)
You can filter out noisier trends or stocks that may be faltering by adding a rule that limits your scan to stocks that are hitting new 20-day or even 52-week highs.
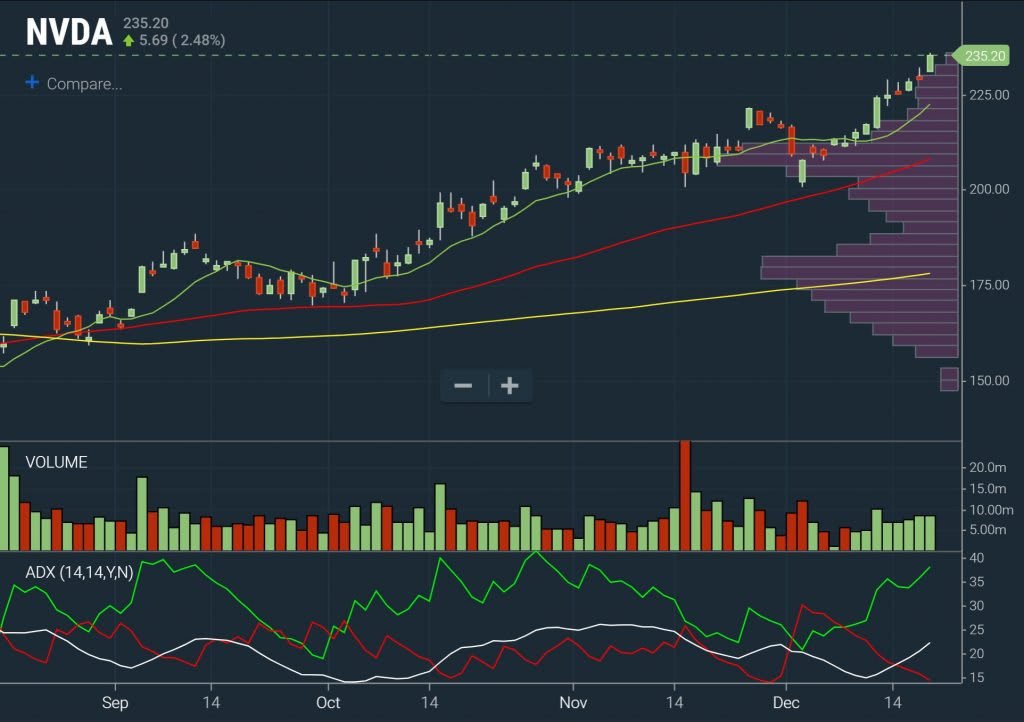
Average Directional Index
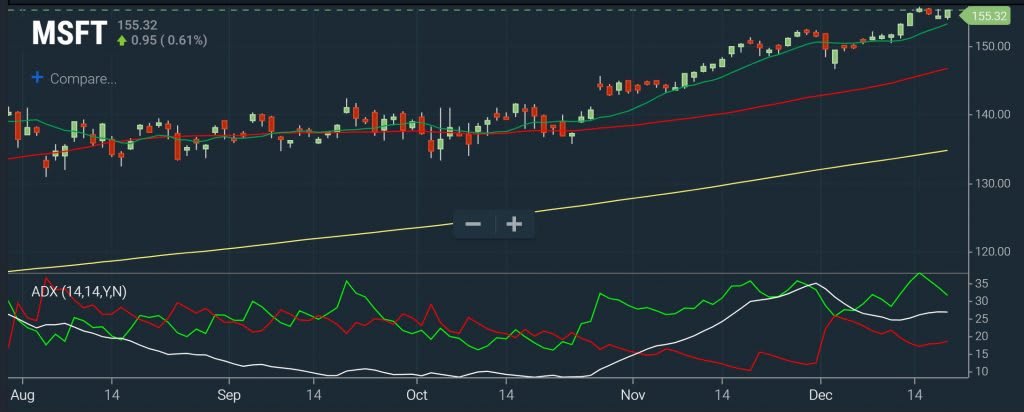
The average directional index (ADX) is a technical indicator that can be used on its own to scan for trending stocks, or added into another scan. ADX was designed specifically to look for trending stocks – if the ADX has a value greater than 25, it’s a good sign that a strong trend has developed. You can add this into your scans using the following rule:
Average Directional Index (Daily, 14) is greater than or equal to VALUE 25
This indicator is very powerful when combined with a scan for stacked moving averages, since it confirms the presence of a strong trend. A dropping ADX can also warn you that a trend is wearing off long before the moving averages unstack themselves.
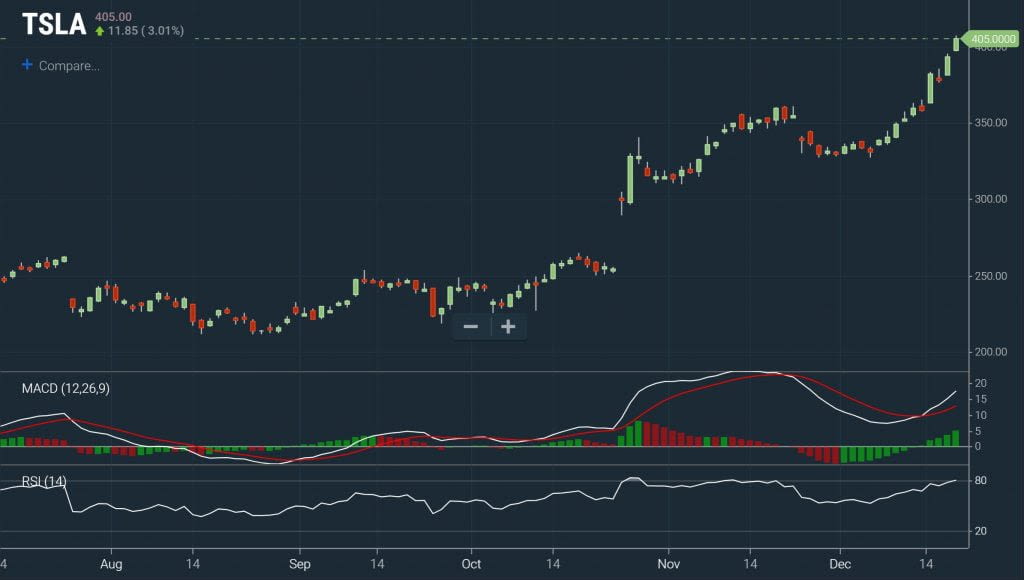
MACD, RSI, and Stochastics
The MACD is another powerful momentum indicator that can be used on its own. Whenever the signal line is above the MACD line, a stock has bullish momentum; when the signal line is below the MACD line, a stock has bearish momentum.
The MACD is even more powerful when combined with an indicator like RSI, which measures whether a stock is overbought or oversold. A rapidly rising RSI is a good signal that a trend is being sustained.
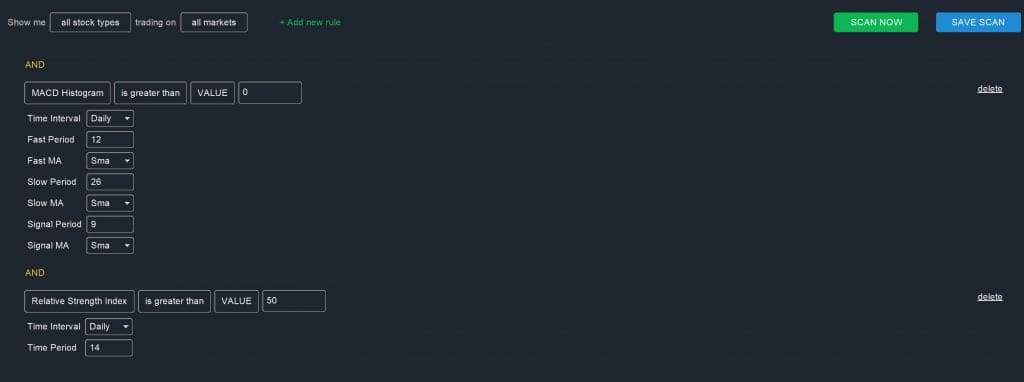
You can combine these parameters using this scan to find bullish stocks:
MACD Histogram is greater than VALUE 0
AND
Relative Strength Index (Daily, 14) is greater than VALUE 50
Reverse the scan (that is, less than 0 and 50) to scan for bearish stocks. Keep in mind that a stock that is gaining momentum rather than losing it should see the MACD histogram become increasingly positive or increasingly negative over time, rather than moving back towards zero. Also, while an RSI over 80 or under 20 often indicates that a stock is overbought or oversold, that may not be an accurate interpretation when a stock is trending.
Volume
As a rule of thumb, it’s a good idea to set a volume threshold for any momentum scan. If a stock is trending strongly, more and more traders should be piling into the stock to make a profit off of its momentum. Once volume starts to fade, it’s a strong indication that the momentum will soon start to wear off.
The best way to include volume in your momentum stock scans is simply to look for stocks that are trading above their average daily volume. The exact timeframe you should scan on depends on the timeframe of your momentum scan more generally, but many traders look to the 20-day average daily volume:
DAY’S VOLUME is greater than or equal to ANALYTIC 20 DAY AVG DAILY VOLUME
For intraday momentum stock scans, trading volume is paramount. A good momentum scan will require that the intraday volume be at least twice the 20-day average volume up to that point in the trading day.
Conclusion
Momentum trading is a powerful strategy for profiting when executed correctly. Succeeding in momentum trades starts with identifying stocks that are trending strongly with no signs of a looming falter. While it’s possible to base scans on a single strategy or technical indicator, the best momentum scans use a combination of multiple parameters to confirm a trend. Beware of low trading volume or bearish candlestick patterns, as these can foreshadow a reversal or loss of momentum.
Related Reading:
Ready to start scanning? Try for free and choose the plan that fits your workflow.