Bollinger Bands are a widely used technical indicator that can help identify trends and serve as an indicator of volatility. There are a number of trading strategies that use Bollinger Bands to identify entry and exit points, either as the primary trigger or as a confirmatory measure for another indicator.
So, how can you use Bollinger Bands to your advantage? In this article, we’ll explain how Bollinger Bands work, how you can use them as part of a strategy, and how you can create a Bollinger Bands screener using Scanz.
What are Bollinger Bands?
Bollinger Bands are a technical indicator first introduced by analyst John Bollinger in the 1980s. A standard set of bands is composed of three lines: a simple moving average, a line that’s two standard deviations of the price above the moving average, and a line that’s two standard deviations of the price below the moving average.
These three lines create an envelope that should contain the price unless there is a large and sudden (relative to the length of the moving average) change. In addition, when volatility increases, the standard deviation of the price increases – and so the bands widen accordingly.
The standard use of Bollinger Bands uses a 20-day simple moving average. However, that’s not set in stone and traders are free to use sets of bands based on a longer or shorter moving average. Importantly, traders can also create Bollinger Bands based on one or three standard deviations from the moving average rather than two. As we’ll see, creating multiple sets of Bollinger Bands can be a useful tool for some trading strategies.
Bollinger Bands in Action
There are many different ways to use Bollinger Bands, and arguably the best route for most traders is to incorporate them into existing strategies in combination with additional indicators. But, Bollinger Bands can also be used to provide actionable trading information on their own. Let’s take a look at three common strategies.
Overbought and Oversold Levels
At their most basic, Bollinger Bands can be used to identify overbought and oversold levels. Since the upper and lower bands are two standard deviations away from the moving average, price action outside this envelope is “extreme” relative to recent average price action. So, a stock might be considered overbought when it is above the upper band and oversold when it is below the lower band.
Just be careful with this application, since Bollinger Bands may lag momentum by a few days or more. If you’re relying on Bollinger Bands alone to identify overbought and oversold levels, you should limit trades to those in the direction of a stock’s broader price trend.
Identifying Buy and Sell Zones
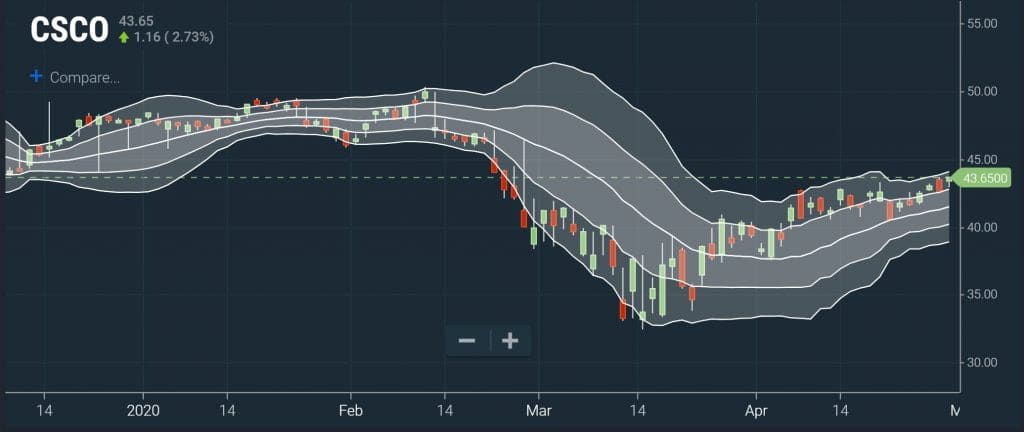
You can identify buy and sell zones by combining two sets of Bollinger Bands – one using the standard two standard deviation envelope, and another using a tighter one standard deviation envelope. When the price is in the area between the two upper bands, that is considered a buy signal. When it’s in the area between the lower bands, that is considered a sell signal.
This is useful because when you’re using only one set of Bollinger Bands, it’s common for a stock’s price to bounce around the upper or lower band. In that case, it’s hard to discern actionable buy or sell signals since the price frequently moves above or below the indicator line.
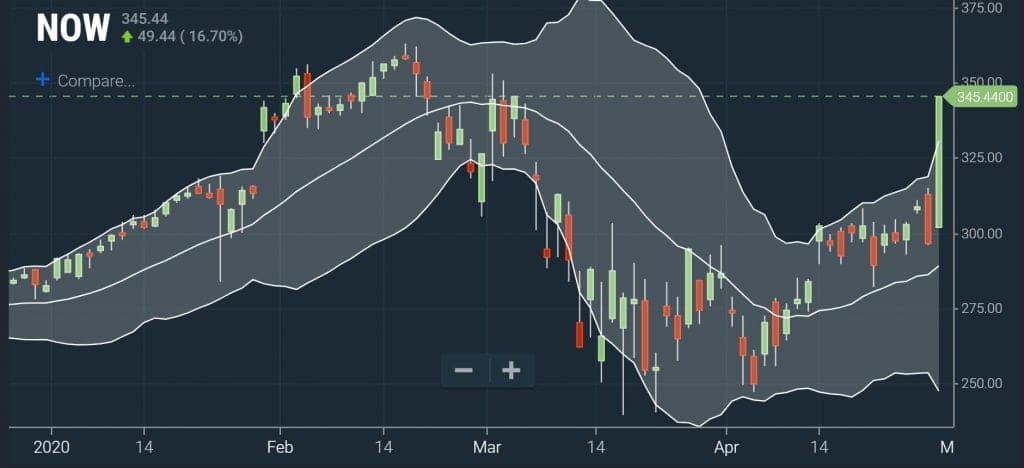
Bollinger Bands Squeeze
One commonly used and powerful trading strategy looks for consolidation around a standard Bollinger Bands envelope. In this case, a stock should trade with momentum, then consolidate around it’s high for several days. During that consolidation period, the Bollinger Bands envelope will contract. If the stock then breaks above the now tight Bollinger Bands envelope on strong volume, that’s a very bullish signal and often the start of a continuous movement.
How to Set Up a Bollinger Bands Scan with Scanz
With those strategies in mind, how can you create a Bollinger Bands scanner to spot potential trading opportunities? We’ll use the Pro Scanner in Scanz to create two bullish screens based on Bollinger Bands.
Stocks in the Bollinger Bands Buy Zone
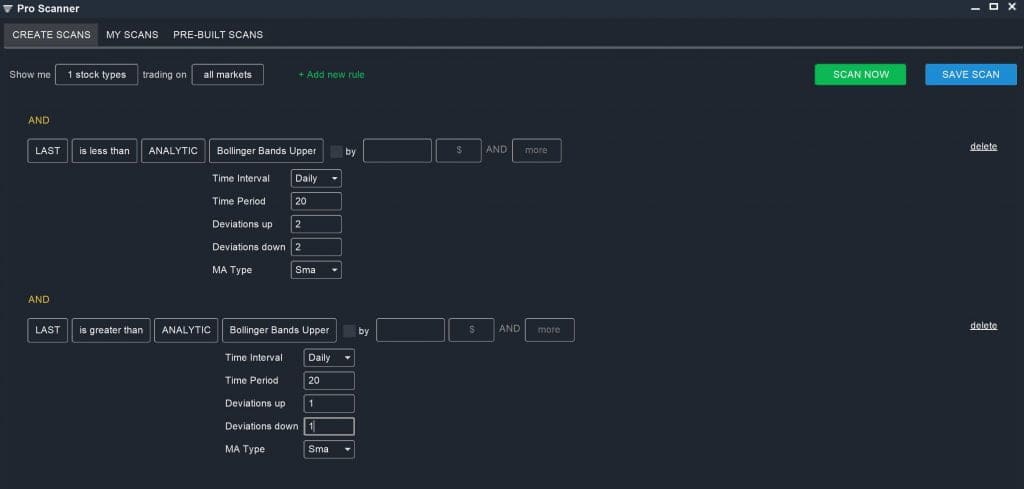
Scanning for stocks that fall in the “buy zone,” between one and two standard deviations above the moving average, is easy using the Pro Scanner:
LAST is less than ANALYTIC Bollinger Band Upper (Daily, 20, 2 S.D.)
AND
LAST is greater than ANALYTIC Bollinger Band Upper (Daily, 20, 1 S.D.)
Note that you can make this scan even more specific by requiring that both the low and high of the day fall in this range, or that yesterday’s closing price also falls in the buy zone.
Bollinger Bands Squeeze
Finding potential Bollinger Bands squeezes is slightly more involved, since stocks need to demonstrate a previous uptrend and consolidation. You can create a rough squeeze scan with the following parameters:
Simple Moving Average (Daily, 5) is greater than ANALYTIC DAY LOW
AND
Simple Moving Average (Daily, 5) is less than ANALYTIC DAY HIGH
AND
PREV DAY CLOSE is less than ANALYTIC Bollinger Band Upper (Daily, 20, 2 S.D.)
AND
DAY HIGH is greater than ANALYTIC Bollinger Band Upper (Daily, 20, 2 S.D.)
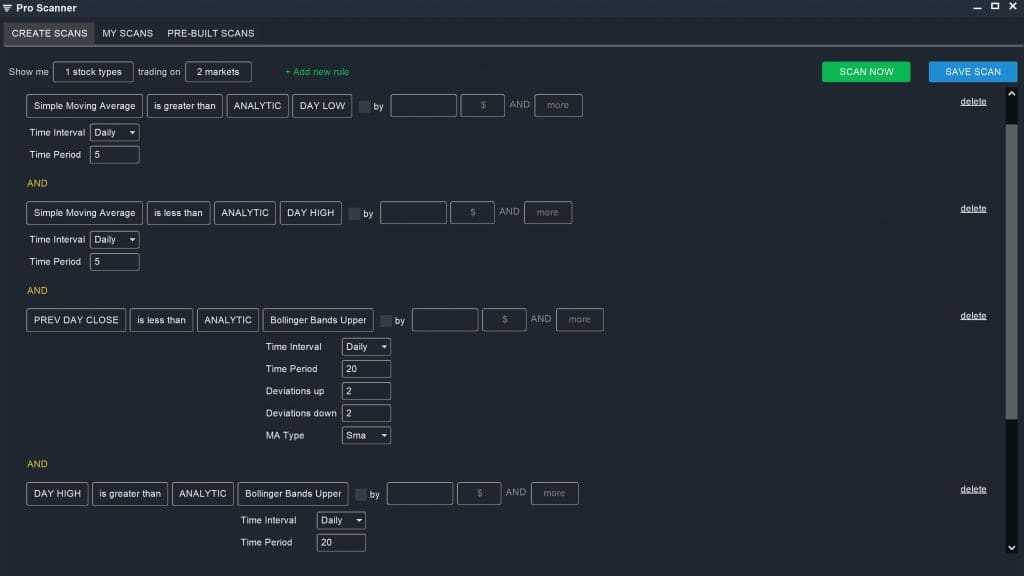
The five-day simple moving average parameters in this case help to limit your search to stocks that have been consolidating around a price for at least several days. The Bollinger Bands parameters work together to show only stocks that have just entered a potential squeeze, as opposed to stocks that have already seen most of their gains following a squeeze.
Note that you may also want to add in a longer-term moving average parameter to limit your scan to stocks that have established a prior upward trend. You can also reverse this scan to look for bearish squeezes as stocks break below their lower Bollinger Band.
Conclusion
Bollinger Bands are a powerful technical indicator that work well on their own and even better when used in conjunction with other indicators. With Bollinger Bands, you can find stocks that are poised for a trend continuation and get out of stocks at the first sign of weakening momentum. With Scanz, it’s easy to create a Bollinger Bands scanner so that you never miss a swing or momentum trading opportunity.
Related Reading:
- A Complete Guide to Bollinger Bands
- RSI Stock Screeners: Combining Momentum Indicators
- Overbought Stock Screeners: Using Multiple Signals
Ready to start scanning? Try for free and choose the plan that fits your workflow.