The cup and handle pattern was first introduced in 1988 by analyst William O’Neill and has since become a favored chart pattern among traders because it is relatively straightforward to recognize and trade on. The pattern forms during as a result of consolidation a bullish movement and indicates a continuation of that bullish trend after its completion.
Cup and Handle Pattern
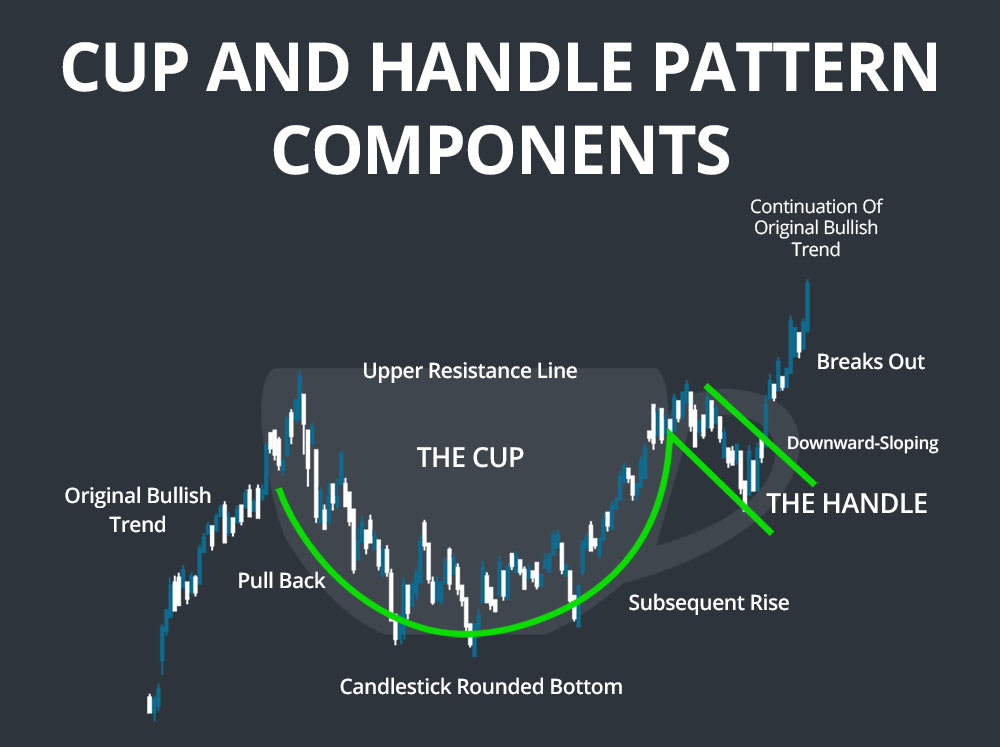
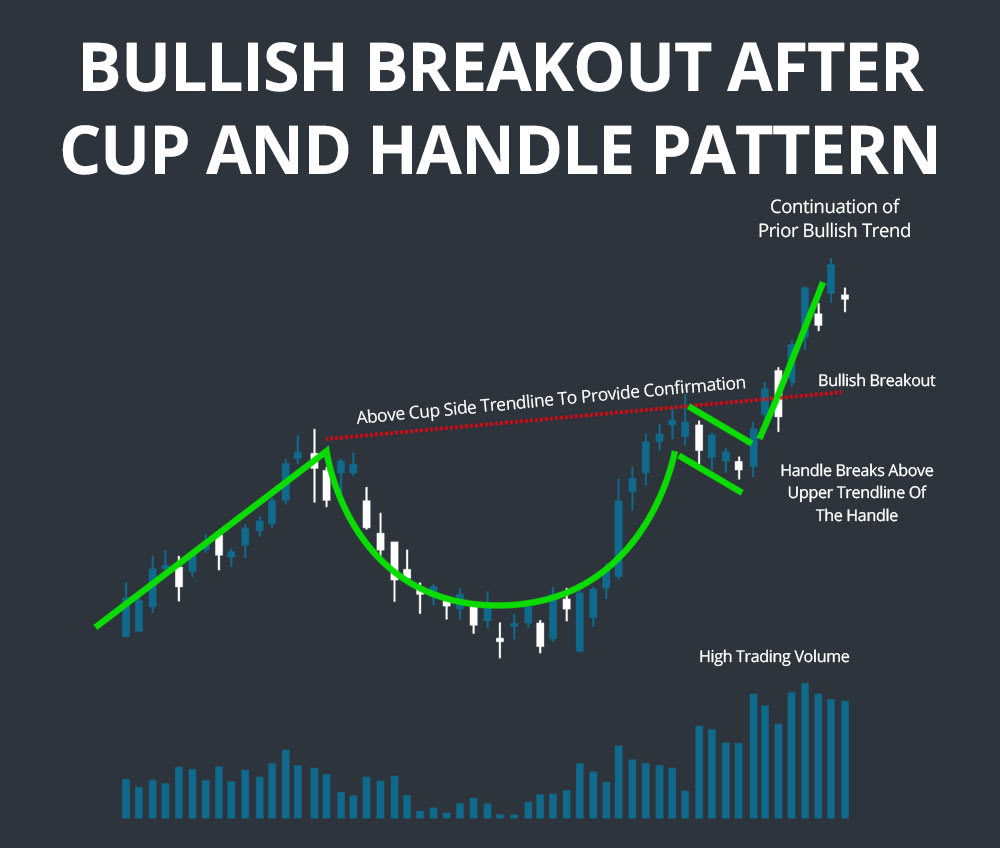
The cup and handle pattern is a bullish continuation pattern that consists of two parts, the cup and the handle. The cup typically takes shape as a pull back and subsequent rise, with the candlesticks in the center of the cup giving it the form of a rounded bottom. The handle is made up of downward-sloping price action that soon breaks out above the upper resistance line to indicate the continuation of the original bullish trend.
Inverted cup and handle patterns are also possible during downtrends and signal bearish continuations. In this case, the cup shape is inverted such that it represents a resurgence in price after a downtrend followed by a downward movement. The handle slopes upwards before breaking out sharply downward to continue the original bearish trend.
Timeframes
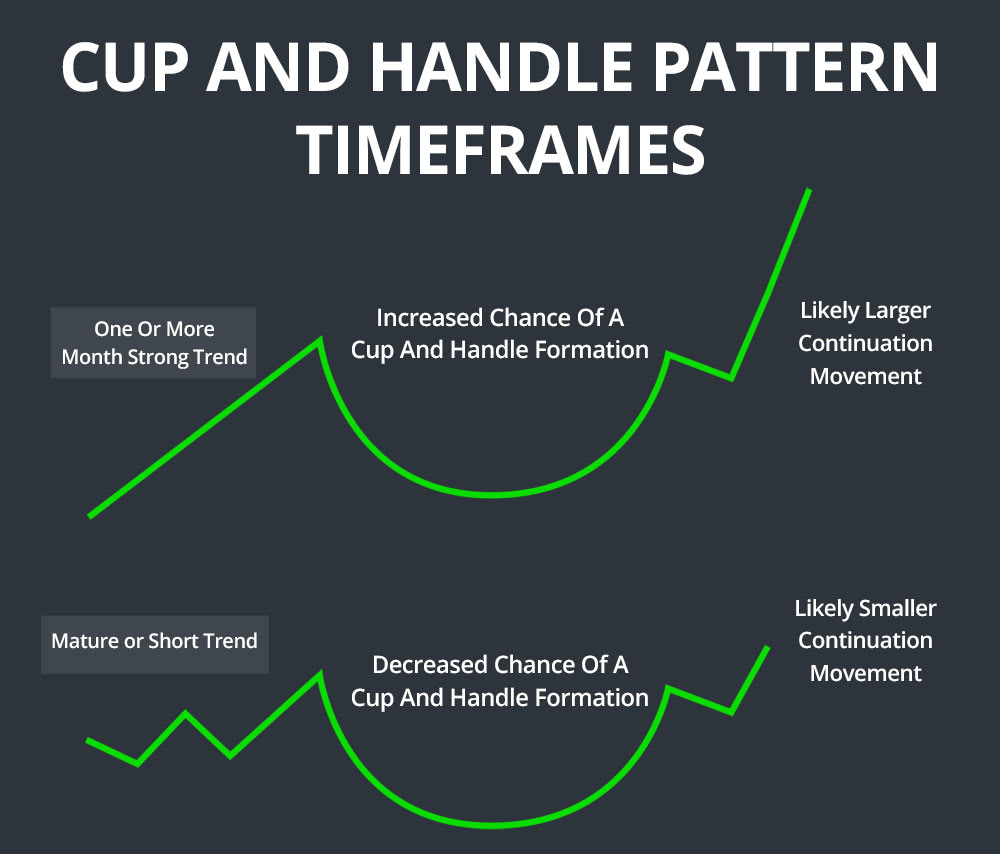
Cup and handle patterns typically are seen to occur on a daily chart after a strong trend has progressed for one or more months. As a trend matures, the chances that the cup and handle forms decrease, while any cup and handle that does form is likely to produce a smaller continuation movement with less upside potential.
Cup and handle patterns can also occur on shorter timeframes, although trading these requires quick recognition and confirmation of the breakout at the end of the handle in order to profit. Again, beware cup and handle patterns that form at the end of a trend rather than partway through it, as they are less likely to signal a strong continuation.
Cup and Handle Patterns Simplified
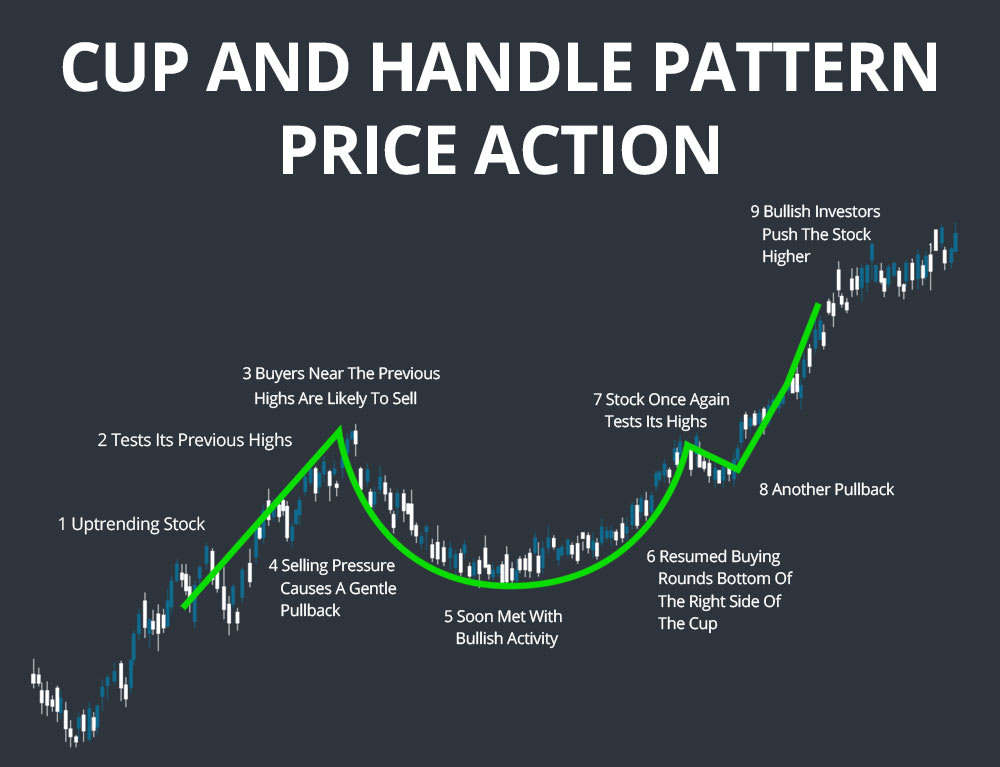
Cup and handle patterns form as the result of consolidation after an uptrending stock tests its previous highs. At that level, traders who bought the stock near the previous highs are likely to sell, causing a gentle pullback. This pullback is then met with bullish activity, which causes the rounded bottom and rise of the right side of the cup. As the stock once again tests its highs, another pullback – the handle – is observed, but this time bullish investors are able to push the stock higher as they snap up discounted shares.
How to Trade Cup and Handle Patterns
Recognizing Cup and Handle Patterns
When evaluating whether a cup and handle pattern is real, it is important to look at the shapes of both the cup and the handle.
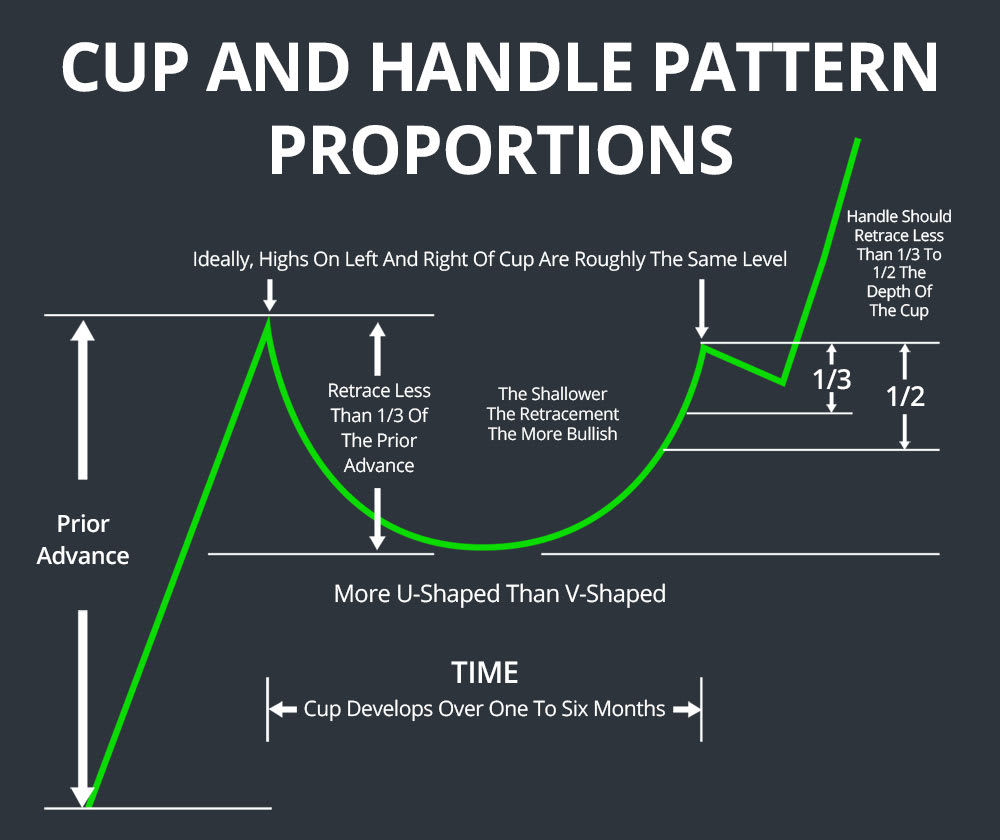
The cup should be more U-shaped than V-shaped, as a gentle pullback from the high is more indicative of consolidation than a sharp reversal. The U-shape also demonstrates that there is strong support at the base of the cup and the cup depth should retrace less than 1/3 of the advance prior to the consolidation pullback. However, cup depths between 1/3 to ½ the level of the prior advance are possible in volatile markets, and even cup depths retracing 2/3 of the prior advance are possible in extreme setups. The cup can develop over a period of one to six months on daily charts, or even longer on weekly charts. Ideally, the highs on the left and right side of the cup are at roughly the same price level, corresponding to a single resistance level.
The handle can be either a small, unorganized pullback, or a bear flag or pennant. In any case, the handle should retrace less than 1/3 to 1/2 the depth of the cup – the shallower the retracement, the more bullish the movement following a breakout should be. The handle can develop over one week to several months on a daily chart, although ideally completes in less than one month.
Breakout
A bullish breakout, signaling a continuation of the prior bullish trend, occurs when the handle breaks above the upper trendline of the handle, which is typically below the resistance line set by the right side of the cup. The breakout should occur on high trading volume and continue above the trendline drawn from the left to the right side of the cup to provide confirmation. However, if the right side of the cup is well below the left side, it is prudent to wait until the handle breaks above the level of the left side of the cup before committing to the breakout and anticipated continuation.
Trading Strategies
Stop buy orders can be used to automatically trade a breakout above the handle’s upper trendline or above the level of the right side of the cup. Once an entry is made, it is possible to set a price target on the extent of the bullish movement by adding the price difference between the bottom of the cup and the level of the breakout above the handle’s upper trendline to the price at the breakout point.
Examples
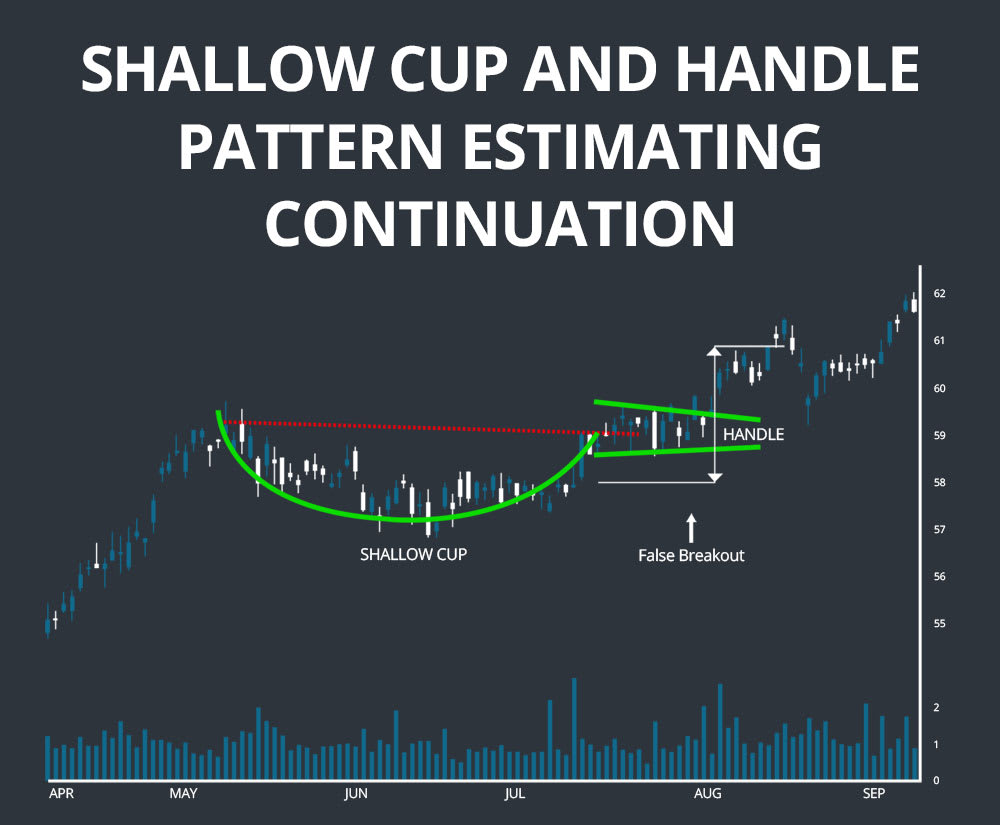
The first example shows a shallow cup and handle pattern developing over the course of approximately two to three months. The cup features a gentle pullback after a strong bullish movement and the right side of the cup reaches the same price level as the left side of the cup. The false breakout in the handle on August 13 occurs on low trading volume, demonstrating the importance of using trading volume as a method of confirming the breakout. Estimating the extent of the continuation movement by measuring the distance between the base of the cup and the breakout slightly underestimated the movement.
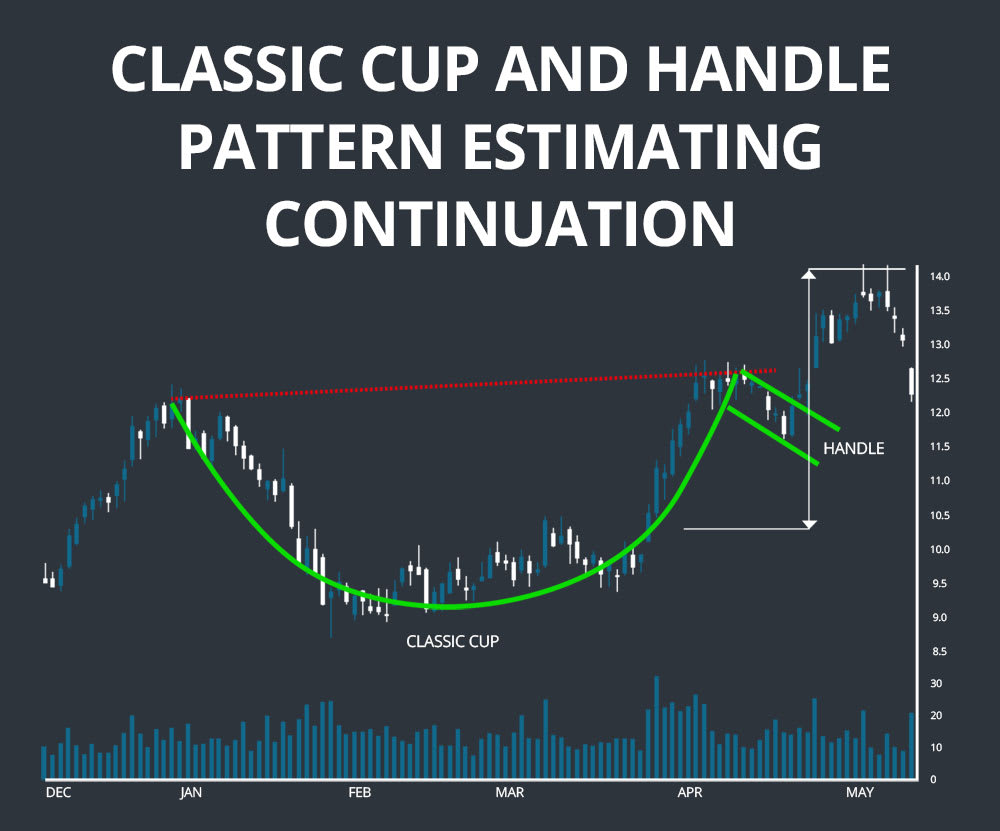
The second example is another classic cup and handle pattern that develops over three to four months, with the handle forming over approximately two weeks. The cup retraces slightly more than half the preceding movement, which is relatively mature prior to the cup and handle pattern’s formation. The right side of the handle rises higher than the left and the pattern slightly overestimates the extent of the bullish continuation after the breakout.
Conclusion
The cup and handle pattern is a bullish continuation pattern triggered by consolidation after a strong upward trend. The pattern takes some time to develop, but is relatively straightforward to recognize and trade on once it forms. As with all chart patterns, trading volume and additional indicators should be used to confirm a breakout and continuation of the original bullish price movement.
Related Reading:
- A Comprehensive Guide to Triangle Patterns
- A Comprehensive Guide to Wedge Patterns
- How to Find Breakout Stocks
Ready to start scanning? Try for free and choose the plan that fits your workflow.