Exchange-traded funds (ETFs) are extremely popular assets that enable traders to gain exposure to an entire asset class or market sector in one trade. ETFs reduce your risk relative to trading a single company’s stock, but they do so largely without taking away from your profits when the market or an industry makes a big move up.
In this guide, we’ll explain what ETFs are, how they work, and what you need to consider when trading them. Then, we’ll explore how you can find ETFs to trade using the Scanz Easy Scanner or create a custom ETF screener using the Pro Scanner.
What are ETFs?
ETFs are baskets of stocks, much like mutual funds. The main difference between ETFs and mutual funds is that ETFs are publicly traded on major exchanges like the NYSE and Nasdaq. You can buy and sell ETFs like you would any other stock. In addition, many ETFs have lower management fees than comparable mutual funds.
In general, the price of an ETF should reflect the value of its underlying assets. When the prices of stocks that an ETF invests in rise, the price of the ETF should rise as well.
Key Considerations for Trading ETFs
There are a few things to keep in mind when trading ETFs. The first is that you should always know what you are investing in. Some ETFs are designed to track a major index, like the S&P 500, or to mirror the performance of a specific market sector. Other ETFs invest in ‘growth’ or ‘value’ stocks, but exactly what securities are contained in any of these specific ETFs can vary widely.
In addition, some ETFs are passive, while others are actively managed in an effort to beat the market. Active ETFs can have tax consequences since you are liable for the purchases and sales made through the ETF. In addition, actively managed ETFs often have higher management fees that can impact your potential profit from trading.
It’s also important to differentiate between traditional ETFs and leveraged ETFs. Traditional ETFs track their holdings’ returns on a 1:1 basis, but leveraged ETFs may track returns on a 2:1 basis or higher by taking on debt and trading derivatives. Trading leveraged ETFs comes with additional risk, so it’s important to understand whether leverage is being applied in an ETF and, if so, how much leverage.
ETF Scanner Video Guide
Finding Top ETFs with the Easy Scanner
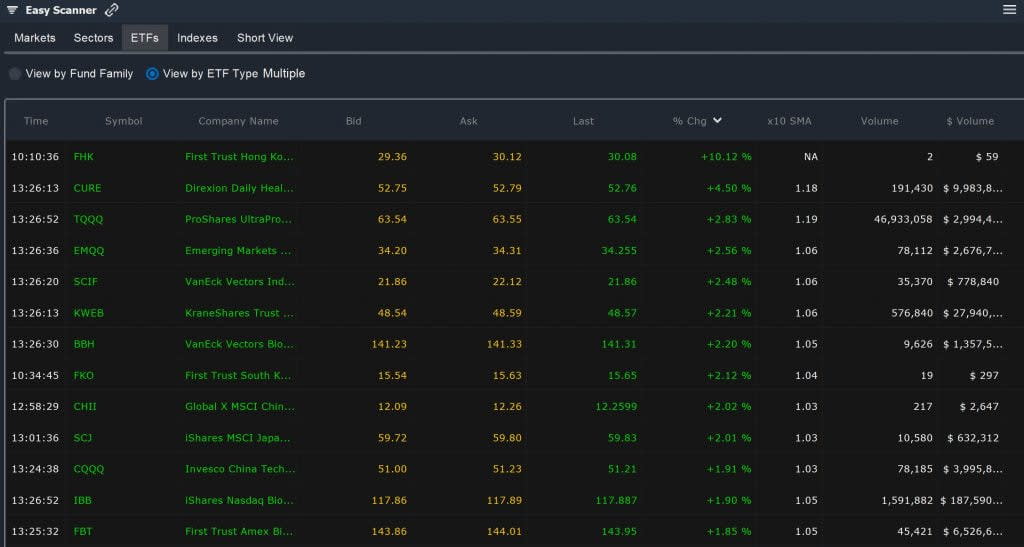
The Easy Scanner in Scanz has a specific sub-screener designed to help you find ETFs to trade. To start, you can narrow your screen by looking only at ETFs created by a specific firm or with a specific focus. If you only want to trade ETFs that invest in stocks, and not commodities or bonds, you can do so with the ETF Type screen.

Once you’re looking only at ETFs that fit your investing style, sort ETFs by the % Change column. Note that some high-flying ETFs trade with low liquidity, and these aren’t necessarily good candidates for trading. You can use the Volume and $Volume columns to get insight into an ETF’s liquidity.
Another option for finding potential ETFs to trade is to filter by the price relative to its simple moving average. This, combined with percent change, can help you find ETFs that may be poised for another big step up. You can compare the price against the moving average value directly, or display a multiple of the simple moving average.
Targeted ETF Screens with the Pro Scanner
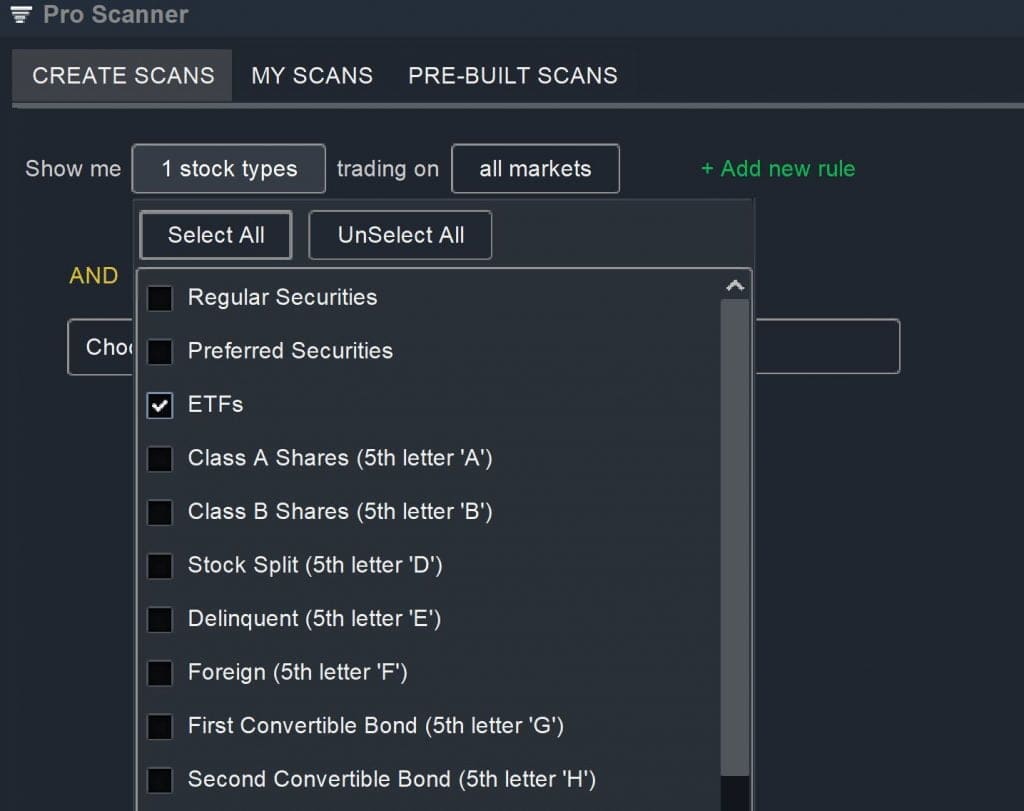
To create a more targeted ETF screener, you can use the Pro Scanner. To start, select ETFs under the ‘Stock Type’ drop-down menu. Note that the Pro Scanner does not enable you to specify specific types of ETFs for your screen as the Easy Scanner does, so it’s important to do your research into what the ETFs that your scans return actually contain.
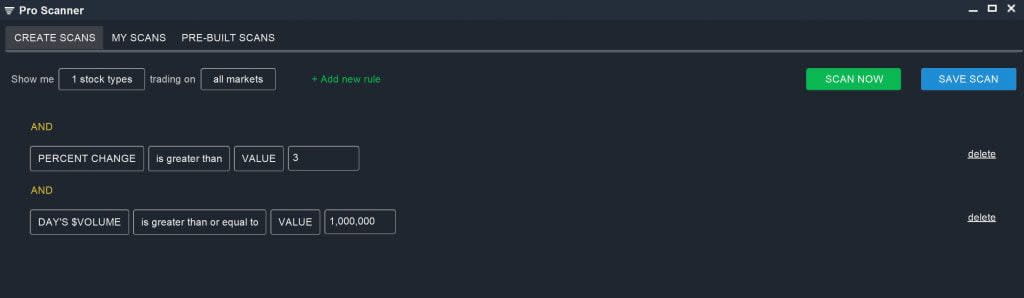
With the Pro Scanner, you can combine several of the parameters that we examined using the Easy Scanner. For example, you can create a scan that returns ETFs that are making significant gains for the day, but only those that have significant trading volume:
PERCENT CHANGE is greater than VALUE 3
AND
$VOLUME is greater than or equal to VALUE 1,000,000
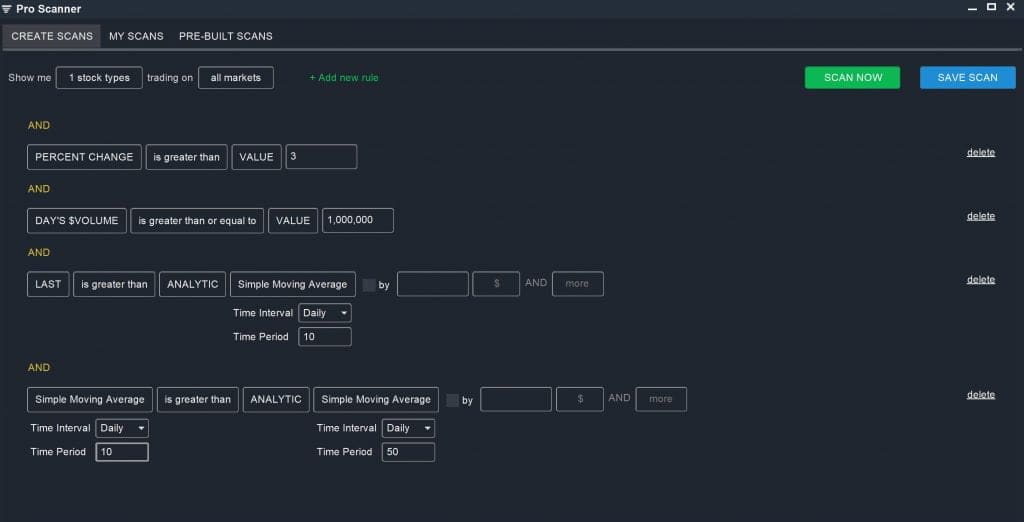
To further narrow your search to only those ETFs that are on the rise, you can also add in parameters that ensure the price is above the short-term moving average and the short-term moving average is healthy:
LAST is greater than ANALYTIC Simple Moving Average (Daily, 10)
AND
Simple Moving Average (Daily, 10) is greater than ANALYTIC (Daily, 50)
These are just a few examples of how you can build a fast and simple scan for high-performing ETFs using the Pro Scanner. Beware of using more complex technical studies in your screens, since the price of an ETF doesn’t typically respond to its own technical signals in the same way as an individual stock. Instead, it’s a good idea to focus on price trends when scanning for ETFs and to conduct any technical analyses on a target ETF’s largest holdings.
Conclusion
Trading ETFs allows you to get financial exposure to an entire asset class or market sector in a single trade, while simultaneously reducing your exposure to any single company and broadening your portfolio. When trading ETFs, it’s essential that you understand what an ETF contains and how it’s managed. The Easy Scanner and Pro Scanner each offer tools for homing in on potential ETFs to trade. Since ETFs generally reflect the price movements of their holdings, you’ll want to limit your scans to focus on price and liquidity rather than on technical studies.
Related Reading:
- Ultimate Guide to Technical Stock Screeners
- How to Use a Stock Screener
- Relative Volume Scanner: Confirm ETF Momentum
Ready to start scanning? Try for free and choose the plan that fits your workflow.