What is float rotation?
Float rotation is the number of times a stock’s float has traded in a session: today’s volume divided by the float. The float is the shares free to trade, all shares outstanding minus those held by insiders and other holders who cannot sell freely. A stock with a 2,000,000 share float that has traded 3,000,000 shares today has a rotation of 1.5.
The term comes from day trader Nate Michaud of Investors Underground, who described a full rotation as a “refresh” of the shareholders (TradingSim). Once the float has turned over, the people holding the stock are, on average, people who bought it today, at today’s prices. Their cost is near the current price, so they are quick to sell a drop and quick to buy a new high. That is why a rotating stock moves in big, fast steps in both directions.
Three readings cover most of what a trader needs:
- Under 0.5. Most of the float has not traded. A gain on that little volume can vanish when one holder decides to sell.
- 1. Every free share has, on average, changed hands once. The stock is among the day’s most-traded names for its size, and that is the line the scan and the signal on this page use.
- Several times. Everyone who wanted the stock has had a chance to buy, and many have already sold. The swings get wider, and the trade gets more crowded (HeyGoTrade calls high rotation “crowded participation”, which raises the risk of a reversal).
Why the first full rotation matters
Rotation is a measure of attention, not of direction. A stock can trade its float ten times and close at the low. What 1× tells you is that the move has real participation: it is not a thin stock drifting up on a few hundred trades, where one seller can erase the gain.
So traders use the first full rotation as confirmation, not as an entry. The play most of them describe is a long on the next break: once the float has turned over and the stock is holding above VWAP, they buy a break of the day’s high on volume (Timothy Sykes frames the entry as a “breakout above previous highs with strong volume”). The rules card below turns that into exact levels.
How do you scan for float rotation?
Most scanners show float and volume and leave the division to you. Scanz computes float rotation as a filter, a column and a signal event, so the list below only holds stocks that have already traded their float today.
The scan · Data Scanner · Regular hours, 9:30 am–4:00 pm ET
Float Rotation
| Rule | Setting | Why it's there |
|---|---|---|
| Float Rotation (Regular Hours) | ≥ 1 in your copy (the Discover card ships at 100, which reads as 100 times the float) | Volume today is at least the whole float: the attention the play needs. |
| Percent Change (Regular Hours) | ≥ 5% vs the previous close | Rotation counts selling as much as buying. The gain keeps the list to stocks being bought. |
| Volume (Regular Hours) | ≥ 250,000 shares | A tiny float can rotate on a few thousand shares. A floor of 250,000 leaves out stocks you could not get in and out of. |
The template has no float limit and no price floor. A large float almost never rotates, so in practice the list is low floats; to make that explicit, add Float ≤ 20,000,000 and Last Price ≥ 1 to your copy. Every rule reads regular-hours data, so the list is empty before 9:30 am ET.
7 days of Pro free, card required: this list and the Float Rotation Trigger signal with a sound. After day 7 it renews on the plan chosen at sign-up, Starter at $89/month or Pro at $199/month, unless you cancel in the app.
Get told when it happens. The list shows stocks that are already past 1×. To hear the moment a stock crosses it, copy Float Rotation Trigger from Discover’s Signal Scanner templates (Momentum Signals). It fires when a stock’s regular-hours volume passes its float, priced $1 or more, and you can give it a sound (Signals guide).
The scan · Signal Scanner · Regular hours
Float Rotation Trigger
| Rule | Setting | Why it's there |
|---|---|---|
| Signal | Float Rotation crosses 1× the float (Regular Hours) | Fires at the crossing: the moment the stock has traded its float, not an hour later when you next look at the list. |
| Last Price | ≥ $1 | Leaves out sub-dollar stocks, where one cent is a large slice of the price and the spread eats the move. |
The ratio can be changed in your copy, from 0.25 to 10 times the float: 0.5 for an earlier warning, 2 for the second rotation.
Settings to change, and when
| Change | When | What it costs |
|---|---|---|
| Add Float ≤ 20,000,000 | Always, if you only trade low floats | Little: a larger float that rotates is usually a sub-dollar stock |
| Add Float ≤ 5,000,000 | You want the fastest movers only | Fewer names; more halts and wider spreads |
| Raise % Change to 20 | A busy day with a long list | Misses the stock that rotates early and is up only 8% |
| Raise Volume to 1,000,000 | You trade size | Leaves out the sub-1 million floats almost entirely |
| Trigger ratio 0.5 | You want to watch it build | Earlier, and more false starts |
Where else to read it
Scanz shows rotation in two other places. Any scan can carry a Float Rotation column (+ Add column; it sits with Float and Percent Float in the Capital Structure filters, see the filter reference). And every Montage’s stats panel shows ROTATION beside FLOAT and % FLOAT. Read ROTATION as a multiple: 9.06 means the float has traded 9.06 times. % FLOAT is the float as a share of all shares outstanding, not short interest.
What are the entry, stop and exit rules?
The setup on one card
- In play
- Float Rotation Trigger has fired, or the stock is on the Float Rotation list, and it is above VWAP
- Time window
- No entry in the first five minutes (9:30–9:35 am ET); no new trade after 3:30 pm ET
- Level
- The day's high, as it stands after the float has traded once
- Setup
- A pullback from the high that holds: no 5-minute close under VWAP, and at least two bars that do not make a lower low
- Trigger
- A 5-minute bar closes above the level on more volume than the pullback's average bar
- Entry
- At the close of the trigger bar
- Stop
- Under the pullback's low. Shares = the dollars you will risk ÷ the distance from the entry to the stop
- Exits
- Half off at 1R. Trail the rest under each higher 5-minute low. Everything off by 3:55 pm ET
- Attempts
- Two a stock a day. After a stop, wait for a new pullback under the new high
- Skip it when
- It is under $1; the spread is more than a tenth of the risk; the stop is more than one pause band away (10% over $3, 20% from $0.75 to $3); an offering or registration filing is out today; the float in Scanz looks out of date
Why each rule is there
- Above VWAP. VWAP is the average price paid today. Once the float has rotated, most holders bought today, so above VWAP the average share bought today is in profit; under it, the average buyer is losing and every bounce meets sellers (VWAP guide).
- The day’s high after the first rotation. It is the price the most eager of today’s buyers paid. A close above it means their supply has been absorbed.
- A pullback first. Buying the crossing itself means buying a stock that has just run. The pullback shows whether today’s buyers hold or sell, and it gives the stop a place to go.
- A close, on more volume. Low floats poke through a level and fall back inside the bar. The close shows it held; the volume shows more traders bought the break than sold the pullback.
- Half at 1R. Rotating stocks reverse as fast as they rise. Once half is banked at 1R, the rest going back to the original stop leaves the trade at breakeven.
- The pause band. Under the Limit Up-Limit Down plan, a stock that sits at its band for 15 seconds is paused for five minutes: the band is 10% around the last five minutes’ average price for most stocks over $3, and 20% from $0.75 to $3 (LULD plan). A stop wider than one band can be jumped by a reopen.
- No offering today. New shares are usually sold below the market, and a rotating stock is exactly what they get sold into.
What did float rotation look like on November 20, 2026?
Here is the scan live at 12:07 pm ET on Friday, November 20, 2026, copied from Discover with Float Rotation set to 1, and with columns added for the day’s change, volume and float.
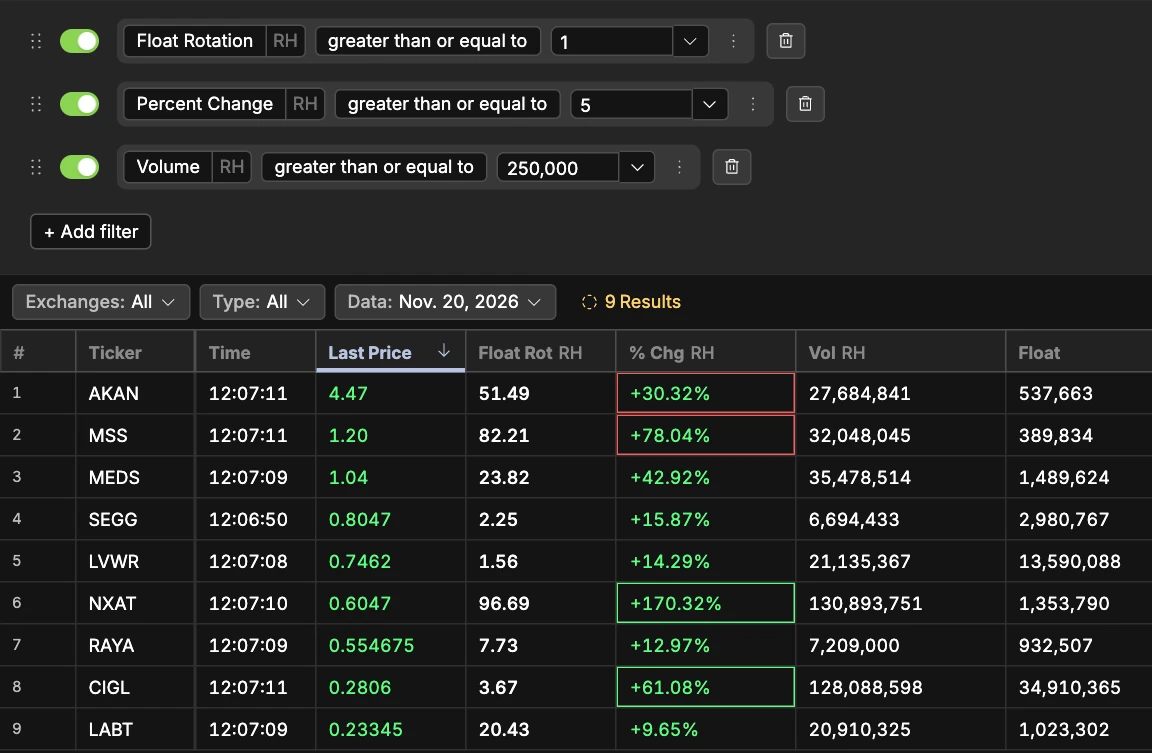
| Stock | Last | Change (RH) | Rotation | Float in Scanz | Pre-market high |
|---|---|---|---|---|---|
| AKAN | $4.47 | +30.32% | 51.49 | 537,663 | $5.60 |
| MSS | $1.20 | +78.04% | 82.21 | 389,834 | $0.855 |
| MEDS | $1.04 | +42.92% | 23.82 | 1,489,624 | $1.23 |
| SEGG | $0.8047 | +15.87% | 2.25 | 2,980,767 | $0.9763 |
| LVWR | $0.7462 | +14.29% | 1.56 | 13,590,088 | not on the gap list |
| NXAT | $0.6047 | +170.32% | 96.69 | 1,353,790 | $2.19 |
| RAYA | $0.5547 | +12.97% | 7.73 | 932,507 | $1.08 |
| CIGL | $0.2806 | +61.08% | 3.67 | 34,910,365 | not on the gap list |
| LABT | $0.2335 | +9.65% | 20.43 | 1,023,302 | $0.2981 |
Pre-market highs are from the True Gap 5%+ template at 11:59 am ET, which lists stocks that opened 5% or more above the previous close; LVWR and CIGL did not, and rotated anyway.
What the list says before any trade:
- Rotation is not direction. NXAT had traded its float almost 97 times and was up 170%, and it was still 72% under its $2.19 pre-market high. MSS, at 82 times, was the only stock on the list above its pre-market high.
- Most rotating stocks are under $1. Six of the nine were. The Float Rotation Trigger’s $1 rule drops them; the scan does not, which is why the setup steps add Last Price ≥ 1.
- The card keeps one. Of the three at $1 or more, the 5-minute charts at about 12:10 pm showed AKAN ($4.56) and MEDS ($1.035) under VWAP. Only MSS, at $1.20, was above it, as it had been since about 10:40.
- A larger float can rotate, cheaply. CIGL turned over a 34.9 million share float 3.67 times on 128 million shares, at 28 cents.
- The floats are tiny, and worth checking. Seven of the nine floats were under 3 million shares. Floats that small are the ones most often out of date after a reverse split or an offering (see when it fails), and a stale float makes every rotation above too high.
MSS through the card
MSS (Maison Solutions) closed at $0.674 on November 19 and opened at $0.8072. With a float of 389,834 shares, it had traded its float many times over by mid-morning (32.5 million shares by 12:10 pm), so the Trigger’s moment came early and the card’s work was the pullbacks after it.
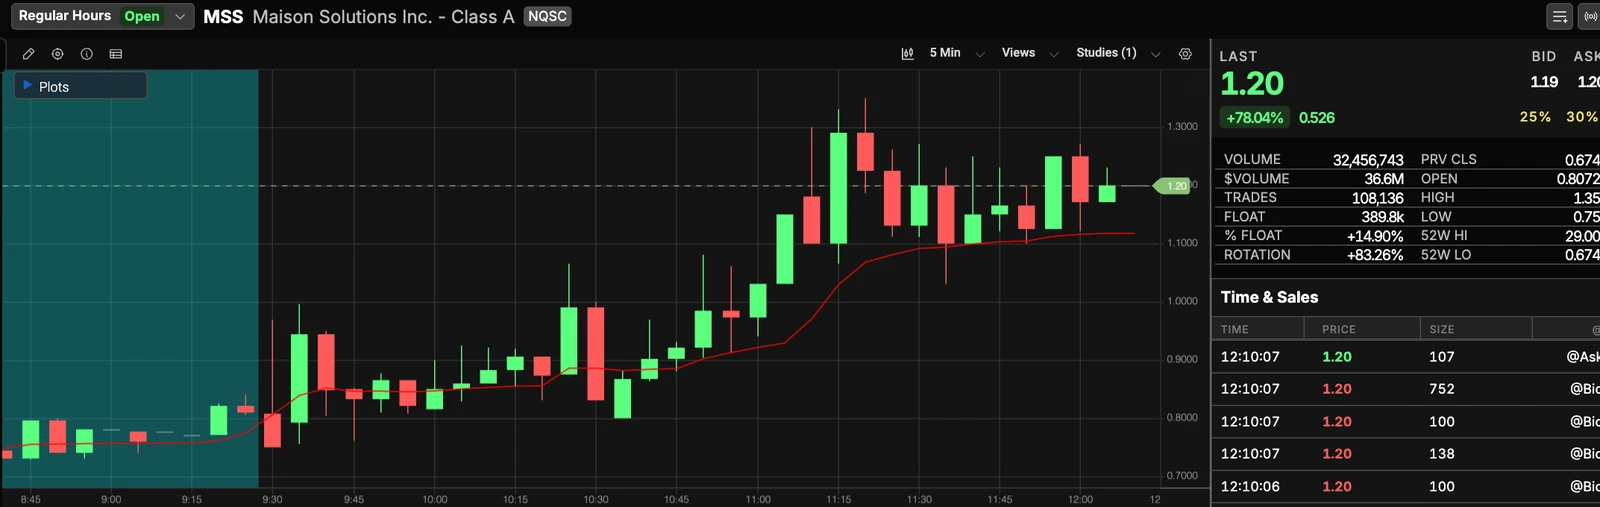
Prices below are read off that chart, so treat them as accurate to a cent or two. The chart shows no volume bars, so the trigger’s volume condition could not be checked.
| Time (ET) | What MSS did | What the card said |
|---|---|---|
| 9:30–10:20 | Low of the day, $0.75, in the first bar; a wick near $1.00 at 9:35; then a range of about $0.80 to $0.95, around VWAP | Rotated, but no clean pullback above VWAP. No trade. |
| 10:25 | Spiked to about $1.06 and closed near $0.99 | New high of day: the level is now about $1.06. |
| 10:30–10:35 | Fell to about $0.80, closing under VWAP (about $0.89) | The pullback failed the VWAP rule. Wait for a new one. |
| 10:40–10:45 | Closed back above VWAP, about $0.90 and $0.92 | A new pullback can form. |
| 10:50–11:00 | Wicked to about $1.08 (the new high), then held about $0.92 to $1.03 above VWAP | Level: about $1.08. Pullback low: about $0.915. |
| 11:05 | Closed near $1.15, above the level | Trigger, if the bar’s volume beat the pullback’s. Entry about $1.15, stop under $0.915: about 21% of the price. |
| 11:10–11:20 | Ran to the day’s high, $1.35 | 1R would have been about $1.39: not reached. |
| 11:25–12:10 | Back to about $1.10 to $1.20, VWAP rising to about $1.12 |
The card passes on this one, and the reason is the size rule: a stop 21% away is wider than the 20% pause band for a stock between $0.75 and $3, so one five-minute halt could have reopened the stock through the stop. A trader who took it anyway saw the stock rise about 17% without reaching 1R, and the trail under each higher 5-minute low would have taken the position out near the entry when the stock slipped back at 11:25. That is the honest picture of the setup on a sub-1 million share float: the right stock, a clean trigger, and a risk too wide for the rules.
Variations
The early entry: 0.5×
Set the trigger to 0.5 and you hear about the stock while half its float has traded. Some traders buy here, before the crowd’s alert at 1×. The rules are the same, with one change: the stock has to be above VWAP and making new highs when the alert fires, because at half a rotation one large seller can still turn it. Expect more alerts and more failures.
Pre-market rotation
A stock can trade its float before the bell. Traders who scan the pre-market treat a float that has rotated several times by 9:00 am ET as the morning’s main name, and some look for multiples well above 1 before they pay attention at all (StocksToTrade uses about 9 to 10 times before the open). The Float Rotation template reads regular hours only. To watch the pre-market, copy it and switch the Float Rotation, Percent Change and Volume rules to the Pre-Market session. The rules card still waits for 9:35: the open is where pre-market buyers sell.
The second and third rotation
Past 2× the move is crowded. Many who bought the first leg have sold, and the stock swings wider each time. Traders who keep trading it take only pullbacks that hold above VWAP, with smaller size, and stop adding once a new high comes on less volume than the last one. The trigger can be copied a second time at 2 to tell you when the second rotation completes.
A larger float
A 20 million share float that rotates needs 20 million shares of volume, which takes a real catalyst: earnings, an FDA decision, a buyout. These rotate later in the day and move less, but the spreads are tighter and halts are rarer. The card works the same; the 1R target is usually closer.
The fade
Some traders short a rotating stock once it fails: several rotations, a lower high, and a close under VWAP. It is a different trade with different risks. Borrow on a low float is scarce and can vanish, and a squeeze or a halt can gap the price through a stop. Scanz has no borrow data, so check with your broker first. This page does not give rules for it.
When does float rotation fail?
The float is wrong. This is the one to know. Float is not reported every day: it is worked out from the company’s last report, and Scanz does not yet count shares the company has filed since. After an offering, a share sale under an at-the-market program, a note conversion or a reverse split, the float on your screen can be several times smaller than the real one, and the rotation several times too high. On November 5, 2026 Scanz showed AEHL’s float as 196,957 shares; its October 22 prospectus supplement counted 18,764,856 shares outstanding (low float guide). Before you trust a rotation under a 2 million share float, check the latest 10-Q or 424B on EDGAR and see whether the share count agrees.
Rotation without price. Volume counts sellers too. A stock can trade its float many times while going nowhere: on November 5, 2026 FLYE traded its 1.46 million share float 9 times in regular hours and closed 17% under its open. The card needs price above VWAP and a new high, not just volume.
An offering into the run. A company with a shelf registration can sell shares into the rally that the rotation shows. The run often ends with the filing.
A halt. A thin float can hit its pause band in seconds, and a stop fills at the reopen, not at its price. Scanz has no halt data; on a 5-minute chart a pause shows as a bar with no trades.
Late in the day. Rotation only rises as the day goes on, so a stock that crosses 1× at 2:30 pm has done it on a full day’s volume, not on a burst. The template’s own notes say more stocks qualify after late morning. Fewer of them have a move left.
The checklist before you take the trade
Before the trigger
- Has Float Rotation Trigger fired, or is the stock on the Float Rotation list?
- Is it above VWAP?
- Is it between 9:35 am and 3:30 pm ET?
- Have you marked the day's high as it stood after the float traded once?
- Did the pullback hold, with no 5-minute close under VWAP and two bars without a lower low?
- Did a 5-minute bar close above the high on more volume than the pullback's average bar?
- Is the stop under the pullback low, and inside one pause band?
- Is the share count your dollar risk divided by the distance to the stop?
- Is the spread under a tenth of the risk?
- No offering or registration filing out today, and does the float agree with the latest filing?
- Is this your first or second attempt on this stock today?
Set it up
- Start the 7-day free trial of Pro (card required).
- In Discover, set Templates for to Data Scanner, open Low Float & Squeeze and click Use template on Float Rotation. The copy lands in My Scans.
- In your copy, set Float Rotation to 1, add Float ≤ 20,000,000 and Last Price ≥ 1, and add a VWAP column.
- Set Templates for to Signal Scanner, open Momentum Signals and click Use template on Float Rotation Trigger. Give it a sound.
- When it fires, open the stock’s chart and mark the day’s high.
After day 7 the trial renews on the plan chosen at sign-up, Starter at $89/month or Pro at $199/month, unless you cancel. Starter keeps one Data scan and one Signal scan.
Questions traders ask
How do you calculate float rotation?
Divide today's volume by the float. A stock with a 4 million share float that has traded 10 million shares has rotated 2.5 times. Use the same session for both: Scanz's Float Rotation (Regular Hours) counts only regular-hours volume.
What is a good float rotation for day trading?
1× is the line most traders use: volume equal to the whole float. Some want 2 to 5 times before they call a move strong. The number tells you how much attention a stock has, not where it goes next, so the rules on this page also need price above VWAP and a new high.
Is high float rotation bullish or bearish?
Neither on its own. It means the stock is crowded. At 12:07 pm ET on November 20, 2026 NXAT had traded its float almost 97 times and sat 72% under its pre-market high, while MSS, at 82 times, was the one rotating stock above its own.
Who came up with float rotation?
TradingSim credits Nate Michaud of Investors Underground, who described a full rotation as a refresh of the shareholders: once the float has turned over, most holders bought today.
Why does my float rotation differ from another site's?
Because the float does. Float is worked out from filings, and data providers subtract different holders and update at different times. After an offering or a reverse split the figures can differ several times over. Check the latest filing on EDGAR when it matters.
Can you scan for float rotation pre-market?
Yes, by switching the rules to the Pre-Market session in your copy of the Float Rotation template. The template as it ships reads regular hours only, so it lists nothing before 9:30 am ET.