Scanning for block trades allows you to spot when institutional investors are moving large sums of money into or out of a stock. By following institutional money, it’s possible to get in on the ground floor of a significant price movement. Let’s take a closer look at what block trades are and how you can spot them using Scanz.
What is a Block Trade?
A block trade is a single large stock purchase or sale of 10,0000 shares or more. Block trades are typically executed by institutional investing firms when they want to take a large position in a stock without moving the price as a result of their own activity.
When a firm places a block trade, it typically won’t buy or sell the stock directly. Instead, the firm will approach a blockhouse, which is a specialized broker that can arrange one or more buyer or sellers for the volume of stock desired. The firm can then buy or sell the shares outside of the open market, or arrange for a series of smaller agreed-upon trades that won’t have as much of an impact on the stock’s market price.
Block trades matter to traders because they can signal that analysts at a major investment firm – who have far more analytical tools and data access than most retail investors – have seen something in a stock. Often, traders will respond to block trades even if the rationale behind the original trade remains unknown. So, a block buy by a well-known firm can cause a significant amount of follow-on buying activity that pushes up the price even more. By scanning for block buys, you can spot these opportunities as soon as they happen to get in before the follow-on trading really takes off.
Finding Block Trades with the Breakouts Module
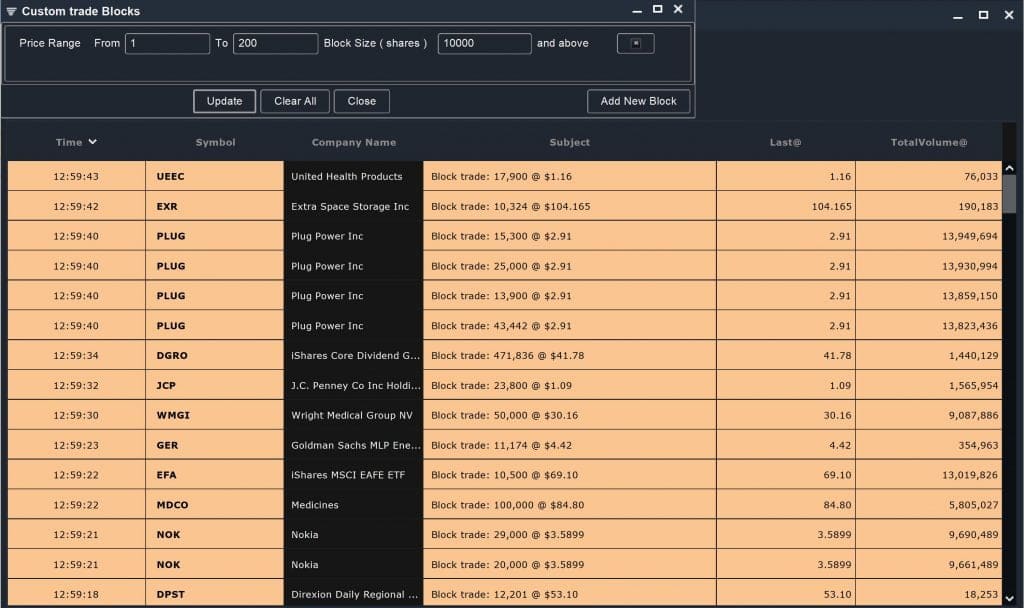
The easiest way to scan for block trades in Scanz is to use the Breakouts module. The Block Trades filter allows you to instantly spot block trades that are reported anywhere across the market. When using this filter, it’s important to specify price and volume thresholds. You’re not limited to looking for only trades of 10,000 shares or more – you can adjust the threshold to find high-volume trades that were placed directly on the open market or institutional trades that are much larger in size.
Using Level 2 Data to Find Block Trades
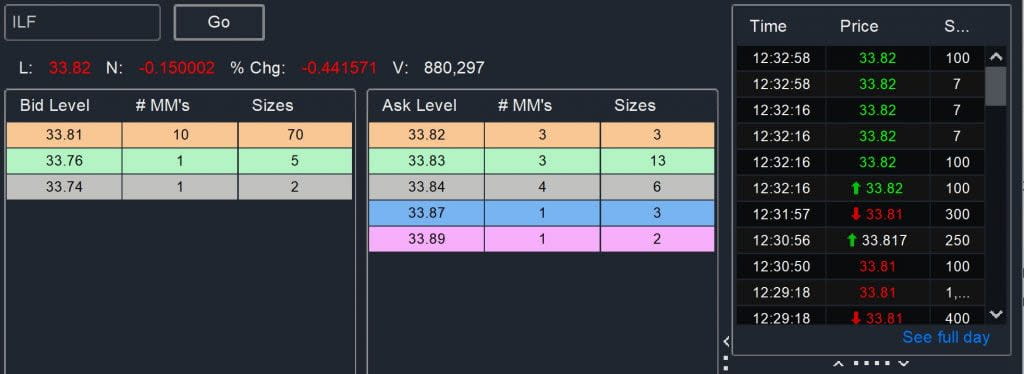
Since Scanz supports Level 2 data, you can also look through an individual stock’s trading history to find block trades. Open up the Level 2 module, search for a stock of interest, and click on “See full day” beneath the trade log.
This will open up the Time and Sales window, where you can load data about all trades conducted within specific one-hour time windows. Better yet, you can filter this trade data by volume.
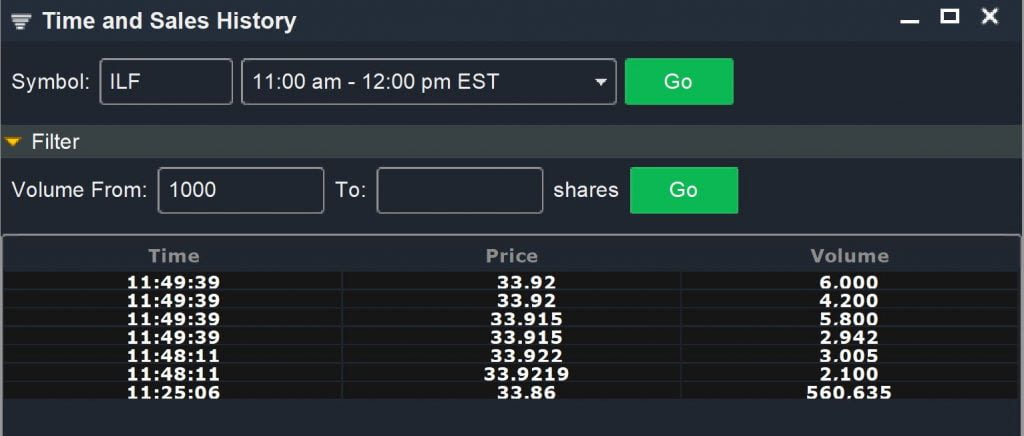
This makes it extremely easy to spot block trades or other mid-volume trades, especially for stocks that trade with relatively low liquidity since these won’t show up in the Breakouts module with any frequency. Once you have the time stamp of the trade, you can also use the Level 2 data to see how other traders responded to the block trade.
Conclusion
Scanning for block trades is a good way to keep tabs on what institutional investors are trading. Combined with additional scans, such as for swing trading opportunities, you can use block trades to highlight potentially profitable trades or catch trends before they take off. The Breakouts module allows you to scan the entire market for block trades, while you can monitor Level 2 data in Scanz to watch for large-volume trades of a specific stock.
Related Reading:
Ready to start scanning? Try for free and choose the plan that fits your workflow.