Introduction To Short Squeezes
A short squeeze is a very profitable setup if your entry and exits are timed correctly. But, the key to getting in on the ground floor of a short squeeze is to spot it before it happens. You need to be ready to take advantage of the situation as soon as a bullish catalyst sets off the squeeze.
Let’s take a closer look at short squeezes and how you can scan for potential setups using Scanz.
What is a Short Squeeze?
A short squeeze occurs because short sellers get skittish when it looks like their short bets may prove wrong. Short sellers face unlimited risk if they turn out to be wrong and a stock’s price rises. Not only that, but short sellers will also start getting margin calls from their brokers as their short goes bad.
The easiest way for short sellers to cut their losses and answer their margin call is to simply close their trade. In a short, that means buying back the stock to cover the shares they borrowed and sold.
But, sometimes there simply aren’t enough shares to go around for all the short sellers who want to buy back the stock. That drives up demand, which in turn creates a lot of buying pressure and a sudden jump in the price of a stock. This creates something of a snowball effect – short sellers buy up the stock and drive up its price, thus forcing other short sellers to do the same thing to limit their own losses. A short squeeze can turn what might have started as a gain of several percent into a gain of 10% or more in a single day.
When trading a short squeeze, the goal is to get at the start of the bullish activity, before the majority of short sellers have been able to cover their positions and demand for the stock fades. To get the timing right, you need to know that a short squeeze might be coming.
Identifying Short Squeeze Setups
So, how do you identify potential short squeeze setups?
It starts with finding stocks that have a lot of shares being shorted. The number of shares short can be measured directly, but it’s also helpful to think of it as a fraction of the average daily volume of shares being traded. For example, if a stock has 100,000 shares short, but only an average of 20,000 shares traded per day, it would theoretically take short sellers five days to cover all of the short positions.
This is important because the higher the ratio of short shares to shares typically traded, the higher the demand for the stock will be among short sellers once the price starts rising. Typically, you’ll want to look for stocks where the number of shares short is at least five times the average daily volume. Ideally, the number of shares short should also make up a significant fraction of all the available shares – 10% or more.
The other thing to consider is whether the number of shares being shorted is increasing or decreasing. If shorts are being covered before a squeeze develops, the situation can defuse itself without a sudden spike in demand. If the number of shorts is continuing to increase even as it would take five days or more to cover all of the short positions, that’s a good sign that a short squeeze may be looming.
Scanning for a Short Squeeze
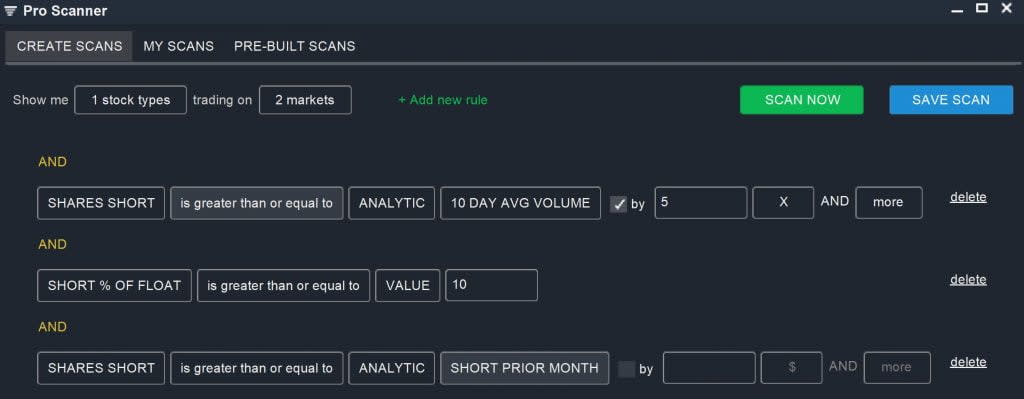
It’s easy to turn those guidelines into scanner parameters using Scanz. Essentially, there are three conditions that must be fulfilled:
- The number of shares short should be greater than five times the average daily volume
- The shares short as a percentage of the float should be greater than 10%
- The number of shares short should be increasing
In the Pro Scanner, there are a series of short-related parameters under Fundamentals > Short Interest. We can define the conditions above using three rules:
SHARES SHORT is greater than or equal to ANALYTIC 10 DAY AVERAGE VOLUME by 5 X AND more
AND
SHORT % OF FLOAT is greater than or equal to VALUE 10
AND
SHARES SHORT is greater than or equal to ANALYTIC SHORT PRIOR MONTH
This scan will help you find stocks that may be potential candidates for short squeezes. This doesn’t guarantee that a short squeeze is occurring. Our goal is to build a watch list of these types of stocks so we can have them on our radars in case they start making moves.
Bullish Catalyst
A short squeeze setup typically requires a catalyst of some kind to turn into a short squeeze in action. Remember, as long as the stock is continuing to trend downward or flat, it’s possible that the short sellers were right about the negative price trajectory and that no squeeze will develop.
The bullish catalyst can come from news or from an earnings report, but it can also be foreshadowed by technical indicators. Momentum indicators like RSI, MACD, and stochastics can be extremely valuable in trying to predict whether and when a short squeeze will develop. If you’re looking for a short squeeze that is not just developing, but imminently occurring, you may want add filters for price change, such as percent change or current price relative to prior highs.
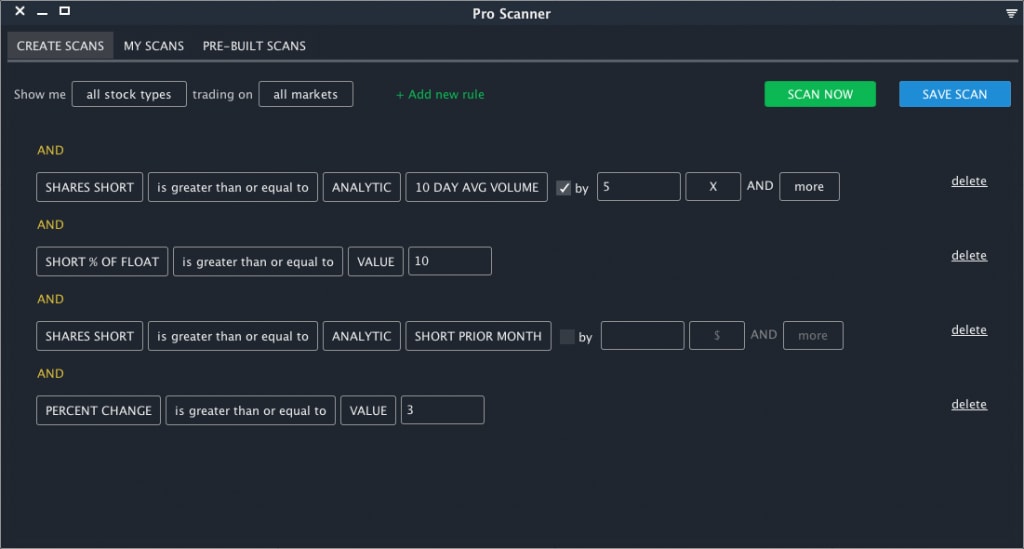
Short squeezes typically result in large price movements, so you can couple your short squeeze scan with an intraday price rise greater than 5% or more. You may need to adjust your short shares cutoffs, since a squeeze will shed short shares once it is underway. Make sure when chasing an active squeeze that you don’t buy in near the end of the squeeze, after which prices may fall as demand slumps.
Profiting Off Short Squeezes Using Scanz
The Pro Scanner allows you to easily search for short squeeze setups, which you can then monitor for bullish signals that will spark widespread buying activity. You can easily adapt the basic short squeeze scan to look for stocks that are already showing signs of bullish momentum. Beware that short squeezes happen quickly, so you’ll need to closely monitor prospective stocks and ensure that you don’t chase a squeeze too long after it has started.
More Scans for Short Sellers
Related Reading:
Ready to start scanning? Try for free and choose the plan that fits your workflow.