Trend following is one of the most basic, and yet most profitable strategies that traders can use when the market is going strong. With the trend following, you profit simply by jumping on the bandwagon with other traders.
How can you use Scanz to identify trend following opportunities and profit from this strategy? In this guide, we’ll explain how trend following works and how you can set up the Pro Scanner to find strong trends.
What is a Trend Following Strategy?
With a trend following strategy, your goal as a trader is to find a strongly trending stock and then jump aboard for the ride. Trend following has a lot in common with momentum trading – you look for stocks that have momentum behind them and then open a position in the direction of the ongoing movement.
The big difference between trend following and momentum trading is that trend following is backwards looking while momentum trading is forward looking. Momentum traders use a variety of leading indicators and financial reports to try to predict where a stock will be next, rather than necessarily looking at where it has been recently. Trend traders, on the other hand, use lagging indicators that de-noise recent price data to reveal the overarching trend. Trend identification and interpretation is often far less subjective than interpreting forward momentum indicators.
Of course, momentum trading and trend following can co-exist peacefully. Many trend traders take leading momentum indicators into account when trying to determine whether an existing trend will continue at its current strength.
What Indicators are Used for Trend Following Strategies?
Trend traders typically look at four commonly used technical indicators:
Moving Averages
Moving averages are the darlings of trend following strategies. They are not only lagging indicators that are relatively easy to understand and implement, but they are extremely simple to interpret. If a moving average is increasing over time, the price has generally gone up over the period of the moving average. If a short-term moving average has gone up by more than a long-term moving average, price action has been more bullish recently than over the past few weeks or months on an average basis.
MACD
The moving average convergence-divergence (MACD) indicator builds on the properties of moving averages by comparing two moving averages with offset time intervals. While the MACD can be used to generate trading signals for momentum traders, it can also provide information about short- and medium-term trends. In general, if the MACD line is positive for a long time, it means that prices have generally gone up – even if the MACD histogram (the difference between the shorter- and longer-term moving averages) is negative.
RSI
The relative strength index (RSI) offers information about whether a stock is overbought or oversold relative to recent price conditions. During strong trends, the RSI will often be above 70 – which is generally considered overbought – or below 30 – which is generally considered oversold. The RSI is most useful for identifying entry points in the middle of a trend. For example, you can purchase shares when the index pulls back below 70 on a dip, if all other signals indicate that the existing long-term trend will continue.
Money Flow Index
The money flow index tallies up the cumulative buying and selling pressure around a stock by increasing on bullish days and decreasing on bearish days. In general, on-balance volume should move in the same direction as the price in order to confirm a trend. This is a key indicator for trend following strategies, as it serves to provide secondary information to price movements and can warn of an impending trend reversal.
How to Set Up the Pro Scanner for Trend Following
You can easily spot trends and identify trading opportunities using the Pro Scanner in Scanz. Here, we’ll show you how to set up the scanner to identify strong trends and illustrate two potential modifications to find buying opportunities.
Finding Trend Setups
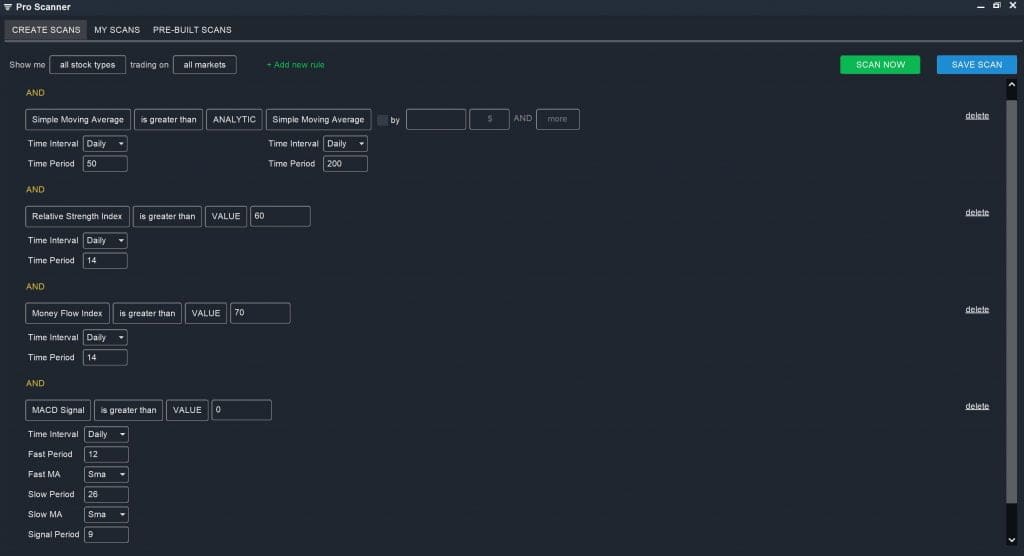
The first thing you need to do to create a trend following screener is to create a trending finding stock screen. We’ll use the same trend indicators that we described above:
Simple Moving Average (Daily, 50) is greater than ANALYTIC Simple Moving Average (Daily, 200)
AND
Relative Strength Index (Daily, 14) is greater than VALUE 60
AND
Money Flow Index (Daily, 14) is greater than VALUE 70
AND
MACD Signal is greater than VALUE 0
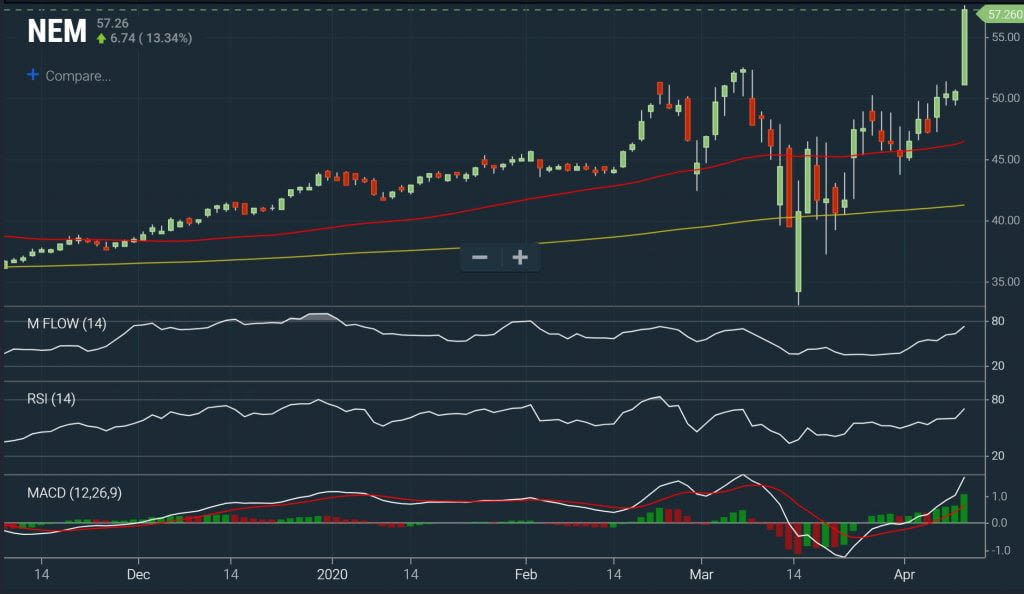
This scan limits your results to stocks that are pointed up. Make sure to check the chart, though, to ensure that the trend is a long-term one since short-term jumps in price can also influence the RSI and MACD.
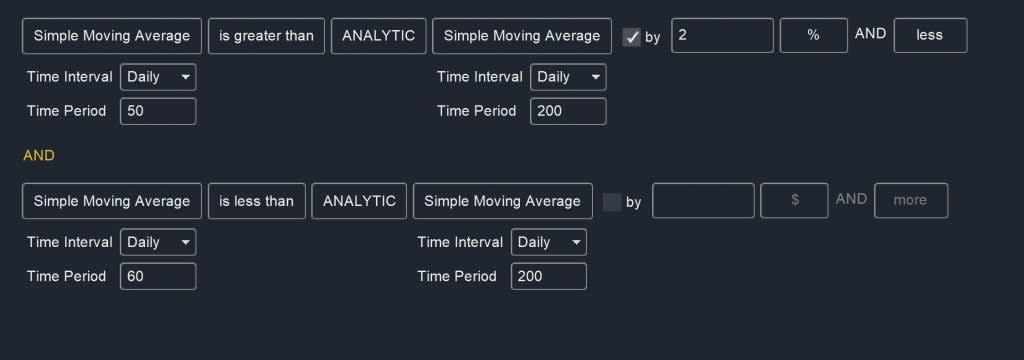
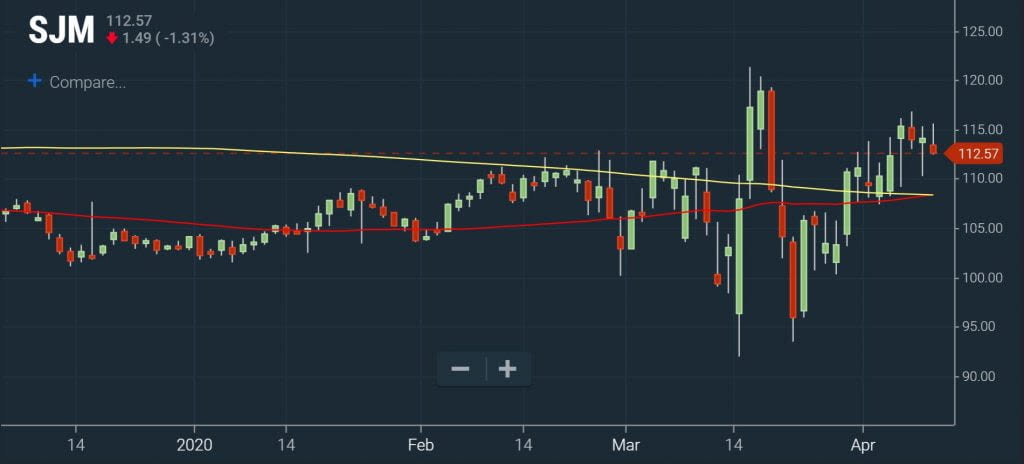
Moving Average Crossover
Now, we’ll take that same trend discovery screen, but modify it slightly to look for buying opportunities. In this case, instead of looking for a short-term moving average stacked on top of a long-term moving average, we’ll look for moments when they are crossing. This is generally a very bullish sign that occurs early in the development of a trend.
Simple Moving Average (Daily, 50) is greater than ANALYTIC Simple Moving Average (Daily, 200) by 2% AND Less
AND
Simple Moving Average (Daily, 60) is less than ANALYTIC Simple Moving Average (Daily, 200)
This combination of parameters ensures that we’re only screening for recent moving average crossovers.
RSI Pullback
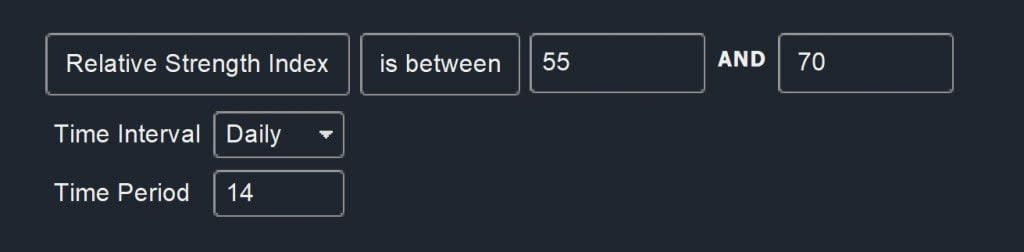
Another potential buying opportunity for trend followers occurs when the RSI pulls mildly back on a price dip. You can look for this by screening for a trend as above, but limiting your search to stocks with an RSI between 55 and 70:
Relative Strength Index is between VALUE 55 AND 70
Conclusion
Trend following is a relatively straightforward strategy that any trader can use to make gains over the long term. In contrast to momentum trading, trend following relies heavily on lagging indicators that are much less subjective to interpret. With the Scanz Pro Scanner, you can easily identify strong trend setups and create custom screens for opportunities to buy into these trends at bargain prices.