The majority of traders are familiar with candlestick charts, which show the high, low, open, and close for each time interval. Candlesticks are so well used that there is even a wide range of technical signals based entirely on candlestick patterns.
But, candlesticks aren’t the only option traders have for looking at price movements. In this article, we’ll take a look at four alternatives to the standard candlestick chart and explain how they can help your trading.
Heikin-Ashi Charts
Heikin-Ashi charts look a lot like standard candlestick charts at first glance. They feature vertical bars with lines on the top and bottom. But, the way that the bars are calculated differs somewhat from how a candlestick bar is calculated.
In a Heikin-Ashi chart, the four components of each bar are calculated as follows:
Close = ¼ x (Open + Close + High + Low)
Open = ½ x (Previous Bar Open + Previous Bar Close)
High = Maximum of High, Open, or Close
Low = Minimum of Low, Open, or Close
This bar formation means that the open of every Heikin-Ashi bar is at the average of the previous bar. In addition, the close essentially represents the price average of the current bar. Importantly, the price displayed by a Heikin-Ashi bar is not necessarily the actual trading price of the underlying stock.
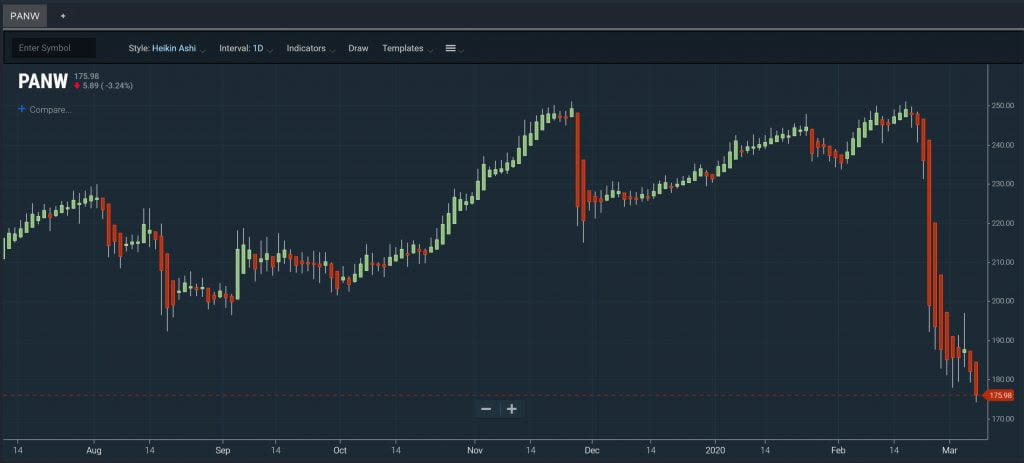
Essentially, Heikin-Ashi bars display averages of current price movements and are not a susceptible to false signals as traditional candlesticks. During an uptrend, it’s more likely that Heikin-Ashi bars will remain positive; during a downtrend, it’s more likely that the bars will remain negative. At the same time, when there is sideways price movement, Heikin-Ashi bars will become smaller in their vertical span.
So, Heikin-Ashi charts can be very useful for spotting market trends and reducing the noise from traditional candlesticks. However, traders need to be careful to check the actual stock price before placing trades, since it is not necessarily reflected by the current bar.
Line Charts
Line charts are extremely simple – they display a line that connects the closing price at each time interval on the chart. Line charts don’t offer a lot of detail, since there’s no information about opening, low, or high prices.
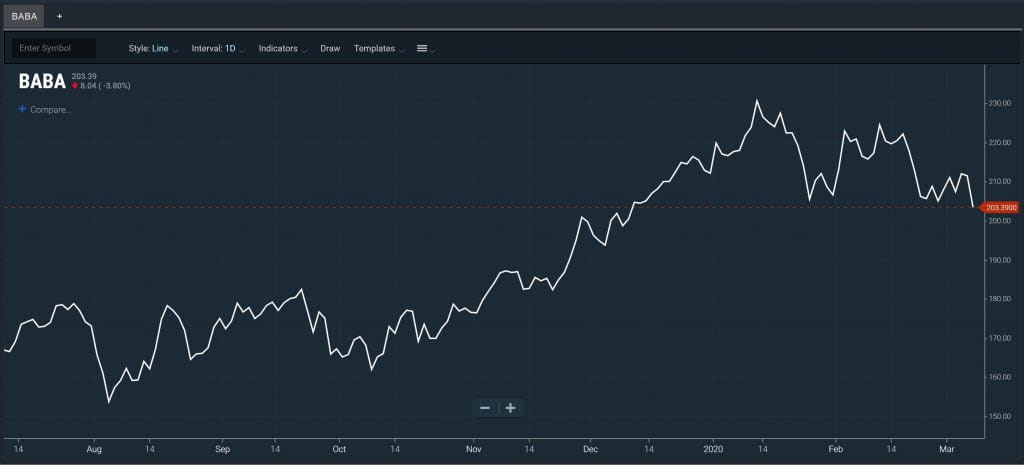
But, that simplicity can be an advantage in some cases. Drawing a trendline on a candlestick chart can be like throwing darts because of all the potential price points to use. But, on a line chart, it can be much easier to identify triangle patterns or head and shoulders patterns. Line charts are also useful for looking at long-term trends, when intra-interval highs and lows aren’t as important to your analysis.
Equivolume Charts
Equivolume charts calculate open and close in the same way as standard candlestick charts, but the size of each bar is proportional to trading volume. When trading volume is high during a given interval, the bar will expand horizontally. Narrow bars indicate that trading volume is low.
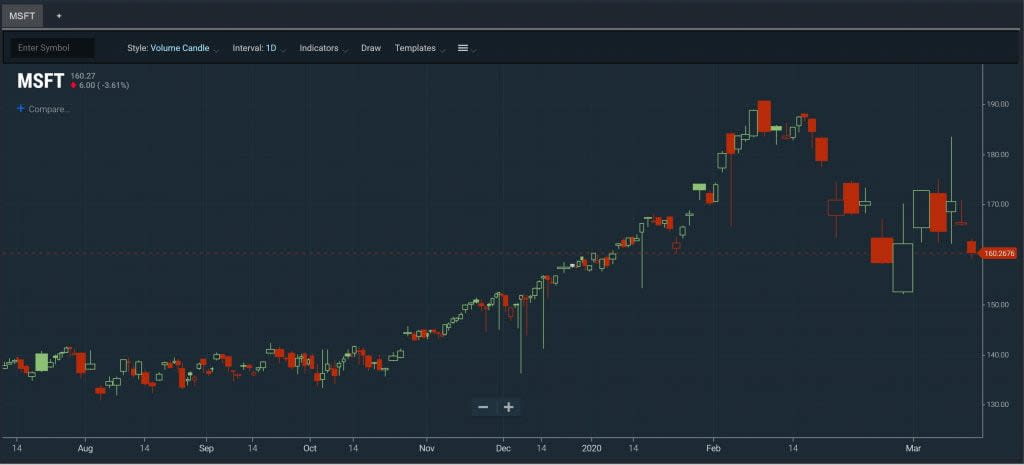
When using equivolume charts, it’s important to understand how volume is calculated. Typically, volume per bar is normalized according to a lookback period. The lookback period can be several days on an intraday chart or several months on a daily chart.
The advantage of using an equivolume chart is that you can easily spot high-volume trading events like breakouts. They appear on the chart as very wide bars. This allows traders to quickly sense whether a breakout above resistance or below support is likely to be sustained. On the other hand, when a big price movement is formed with a narrow (low volume) bar, it may indicate that the move will not be supported and that a reversal is looming.
Range Bar Charts
An inherent characteristic of all the chart types we’ve looked at so far is that individual bars are delineated by a set time interval. But, with a range bar chart, you can eliminate the dependence of your technical chart on time.
In a range bar chart, each bar closes and a new bar begins when the difference between the open and close has reached a set price range. As a result, every bar has the same price range and every bar closes at either its high or low.
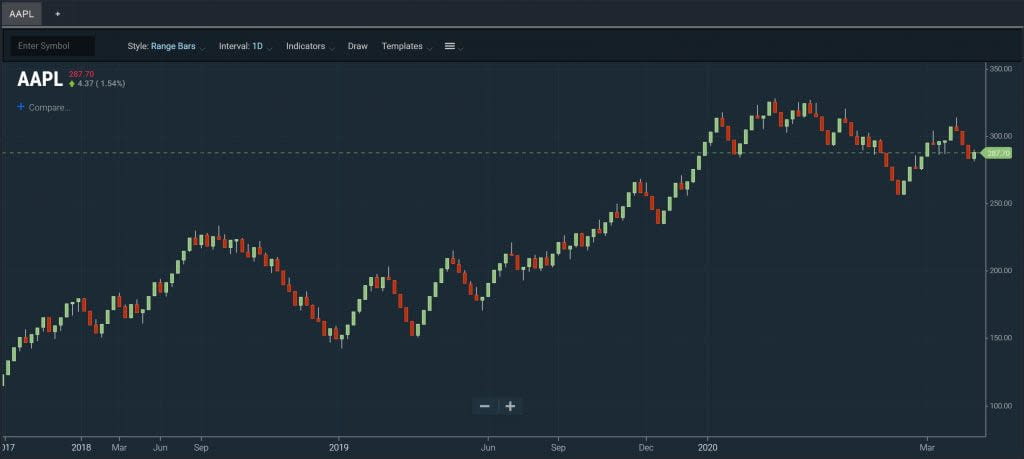
Range bar charts don’t typically allow candlestick patterns to show through, since price variations that don’t exceed the set range will not appear on the chart. However, it’s possible to use range bars in conjunction with a volume chart. In this case, bars with high volume may hint at the end result of a battle between bulls and bears. That end result may set relatively strong support and resistance levels or help define a price range for range-bound trading that follows.
Conclusion
While the candlestick chart is by far the most popular type of chart among technical traders, it’s not the only option available for looking at price movements. Heikin-Ashi charts, line charts, equivolume charts, and range bar charts are several alternatives that can help you identify trends, spot support and resistance levels, and predict the success of a breakout. Using one or more of these chart types to supplement candlestick charts is a powerful way to improve your technical analysis and spot new trading opportunities.
Related Reading:
- A Comprehensive Guide to Moving Averages
- Ultimate Guide to Technical Stock Screeners
- How to Find Breakout Stocks
Ready to start scanning? Try for free and choose the plan that fits your workflow.