While it can be tempting to build a highly complex stock screener with dozens of parameters, the best stock screeners are often also the simplest. The Easy Scanner in Scanz enables you to quickly create custom, streamlined stock screens that highlight the most important market information of the day.
In this guide, we’ll focus in on the Easy Scanner to show you what it can do and how it can help you find trading opportunities.
What Can the Easy Scanner Do?
The Easy Scanner may be simple, but it is extremely powerful. With this stock screener, you can break down stocks by market or industry and apply a number of basic filters to home your screen. The Easy Scanner’s filters cover the key factors you need to know when looking for trading opportunities – factors like market cap, percent change on the day, and current trading volume.
On top of that, the Easy Scanner enables you to add an unlimited number of columns to your results table. So you can sort stocks not just by price and volume, but also by technical indicators like MACD or RSI. It’s an excellent starting point to find potential trading opportunities and dig into technical data before zeroing in on a single stock.
Putting the Easy Scanner to Work
There are dozens of different ways to use the Easy Scanner to find trading opportunities. Just choose what markets to look for, set your filters and table columns, and then sort your results.
To help you get started, let’s take a closer look at some of our favorite Easy Scanner scans.
Active Stocks
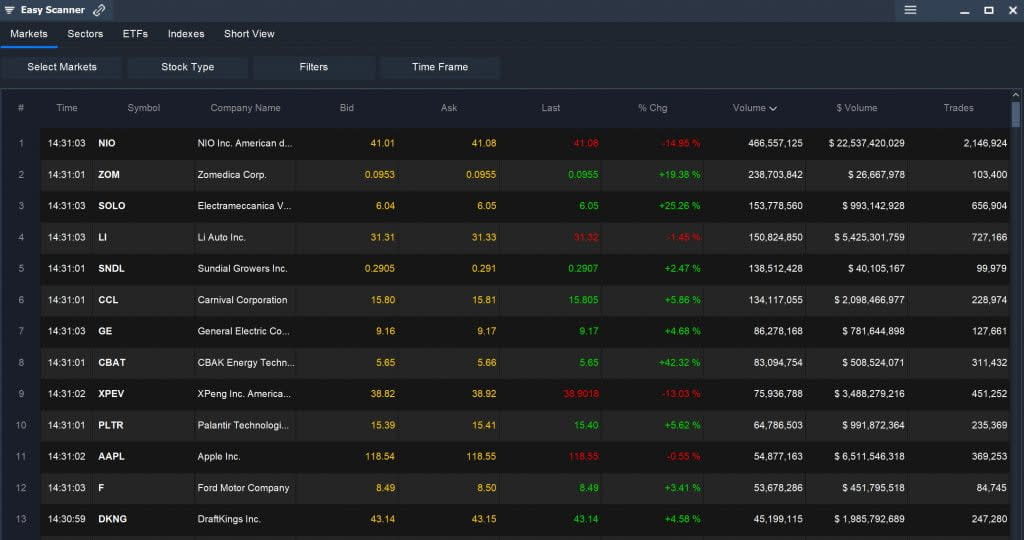
One of the best ways to use the Easy Scanner is to scan the market for the stocks that are seeing the most trading action on the day. Just open the Easy Scanner and sort by Volume or Trades, and you’ll immediately be presented with stocks that are leading the stock market in trading activity. Not surprisingly, these are often some of the biggest gainers and losers of the day, too.
Of course, you can easily narrow your search. Add filters for market cap or share price, or use the Easy Scanner to screen for stocks in a specific market sector.
Top Gainers
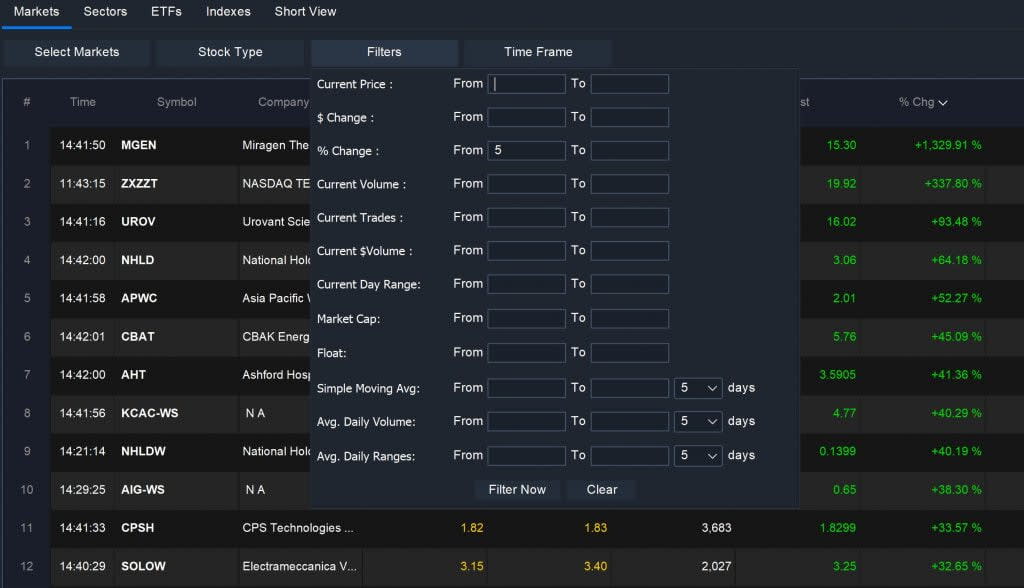
The Easy Scanner also enables you to quickly find stocks that are posting significant gains. In the Filters menu, find % Change and then enter a minimum percent change in the ‘From’ box – 5% is a good minimum to use for most scans. Then hit ‘Filter Now’ to apply the filter and sort your results by % Change. If you are looking for the most liquid opportunities, you can add a “Current Trades” filter and set the minimum number of trades to 5,000.
Keep in mind that penny stocks can often be the biggest gainers on the market. If you don’t want to see these stocks in your results, just uncheck ‘OTC’ under the ‘Select Markets’ menu.
Volatility
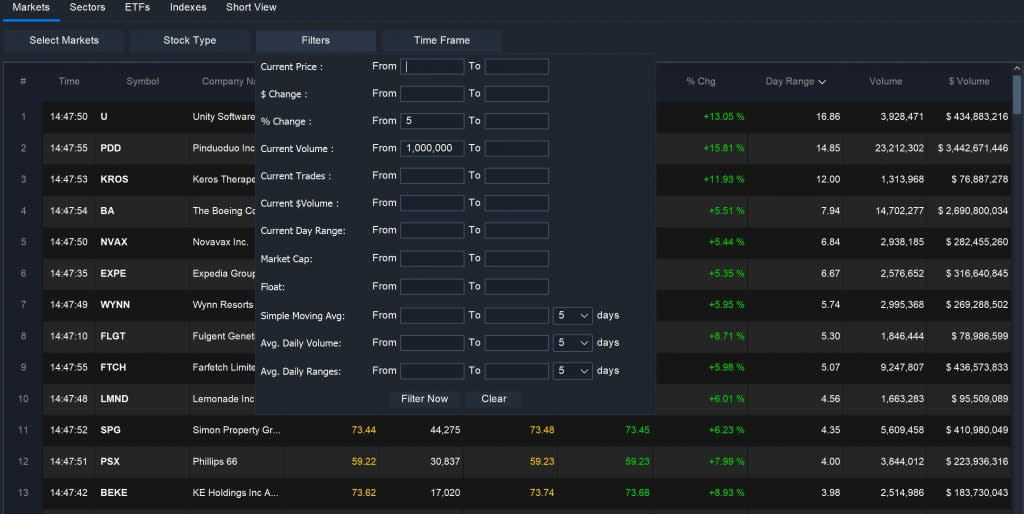
You can also look for stocks that are experiencing a lot of volatility. To screen based on volatility, it’s a good idea to add filters for percent change and volume. A greater percent change is typically a sign of volatility, and higher volume is a sign that the volatility is supported by the market.
Once you’ve added these filters, add a ‘Day Range’ column to your results and sort by that parameter to spot high volatility stocks.
Underperformers
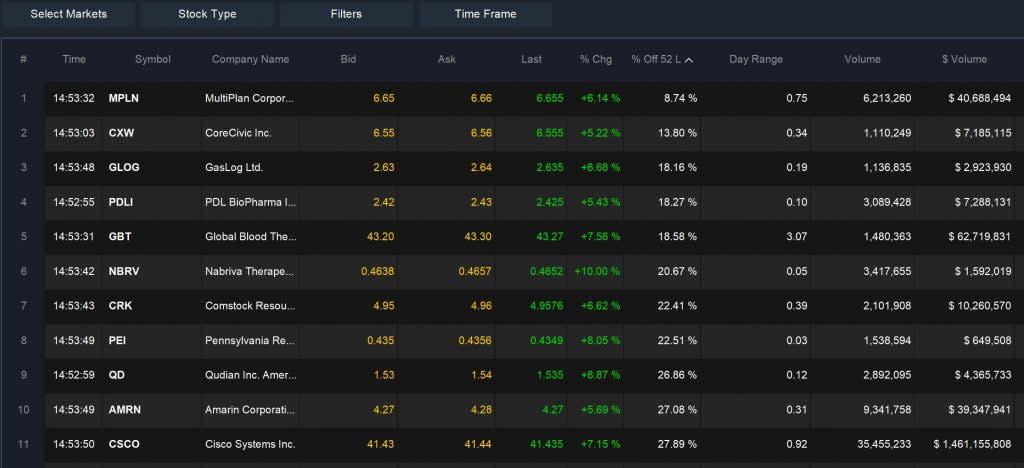
Underperforming stocks could be good targets for value investing. You can find stocks that are lagging the market using the Easy Scanner by looking for stocks that are close to their 52-week low. Enter any price or volume filters for your strategy, then sort your results by ‘% Off 52 L.’ Make sure to sort from lowest to highest – the lower the % Off 52 L value, the closer the stock price is to the 52-week low.
Outperformers
The Easy Scanner also enables you to search for stocks that are chasing new highs and outperforming the overall stock market. In this case, you’ll sort stocks by ‘% Off 52 H’ – that is, the 52-week high. Once again, make sure to sort from lowest to highest to find stocks that are closer to hitting new highs. If you see a negative value, that means that the stock has hit a new 52-week high today.
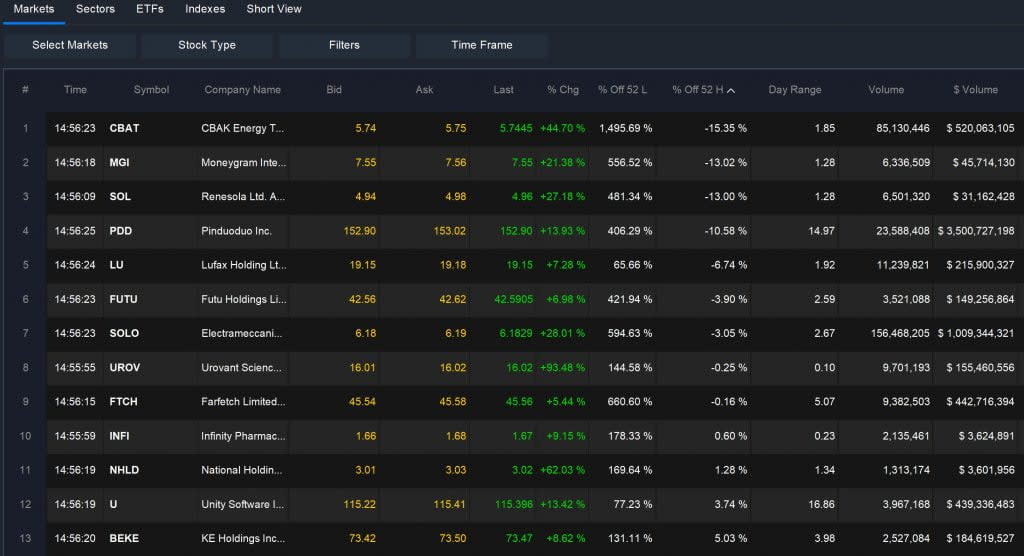
The Easy Scanner also enables you to search for stocks that are chasing new highs and outperforming the overall stock market. In this case, you’ll sort stocks by ‘% Off 52 H’ – that is, the 52-week high. Once again, make sure to sort from lowest to highest to find stocks that are closer to hitting new highs. If you see a negative value, that means that the stock has hit a new 52-week high today.
Conclusion
The Easy Scanner in Scanz allows you to quickly scan the market for trading opportunities based on important factors like price changes, volume, and volatility. By stripping down your scans to just a few basic filters, it’s easier to take a broad look at the market or an individual sector. Be sure to take advantage of the Easy Scanner’s sorting tools, which helps you spot stocks that are leading in any parameter and might be good targets for trading.
Related Reading:
- How to Use a Stock Screener
- Ultimate Guide to Technical Stock Screeners
- Relative Volume Scanner: Find the Most Active Stocks
Ready to start scanning? Try for free and choose the plan that fits your workflow.