As a day trader, it’s important to understand basic market principles before attempting to develop a profitable trading strategy. Knowing how the market operates can help demystify the elusive world of day trading and allow you to create strategic trading plans.
While there are a few basic prerequisites to day trading, the first thing you’ll need to know is what causes a stock price to move up and down. After all, the main job of a day trader is to formulate hypotheses about whether a stock will increase or decrease in price. In order to make these predictions, you’ll need to understand what causes price movement.
Let’s get to it.
What Causes a Stock Price to Go Up or Down?
There are plenty of different factors that can affect a stock’s share price, however all of these factors operate around the same basic economic principle: supply and demand. “Supply” represents sellers and “demand” represents buyers.
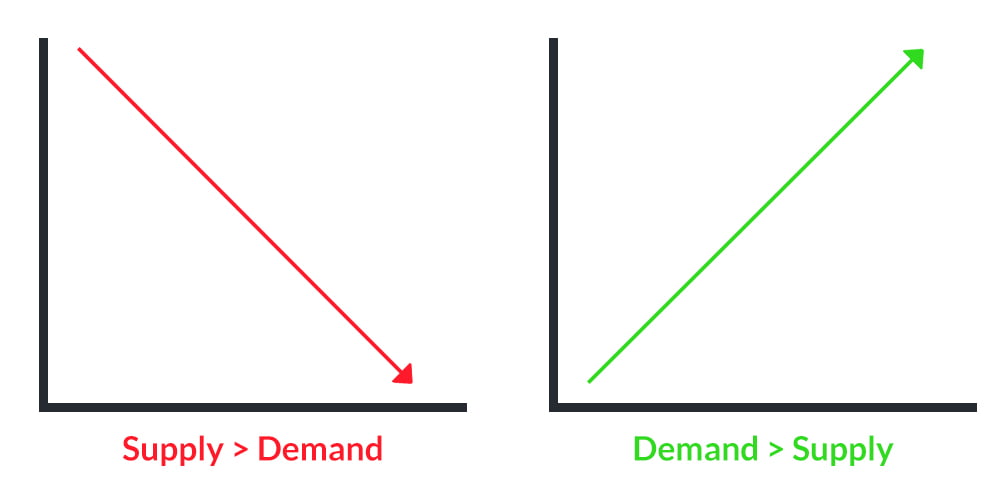
- When a stock’s supply (sellers) is greater than its demand (buyers), the stock price will go down.
- When a stock’s demand (buyers) is great than its supply (sellers), the stock price will go up.
The influence of supply and demand is ubiquitous. In fact, our lives are affected by supply and demand principles on a daily basis. Here’s an example:
If Apple creates 1000 iPhones (supply) to sell for $400 each but only 500 people (demand) want to buy iPhones for $400, what is Apple going to do? If you guessed that Apple would have to lower the price of their iPhones, you’d be correct. Contrarily, if 2000 people were willing to pay $400, Apple may be able to increase the price.
The same logic holds true in the stock market. If everyone wants to buy AAPL stock at $140, the price will continue to increase until an equilibrium price (supply=demand) is reached. Of course, supply and demand levels are always fluctuating; therefore stock prices are as well.
Measuring Supply and Demand
We know how supply and demand levels affect a stock’s price, but how do we measure these levels?
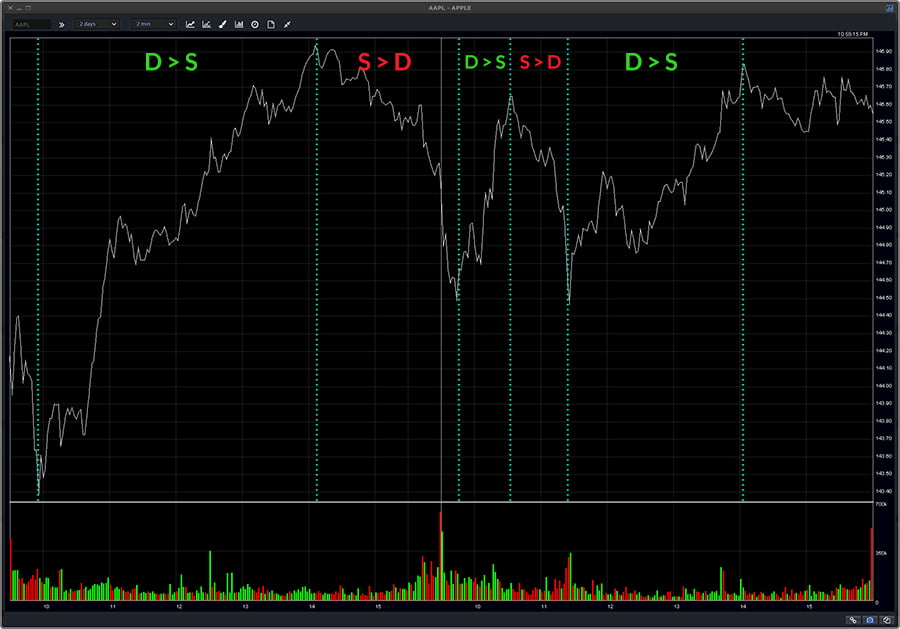
First things first, we can analyze a stock chart.
A downtrend suggests that supply levels exceed demand levels, whereas an uptrend suggests that demand levels exceed supply levels.
Here’s an example:
Stock charts are helpful for gauging supply and demand, but they only show historical data. While historical data can be great for making longer-term market predictions, day traders generally require access to real-time information. This is where level 2 screens come in.
Introduction to Level 2 Screens
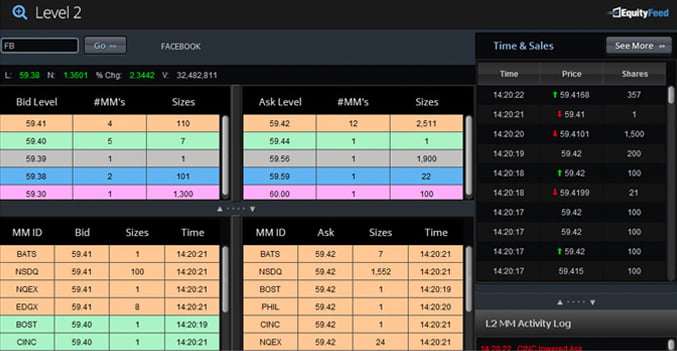
A level 2 screen is a real-time supply and demand table that provides traders with insights about buying and selling activity.
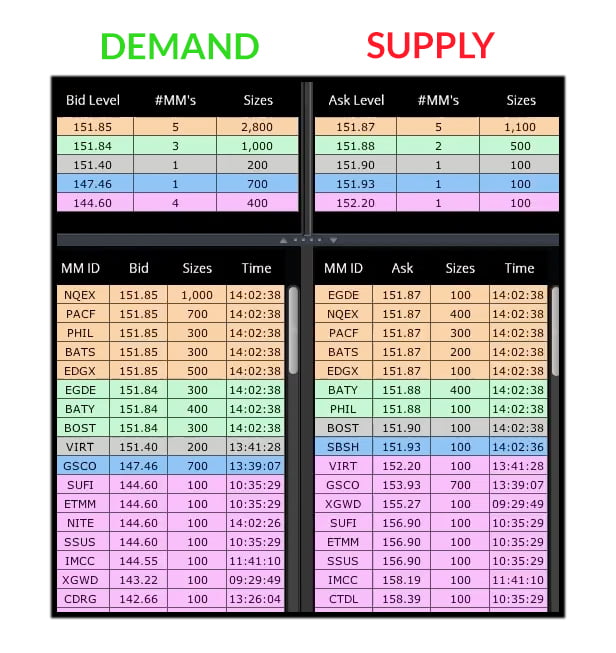
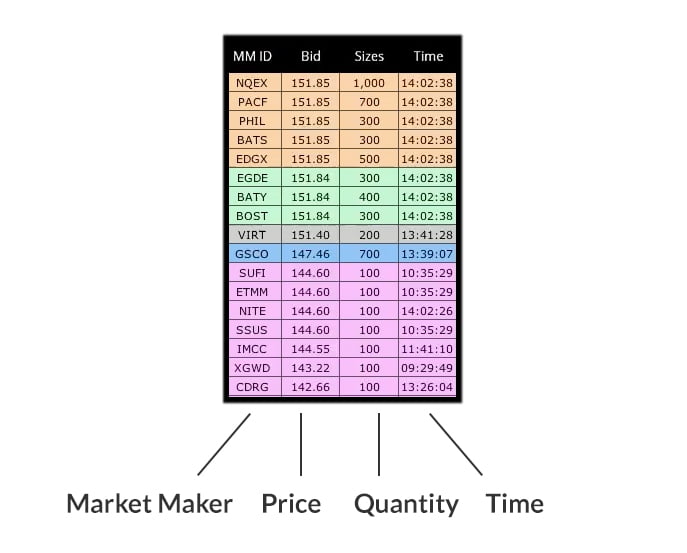
Level 2 Screens are split into two tables. The left table represents the buyers (demand) and the right table represents the sellers (supply).
Both of these tables have rows comprised of the following elements:
- Market Maker – The market makers are the parties responsible for fulfilling trades. For example, when you enter an order to buy a stock at a specific price, it is sent to a market maker who fulfills the order on your behalf and provides you with your shares.
- Price – The price represents what a buyer is willing to pay (the “Bid”) or what a seller is willing to sell for (the “ask”).
- Quantity – Quantity represents the size (or volume) of the order.
Some Level 2 providers (such as EquityFeed) will also add a Price column to reflect the time of the order.
Level 2 screens add a new layer of depth to your market analysis by allowing you to see the orders placed by other traders. Think of level 2 screens as a marketplace of buyers and sellers. Whenever a buyer and seller agree on a price, a trade is executed. Sometimes, this can happen in a fraction of a second and other times it can take much longer.
Using Level 2 Screens for Day Trading
Level 2 screens are designed to help traders gauge supply and demand levels so that they can make better predictions about future price movement. Level 2 screens also shine light on trading activity from retail and institutional traders.
It’s important to remember that not every buy/sell order is significant. You do not want to stare at a level 2 screen and try to make sense of every trade. You’re not trying to uncover some secret conspiracy or put together a sophisticated formula for measuring trading activity. You are simply trying to get a basic understanding of the market place so you can predict future price movement.
Supply and Demand
Start by gauging supply/demand levels. For example, if you see 5 sellers looking to unload 1,000 shares each at $5 and 1 buyer looking to buy 100 shares for $5, you can assume that the stock price is going to drop because the supply overwhelmingly exceeds the demand. If these sellers want to unload all of their shares, they’ll have to drop their ask prices to meet the bids of other buyers.
Block Trades
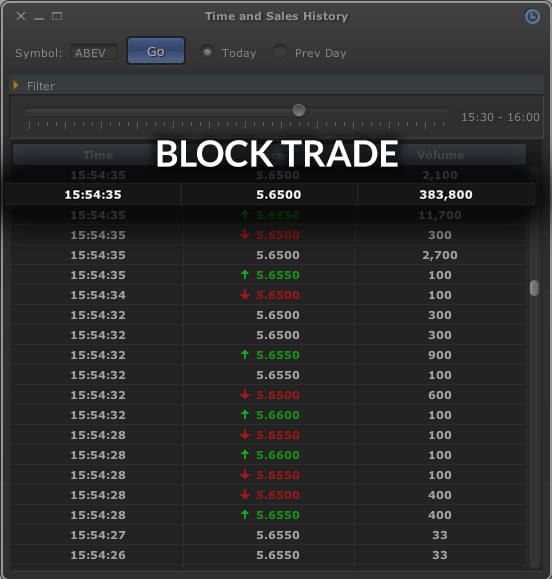
You’ll also want to look out for abnormal trading activity. For example, let’s assume a stock generally trades in order sizes of $2000-$5000. If you see a buy or sell order for $100,000, you can assume there is some unusual interest in a stock (i.e. institutional buying/selling or dilution) and plan accordingly. These types orders are referred to as “block orders” and they can have an impact on trading activity. For example, if a stock is trading at $4.80/share with $2,000,000 dollar volume on the day and there is a $500,000 sell order at $5, you can assume that it may be difficult for the stock to break above $5 with ease.
Other Considerations
Mastering level 2 screens takes time and we will go over more advanced topics at a later point. Here are a few things to look out for:
Hidden Size
We’ve discussed how level 2 can help you gauge supply and demand, however you don’t always have access to all of the data. Market makers can use “hidden size” to unload a larger order without scaring the markets. For example, let’s say a market maker wants to unload 100,000 shares of a stock. They know that placing a 100,000 sell order may scare away some traders, so they may break that down into 10 separate 10,000 share orders. This means, traders will only see 10,000-share sell orders when there are really 100,000 shares for sale (meaning that price point may be a resistance level).
Controlling Market Makers
It can be helpful to pay attention to which market makers are dominant in a stock. This can be particularly helpful when analyzing the level 2 screens of illiquid stocks. For example, if the market maker VFIN is one of the biggest sellers of a stock every day, a trader may not want to initiate a swing trade until VFIN is finished unloading shares.
Direct Routing
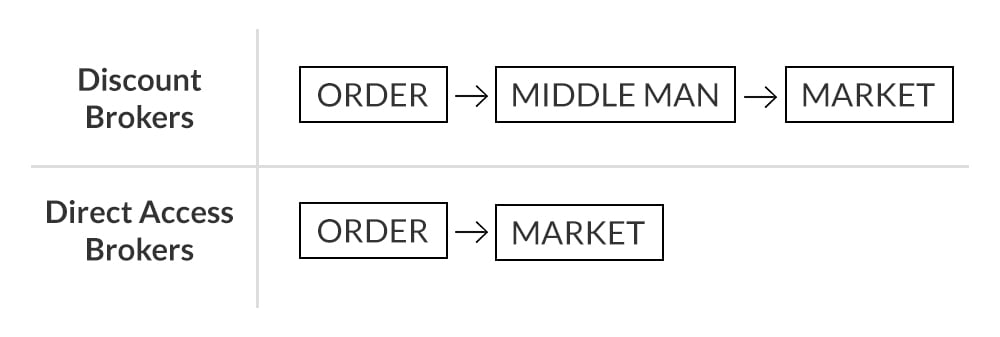
Most discount brokers will automatically route your order to a market maker or ECN of their choosing. While many traders are okay with this, some traders prefer to choose the route of their orders. This can allow for faster executions and better entries/exits. For example, if you see that the market maker NITE is selling 1,000 shares of a stock at $1.10/share, you may want to route your order directly to this market maker to get a faster execution.
If you would like to choose your order routes, you will need to work with a direct access broker.
Adding/Removing Liquidity
Liquidity refers to the ease with which a stock can be bought or sold. For example, a penny stock with less than $1,000,000 volume would be considered illiquid whereas a NASDAQ with $20,000,000 volume would be considered liquid.
When you buy on the ask or sell on the bid, you are removing liquidity. When you place buy orders below the current bid or sell orders above the current bid, you are adding liquidity. Many brokers will provide rebates to traders who add liquidity. While this shouldn’t drastically affect your trading strategy, you should still be aware of this.
Level 2 “Games”
When it comes to level 2, the old adage, “don’t believe everything you see” holds true. An order isn’t “real” until it is executed. Market makers (and other traders) can play games in attempts to influence the markets. For example, a market maker may show a 500,000 share sell order to scare buyers and entice short sellers. Once the price drops, the market maker may remove that order and start buying shares at a cheaper price.
Once again, you don’t want to overanalyze level 2 screens, but it’s important to get a basic understanding of how they work.
Wrapping it Up
Level 2 screens are a great tool for gauging supply and demand and developing a better understanding of daily trading activity. When analyzed properly, they can help traders better predict the markets. Level 2 screens are best used alongside your other trading tools (such as charts) to gain deeper insights.
How do you use level 2 screens in your trading? Share in the comments!

