Momentum is a key attribute that traders look for when searching for trading opportunities. While there are many different technical indicators focused on momentum, one of the most popular is the MACD indicator. MACD works well on its own or in conjunction with other indicators like moving averages to help you spot stocks that are trading with momentum
In this guide, we’ll explain everything you need to know about MACD and show you how to create MACD stock screeners with Scanz.
What is MACD?
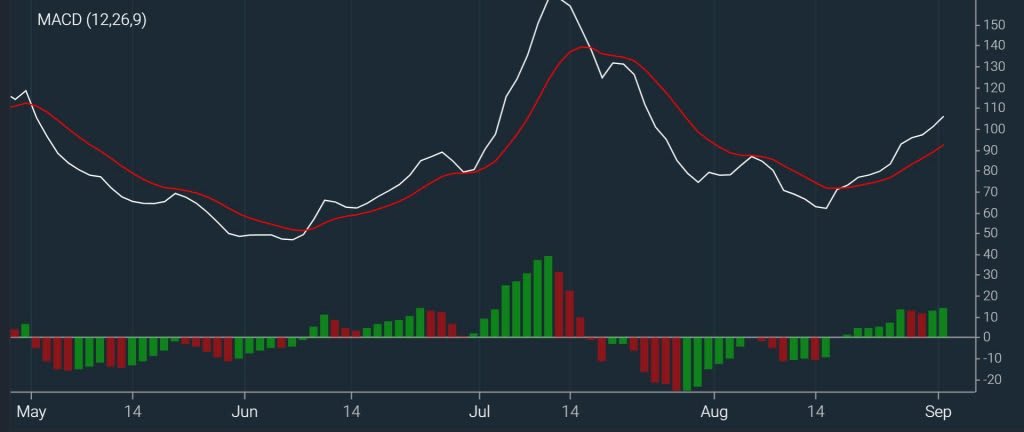
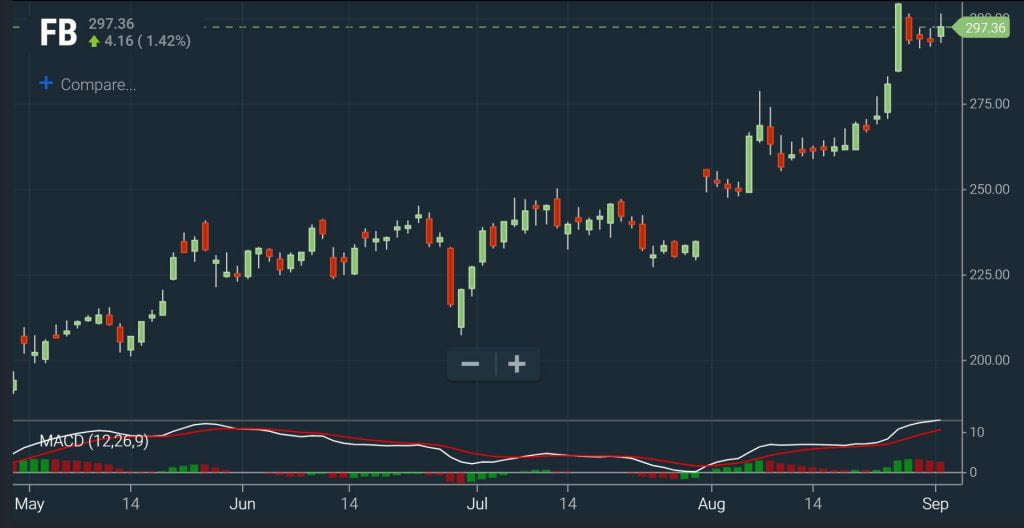
MACD (moving average convergence-divergence) is an indicator that tracks two different moving averages of a stock’s price. The shorter moving average is the 12-day exponential moving average and the longer moving average is the 26-day exponential moving average. MACD itself is simply the difference between these two plotted as a line over time.
The MACD value can be helpful, but most uses of MACD incorporate what’s known as the MACD signal line. This is a 9-day exponential moving average of the MACD value. When MACD crosses above or below the signal line, it is often interpreted as a buy or sell signal.
It’s worth pointing out that all moving averages used in calculating MACD and signal line are exponential moving averages. This is important because exponential moving averages give greater weight to recent price data. So, MACD more closely follows price action than some other indicators that rely on simple moving averages.
How Do You Trade with MACD?
MACD is positive when the 12-day moving average is greater than the 26-day moving average. The bigger the difference between these two moving averages, the more positive or negative MACD will become (that is, it will move further away from a value of zero).
While this can be useful in some cases, most traders look at the relationship between MACD and its signal line for trading cues. When MACD crosses above its signal line, that is an indicator of positive momentum and can be interpreted as a buy signal. When MACD crosses below its signal line, that is an indicator of negative momentum and can be interpreted as a sell signal.
The difference between MACD and its signal line can be calculated explicitly and displayed as a histogram. When the histogram crosses from negative to positive, that represents a positive MACD crossover. When the histogram crosses below zero, that represents a negative MACD crossover.
Creating a Basic MACD Scan
You can create a simple scan to look for MACD crossovers using the Scanz Pro Scanner. To ensure that your screen is only identifying stocks that have experienced a crossover during the current trading, we will compare two versions of MACD:
MACD Histogram (Daily, 10, 26, 9) is less than or equal to VALUE 0
AND
MACD Histogram (Daily, 12, 26, 9) is greater than VALUE 0
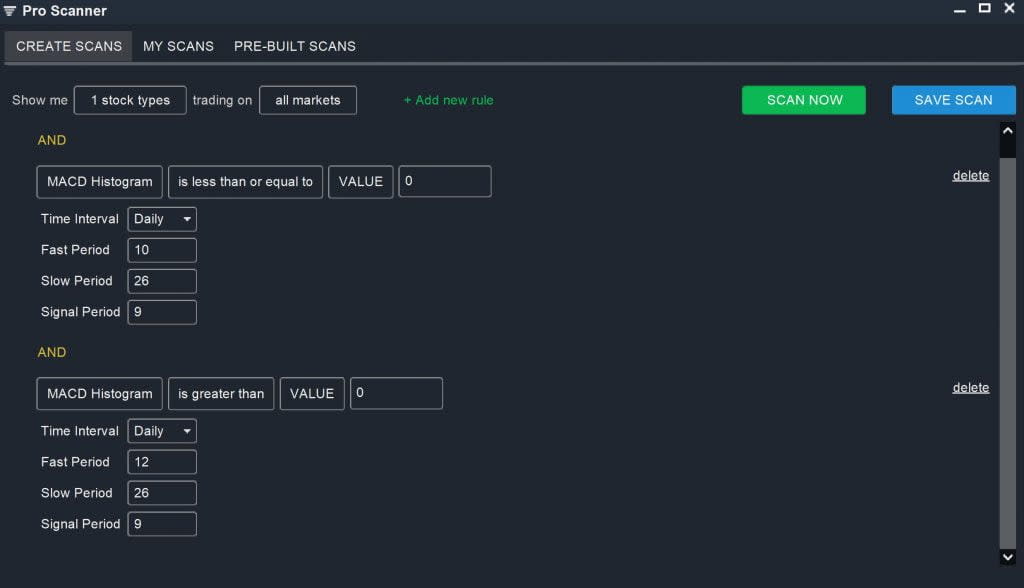
Note that in the first parameter, the short-term moving average used in calculating MACD has been changed from 12 days to 10 days. This limits your screener results to only stocks that have experienced a signal line crossover during the current day of trading.
You may also want to pair this scan with price or volume filters to find stocks that are crossing above their signal line with strong support. You can add these to your screen directly to limit your results, or sort your screen results by % Change or $ Volume.
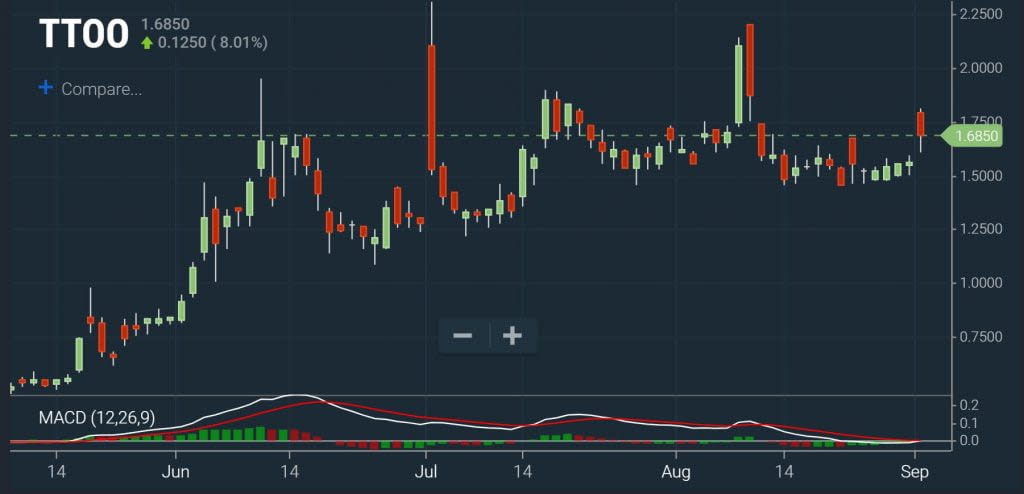
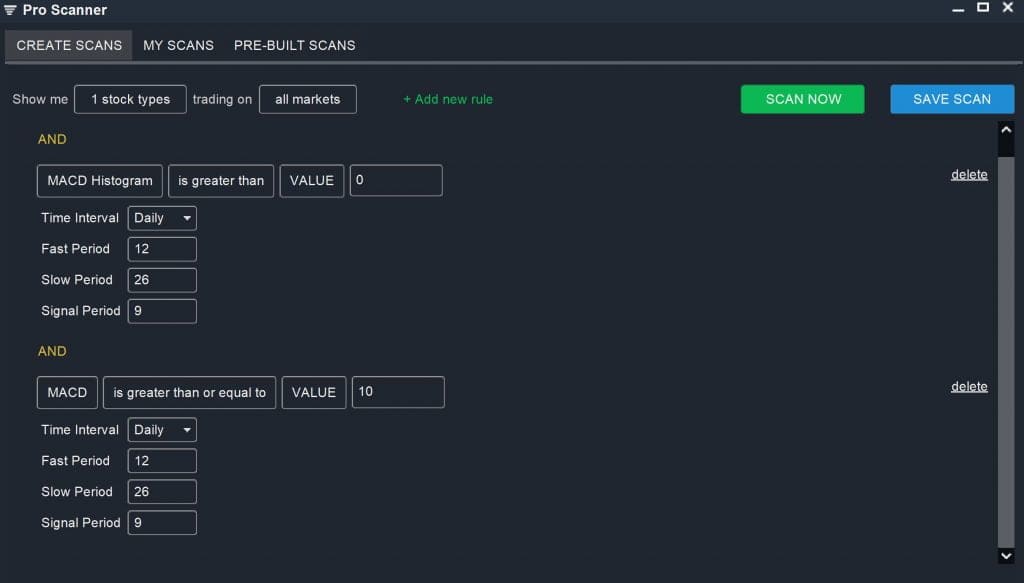
Another way to screen stocks using MACD is to look for stocks that may be in the middle of a run of strong momentum. In this case, you will want to identify stocks that have a strong MACD value as well as a recent positive signal line crossover. The higher the MACD value, the greater the short-term price gains in the stock.
MACD Histogram (Daily, 12, 26, 9) is greater than VALUE 0
AND
MACD (Daily, 12, 26, 9) is greater than or equal to VALUE 10
Using MACD with Other Indicators
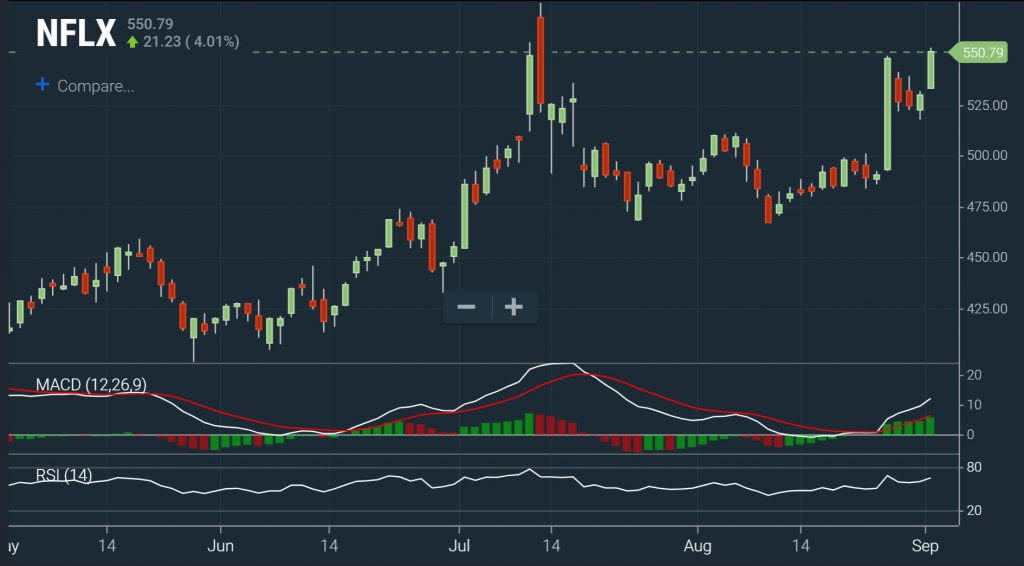
It’s important to keep in mind that while MACD is popular, it isn’t always perfect. The indicator is very good at identifying momentum as a stock gains steam, but it does a somewhat poor job of predicting reversals. MACD is prone to signal line crossovers that don’t reflect a coming reversal. So, many traders use MACD in a system with additional indicators like RSI (relative strength index).
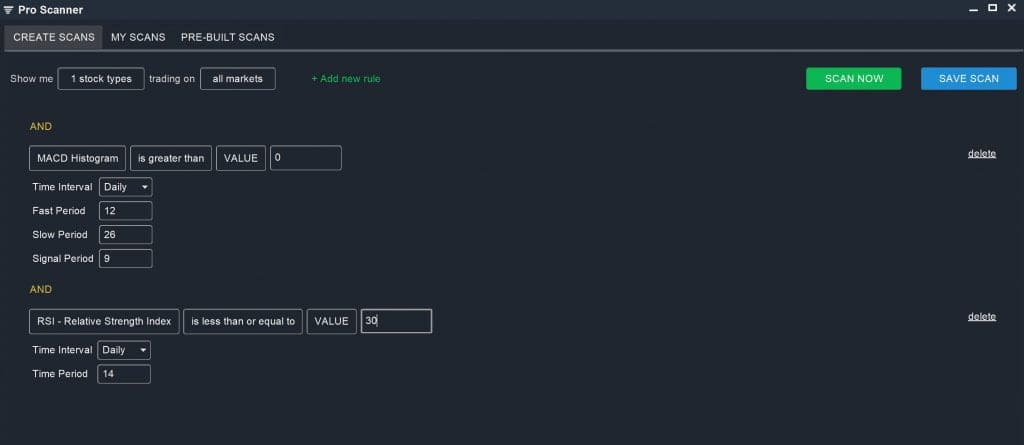
RSI indicates whether a stock is overbought or oversold with respect to recent market conditions. An RSI value over 70 signals that a stock is overbought, while a value under 30 indicates that it is oversold. A trading system that combines MACD and RSI could, for example, look for positive MACD crossovers in stocks that are oversold:
MACD Histogram (Daily, 12, 26, 9) is greater than VALUE 0
AND
RSI – Relative Strength Index (Daily, 14) is less than VALUE 30
However, this screen rarely returns results since traders are likely to buy up stocks well before all the lights turn green. An alternative screen combining MACD and RSI could look for stocks that have positive momentum, but that are not yet overbought:
MACD Histogram (Daily, 12, 26, 9) is greater than VALUE 0
AND
RSI – Relative Strength Index (Daily, 14) is equal to or less than VALUE 70
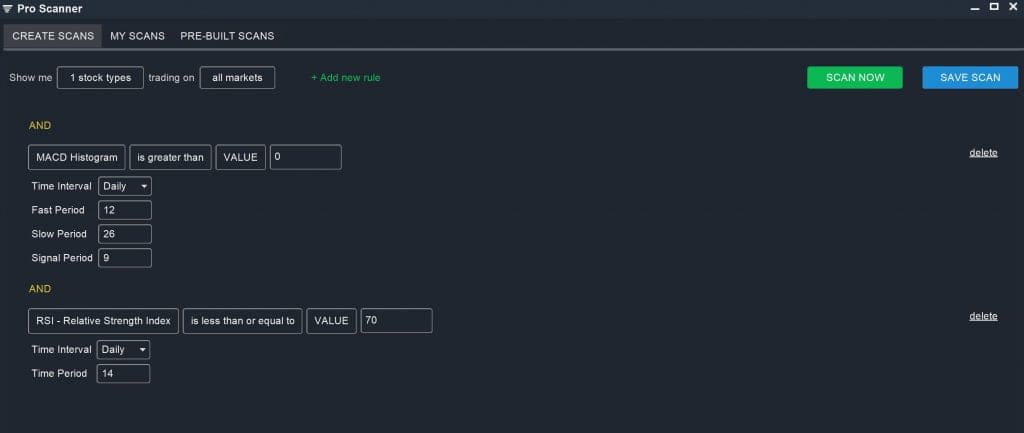
These stocks may have already produced significant gains, but they still have upside potential since neither MACD nor RSI are signaling a reversal.
Keep in mind that while MACD can be helpful, it isn’t necessary in every scan. Like all indicators, it is an imperfect signal that is open to interpretation. When building scans primarily based on other parameters, such as RSI or moving averages, you may be better off leaving MACD out rather than adding it in. When building stock screens, less is often more.
Conclusion
MACD can be a powerful tool for identifying momentum stocks. It’s particularly popular among traders because the signal line provides a built-in mechanism for triggering buy and sell signals based on momentum shifts. Be cautious when using MACD to trade reversals, though, since the indicator often issues false crossovers at market tops and bottoms. If you want to get even more out of MACD, try combining it with other technical indicators like RSI.
Related Reading:
- The MACD Indicator: A Complete Guide
- RSI Stock Screeners: Pairing Momentum Indicators
- Moving Average Crossover Scans
- Pro Scanner Setup for Trend Following Strategies
Ready to start scanning? Try for free and choose the plan that fits your workflow.