While monitoring major indices like the S&P 500 or the NASDAQ Composite can help you gauge how the market is performing, there’s often more to performance than meets the eye. In order to get a full picture of what’s going on in the market, it’s important to look at market internals. Market internals offers a more nuanced view of the market so that you can find out exactly what is driving price movements.
In this guide, we’ll explain what market internals are, how to find them in Scanz, and how you can use them to improve your trading.
What are Market Internals?
Market internals are a set of indicators that offer a look beneath the market’s surface. These metrics offer an inside look at how money is flowing in and out of the market, and how the hundreds or thousands of individual stocks that make up a market-wide index are changing in real-time.
For example, market internals offer information about the volume of trades flowing through a market. They also indicate whether individual stocks are gaining or losing value as trading progresses, allowing you to look past aggregate market movements. Market internals can even offer insights into when the market is reaching extreme levels or when volatility is expected to rise.
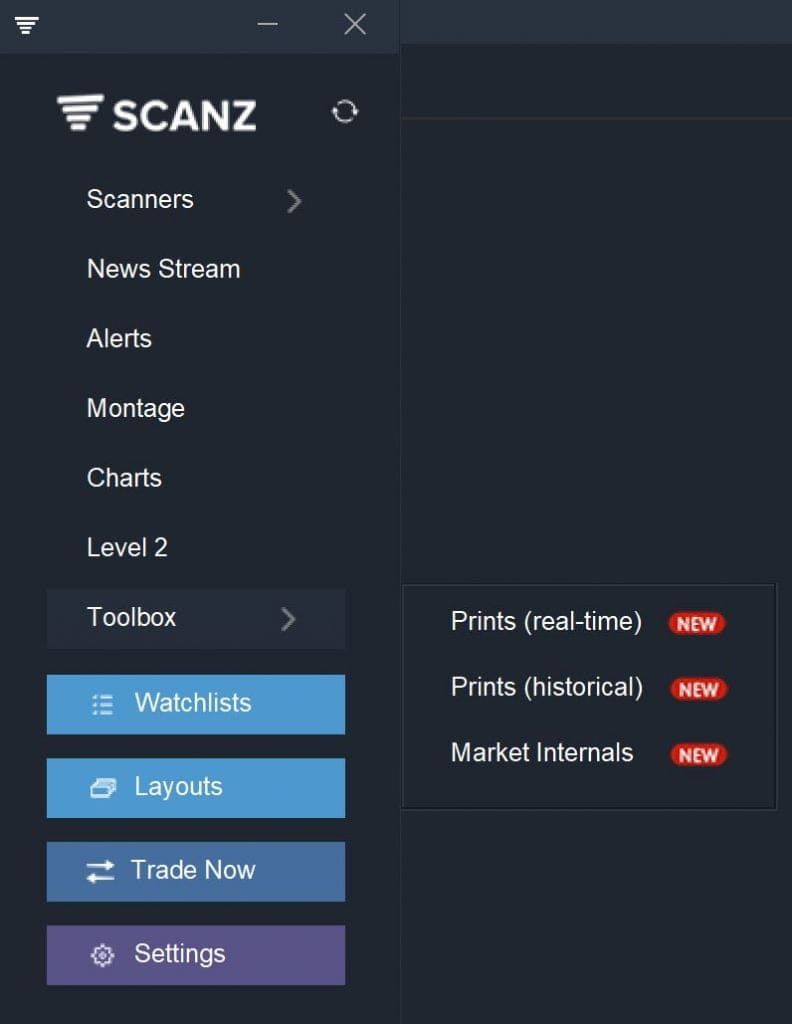
Accessing Market Internals in Scanz
Market internals are one of the tools available in the Scanz Toolbox. From the main Scanz menu, just click ‘Toolbox > Market Internals’ to start viewing the data. You can use the drop-down menu at the top of the window to switch between markets.
Understanding the Data: Key Market Internals
In order to use market internals effectively as part of your trading strategy, you need to know what these metrics mean. So, let’s take a closer look at some of the key market internals.

Advancers and Decliners
For every market, it’s possible to look at every listed stock and ask whether its value has gone up over the day or gone down over the day. The number of advancers is the number of stocks that have gained value since market open, while the number of decliners is the number of stocks that have lost value. You’ll also find unchanged stocks, which is the number of stocks that have the same value they had at market open.
Total Volume
Total volume represents the total number of shares that have traded hands since market open. In order to make this value useful, it’s helpful to know the average daily volume of the major markets. For the NASDAQ, around 5.1 million shares are traded on the average day. For the NYSE, the number is around 4.7 million.
Total $Volume
Total volume tells you the total number of shares that were traded, but it doesn’t tell you how much those shares were worth. That’s where total dollar volume ($Volume) comes into play. $Volume can be a better indicator of liquidity than total volume, especially if you’re interested in OTC markets.
Total Trades
It’s possible that much of the trading volume and $Volume in the market is associated with just a few block trades. So, you also need to know the total number of trades that are happening. Total trades is just the total number of trades that have occurred, regardless of how many shares were involved in each trade.
The Benefits of Reviewing Market Internals
Market internals can be helpful in several different ways. In a broad sense, they give traders a more comprehensive view of how the market is performing. Instead of knowing simply whether, say, the NASDAQ is rising or falling and by how much, you can use market internals to find out whether trading volume on the NASDAQ is above or below average and whether stocks on the NASDAQ are generally gaining or losing value.
The number of advancers and decliners can be particularly useful when looking at market cap-weighted indices like the S&P 500. If the S&P 500 is up by 2%, it could be because all of the stocks in the index are up 2%. Or it could be because Apple, Facebook, and Amazon are each up 5%, while most stocks in the index are actually down 2% for the day. The number of advancers and decliners offers insight into whether an index’s performance is market-wide or limited to just a handful of heavily weighted stocks.
Market internals also enables you to go beyond indices to see if one market is doing better than another. For example, you can look at the ratio of advancers to decliners on the NASDAQ and compare it to the same ratio on the NYSE or AMEX.
The volume data included with market internals is also extremely useful for looking at liquidity. You can see not only whether trading is particularly active or particularly quiet for a given exchange, but also whether that activity is being driven by just a few high-value trades or many small-value trades.
Conclusion
Market internals are a useful tool for gauging the market’s true performance. You can easily check whether a rally is narrow or broad-based and whether trading volume is driven by a few block trades or many distributed trades. Overall, using market internals enables you to adjust your trading activity to match market conditions.
Related Reading:
Ready to start scanning? Try for free and choose the plan that fits your workflow.