The NASDAQ is home to some of the most important growth stocks in the market today. So, it makes sense that you might want to focus your trading efforts specifically on this exchange. With Scanz, you can target your screens to search only for stocks on a specific market, like the NASDAQ. In this guide, we’ll show you how to design simple NASDAQ screeners using the Easy and Pro Scanners.
Why Focus on the NASDAQ?
There are a few fundamental differences in how the NYSE and NASDAQ work, but for most traders the allure of the NASDAQ is that it’s home to many of the best-known growth stocks trading today. Many of the major stocks in tech, including Apple, Amazon, and Facebook, are traded on the NASDAQ. That’s in large part because the NASDAQ charges less expensive listing fees than the NYSE, so it’s often more appealing for young startups looking to go public.
That doesn’t mean you won’t find large, well-established companies on the NASDAQ. But, in general, limiting your stock search to this exchange will ensure that you’re primarily looking at growth-oriented stocks with somewhat more volatility.
NASDAQ Scanner Video Guide
Finding Top Stocks with the Easy Scanner
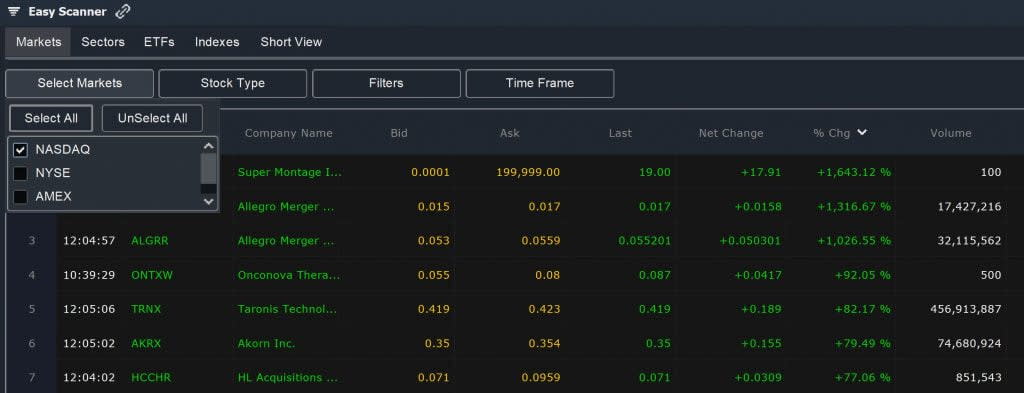
The Easy Scanner is a great tool to use for quickly finding the NASDAQ’s top gainers and losers on the day. To get the Easy Scanner set up for searching NASDAQ-traded stocks only, select the NASDAQ checkbox under the Markets tab. You may also want to set Stock Type to Regular Securities so that you’re only looking at individual company stocks, not ETFs and other asset classes.
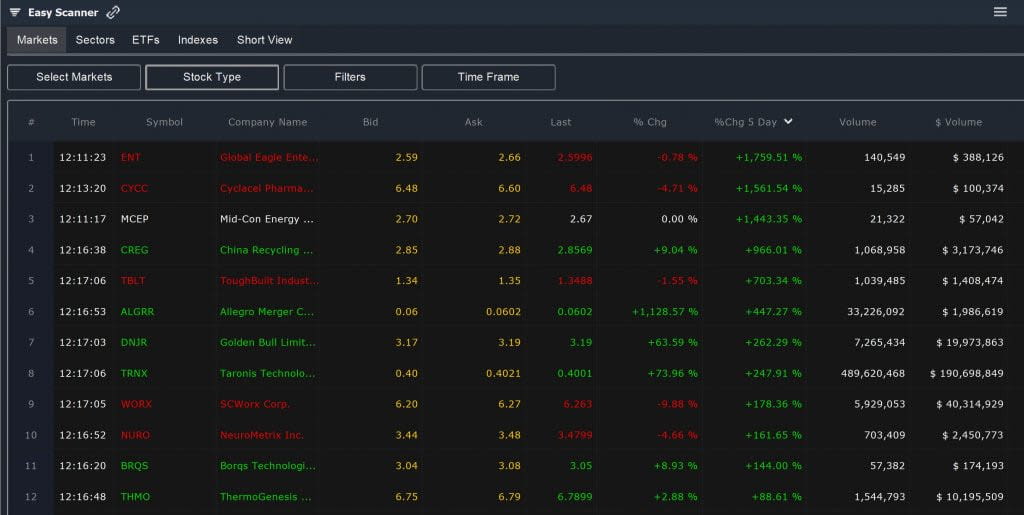
Once you’re set up, a good place to start is to simply sort stocks by % Change column, which displays the day’s gain or loss. Even on the NASDAQ, trading volume for some high-flying stocks can be low. So, it’s also a good idea to check the Volume or $ Volume when scanning for top gainers and losers.
Another way that you can use the Easy Scanner is to look at change across a whole trading week using the ‘Multiday Change’ display. Especially during volatile weeks, this indicator can cut through some of the noise so that you can pick out which stocks have truly gained ground and which have lost ground.
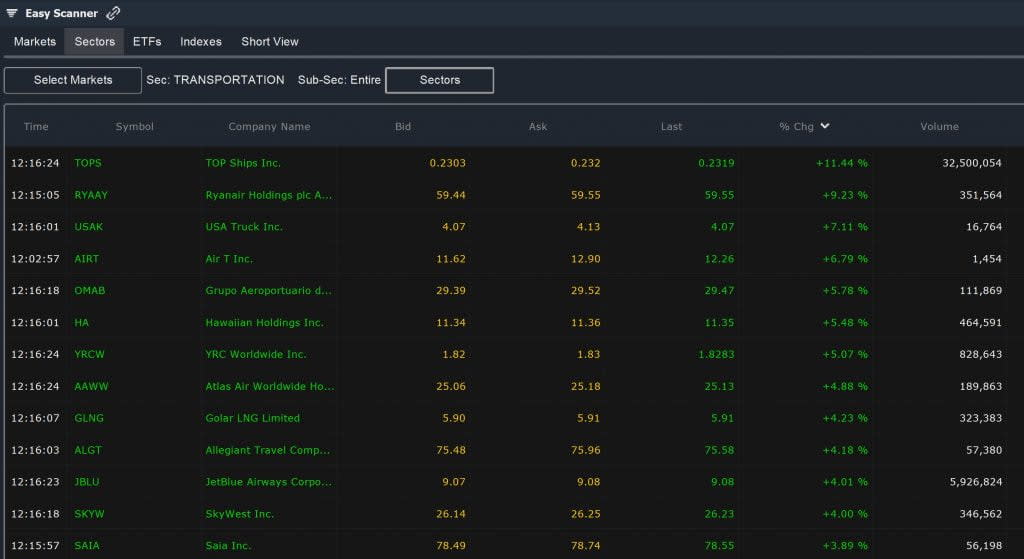
Finally, it’s possible to use the Easy Scanner to examine specific market sectors across the NASDAQ. Switch to the Sectors tab and choose a sector to see if it’s broadly gaining or losing value. Just keep in mind when scanning NASDAQ sectors that many traditional sectors, such as finance and the auto industry, are not well-represented on this exchange.
Advanced NASDAQ Stock Screens with the Pro Scanner
With the Pro Scanner, you have a lot more options for designing custom screens around stocks traded on the NASDAQ. To set up the Pro Scanner for NASDAQ screens, you’ll need to set Markets to NASDAQ only, and once again you may want to limit your scans to Regular Securities only.
With that, let’s highlight three different screens you can use to identify potential trading opportunities.
Premarket Movers
One of the best ways to use the Pro Scanner for screening NASDAQ stocks is to look for premarket gappers. This can help you start the trading day with a list of stocks to watch already in hand.
To look for stocks that are gapping up, simply create a screen for any NASDAQ stock with a current price that is 2% or more higher than its closing price:
LAST is greater than or equal to ANALYTIC PREV DAY CLOSE by 2% AND More
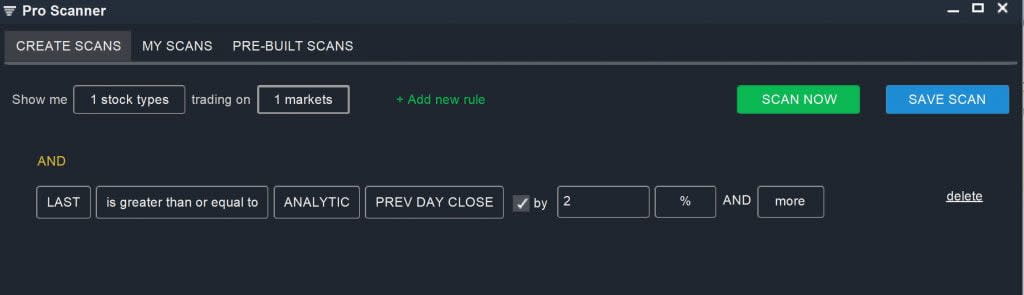
You can easily modify this scan to look for stocks that are gapping down or for stocks that are moving by more than 2% in premarket.
Long-term Performers
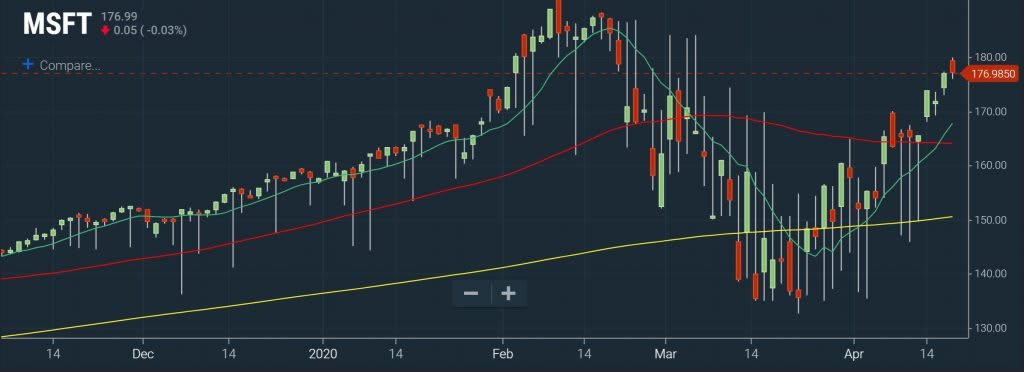
Another way to put the Pro Scanner to work is to look for stocks that have performed consistently for weeks or months at a time. In this case, you’ll use a combination of short- and long-term moving averages to identify stocks that have been consistently rising in price rather than falling.
LAST is greater than ANALYTIC Simple Moving Average (Daily, 10)
AND
Simple Moving Average (Daily, 10) is greater than ANALYTIC Simple Moving Average (Daily, 50)
AND
Simple Moving Average (Daily, 50) is greater than ANALYTIC Simple Moving Average (Daily, 200)
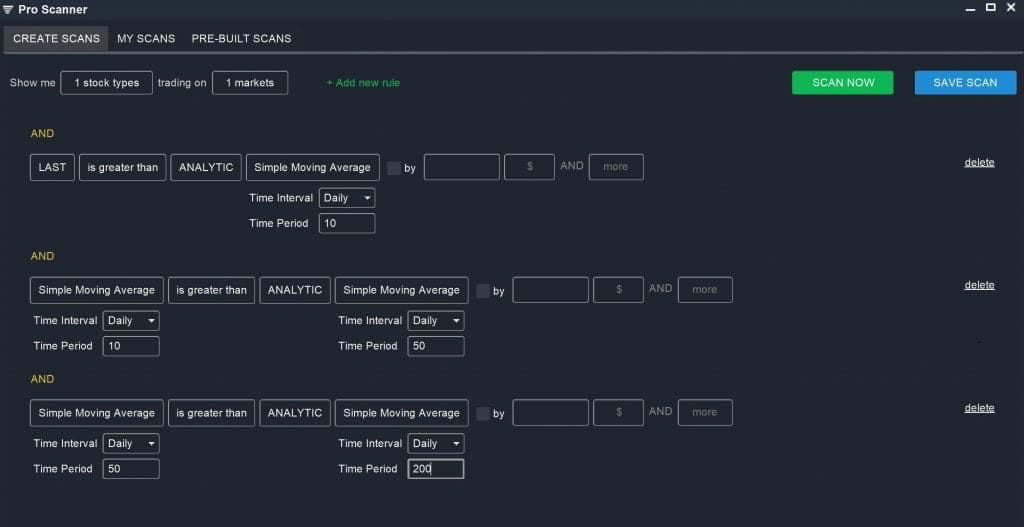
By using moving averages, you’re able to look at price trends over time. You can also invert the parameters for this scan to search for stocks that have been consistently losing value for a period of several months.
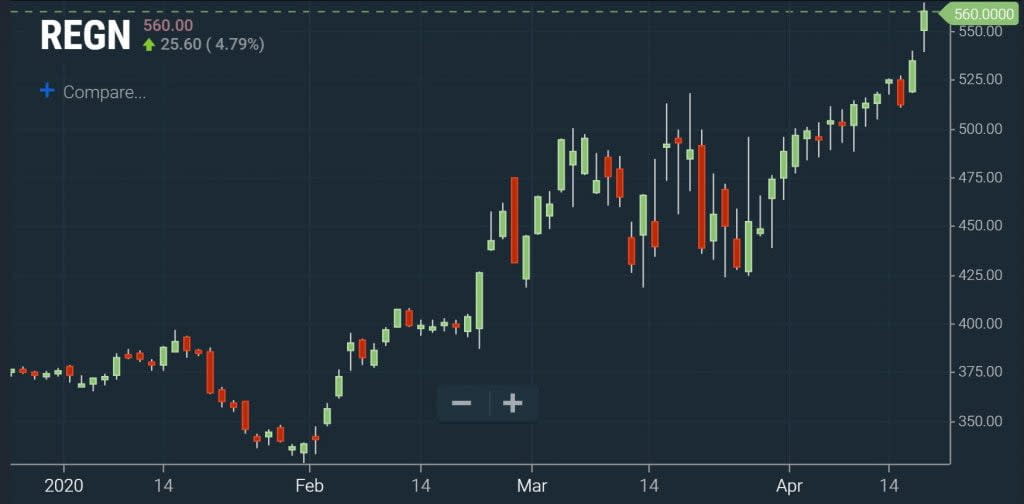
Setting New Highs
You can also use the Pro Scanner to quickly find stocks that are setting new highs. For this scan, it’s a good idea to provide some leeway to also pick up stocks that are approaching their 52-week highs or that have pulled back just slightly after setting a new high.
LAST is greater than or equal to ANALYTIC 52 WEEK HIGH by 0.98 X AND More
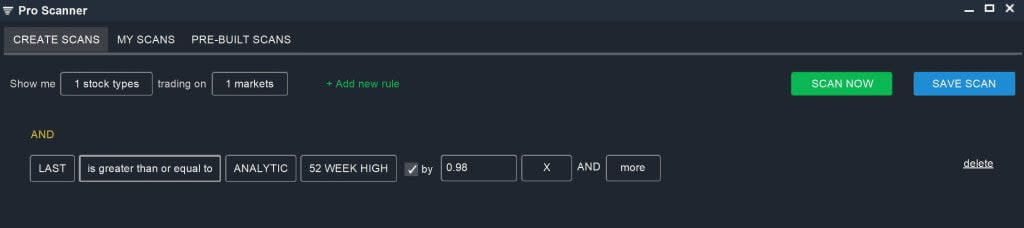
You can easily modify this scan to screen for stocks setting shorter-time highs (for example, a new 10-day high or 26-week high) or to look for new lows.
Conclusion
The NASDAQ is one of the more exciting exchanges for traders, since it’s home to many of the most explosive stocks of the last decade and continues to attract stocks with both high trading volume and moderate volatility. With Scanz, you can use either the Easy Scanner or Pro Scanner to create your own custom NASDAQ stock screener. This is a great screener to use, particularly at the beginning of each trading day, since it provides a quick view of what’s going on across the NASDAQ exchange and can help you identify stocks to watch more closely.
Related Reading:
Ready to start scanning? Try for free and choose the plan that fits your workflow.